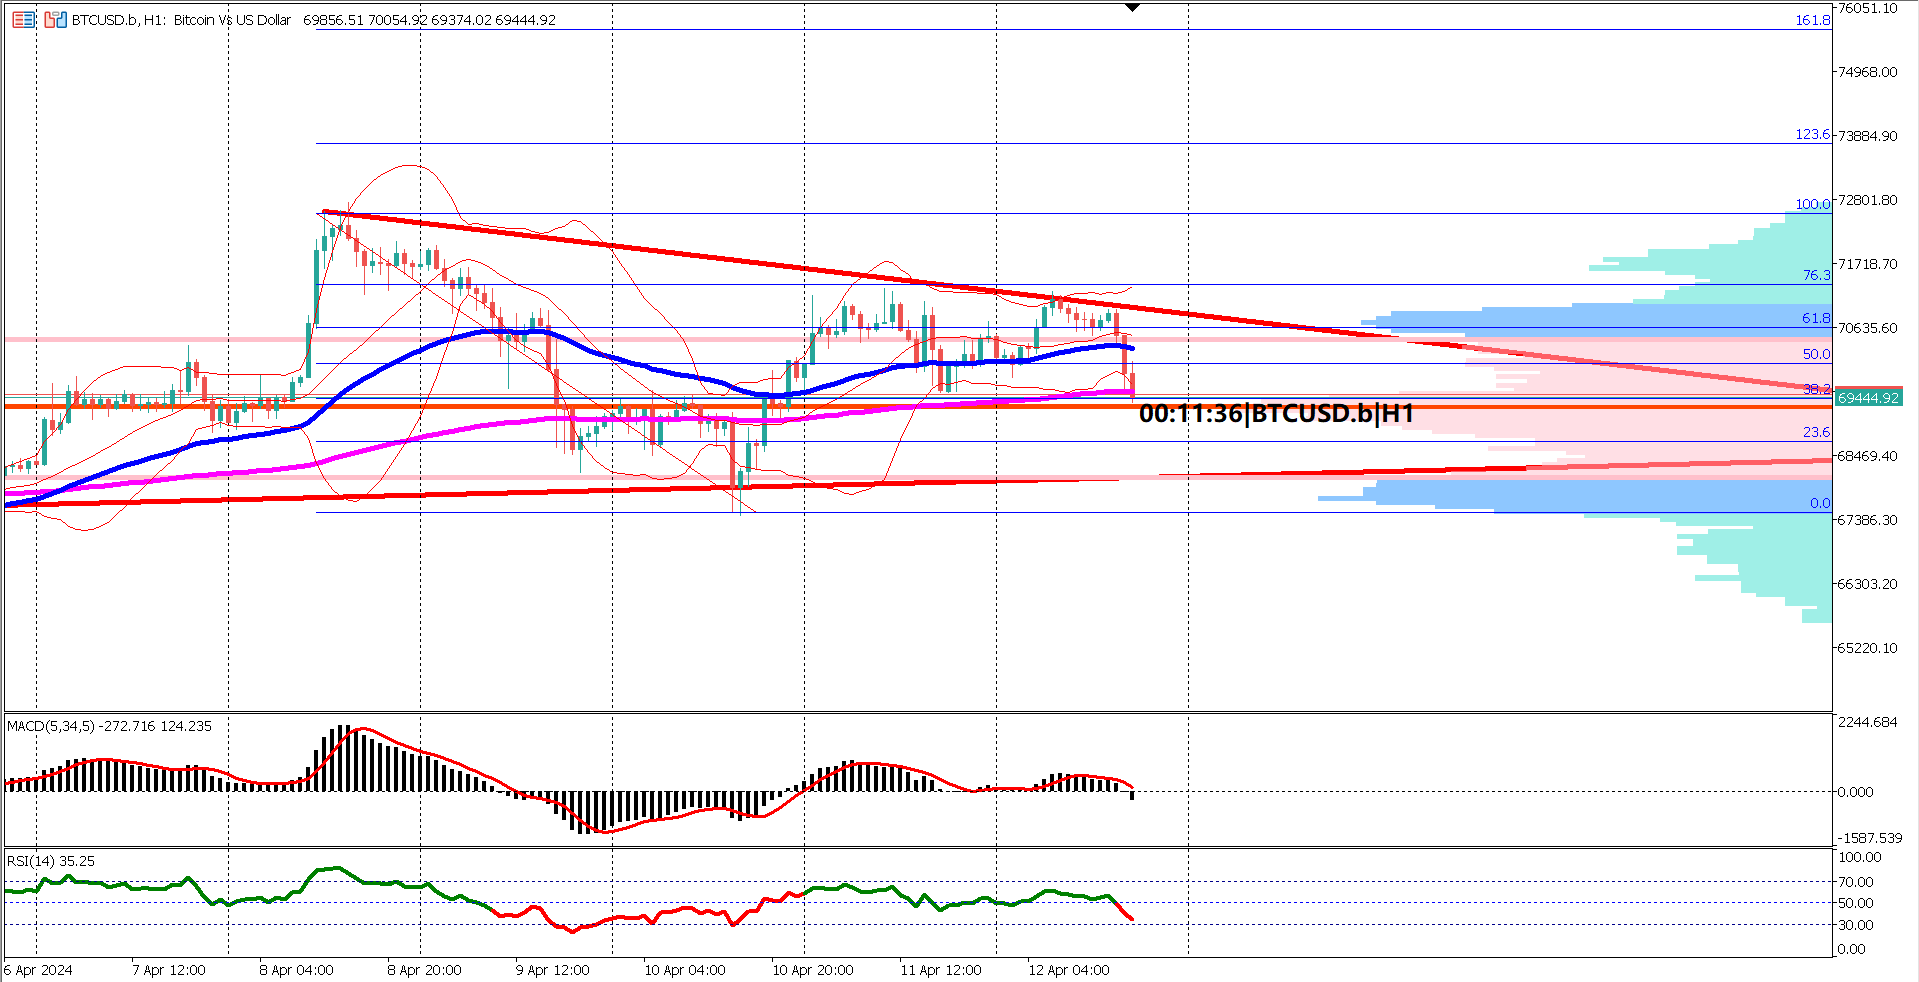

Bitcoin (BTCUSD) has been trading sideways over the last four days, hovering around the 261.8% Fibonacci extension level from last week's swing low at $61,086. This level has become a focal point for traders, as the cryptocurrency market awaits a decisive move.
The immediate key level of support for BTCUSD is found at the 200-period Exponential Moving Average (EMA) on the 1-hour chart. A break below this support could trigger a deeper retracement, potentially driving prices down to the psychological level of $60,000.
On the upside, maintaining bullish sentiment above $67,000 is crucial. The resistance at $67,390, marked by a bearish engulfing candlestick pattern that appeared yesterday, is the next hurdle. If Bitcoin can overcome this resistance, it is likely to test the significant milestone of $70,000.
The Exponential Moving Averages (EMA) on the 1-hour timeframe are currently indicating a bullish sentiment, with the EMA 50 positioned well above the EMA 200. This setup typically suggests that upward momentum could continue.
However, the Ichimoku cloud presents a mixed picture. The future cloud is very thin, indicating that the bullish momentum may be diminishing. A thin cloud often suggests that the market could experience a period of consolidation or a potential trend reversal.
This potential loss of bullish momentum is further reflected in the oscillators. Both the Moving Average Convergence Divergence (MACD) and the Relative Strength Index (RSI) have been oscillating between bullish and bearish zones over the past few days. This flip-flopping behavior indicates that the market lacks a clear trend, despite the bullish signals from the EMAs.
Overall, BTCUSD is currently trending sideways, with no clear directional trend. The market appears to be in a state of indecision, as reflected by the mixed signals from various technical indicators.
A deep retracement is likely if Bitcoin fails to break above the key resistance level at $67,390. Conversely, a breakout above this level could reinvigorate the bullish momentum and drive prices towards the $70,000 mark.
Traders should keep a close eye on the critical support at the EMA 200 and the resistance at $67,390. The next significant move will likely depend on how Bitcoin reacts to these levels. A clear break above or below these key levels will provide a more definitive direction for BTCUSD in the short to medium term.
Actual -2.4% vs Forecast 0.1% vs Previous 1.5%

Trading foreign exchange on margin carries a high level of risk, and may not be suitable for all investors. Before deciding to trade foreign exchange you should carefully consider your investment objectives, level of experience, and risk appetite.
Nothing contained in this website should be construed as investment advice. Any reference to an investment's past or potential performance is not, and should not be construed as, a recommendation or as a guarantee of any specific outcome or profit.