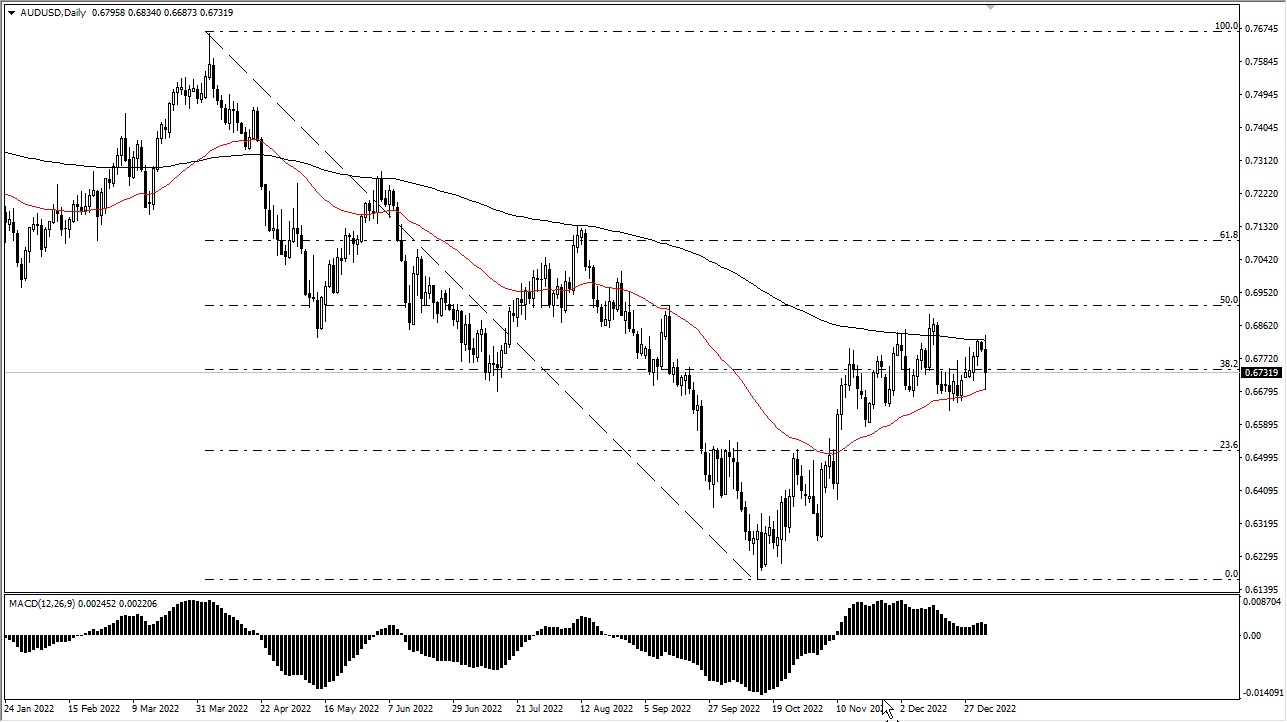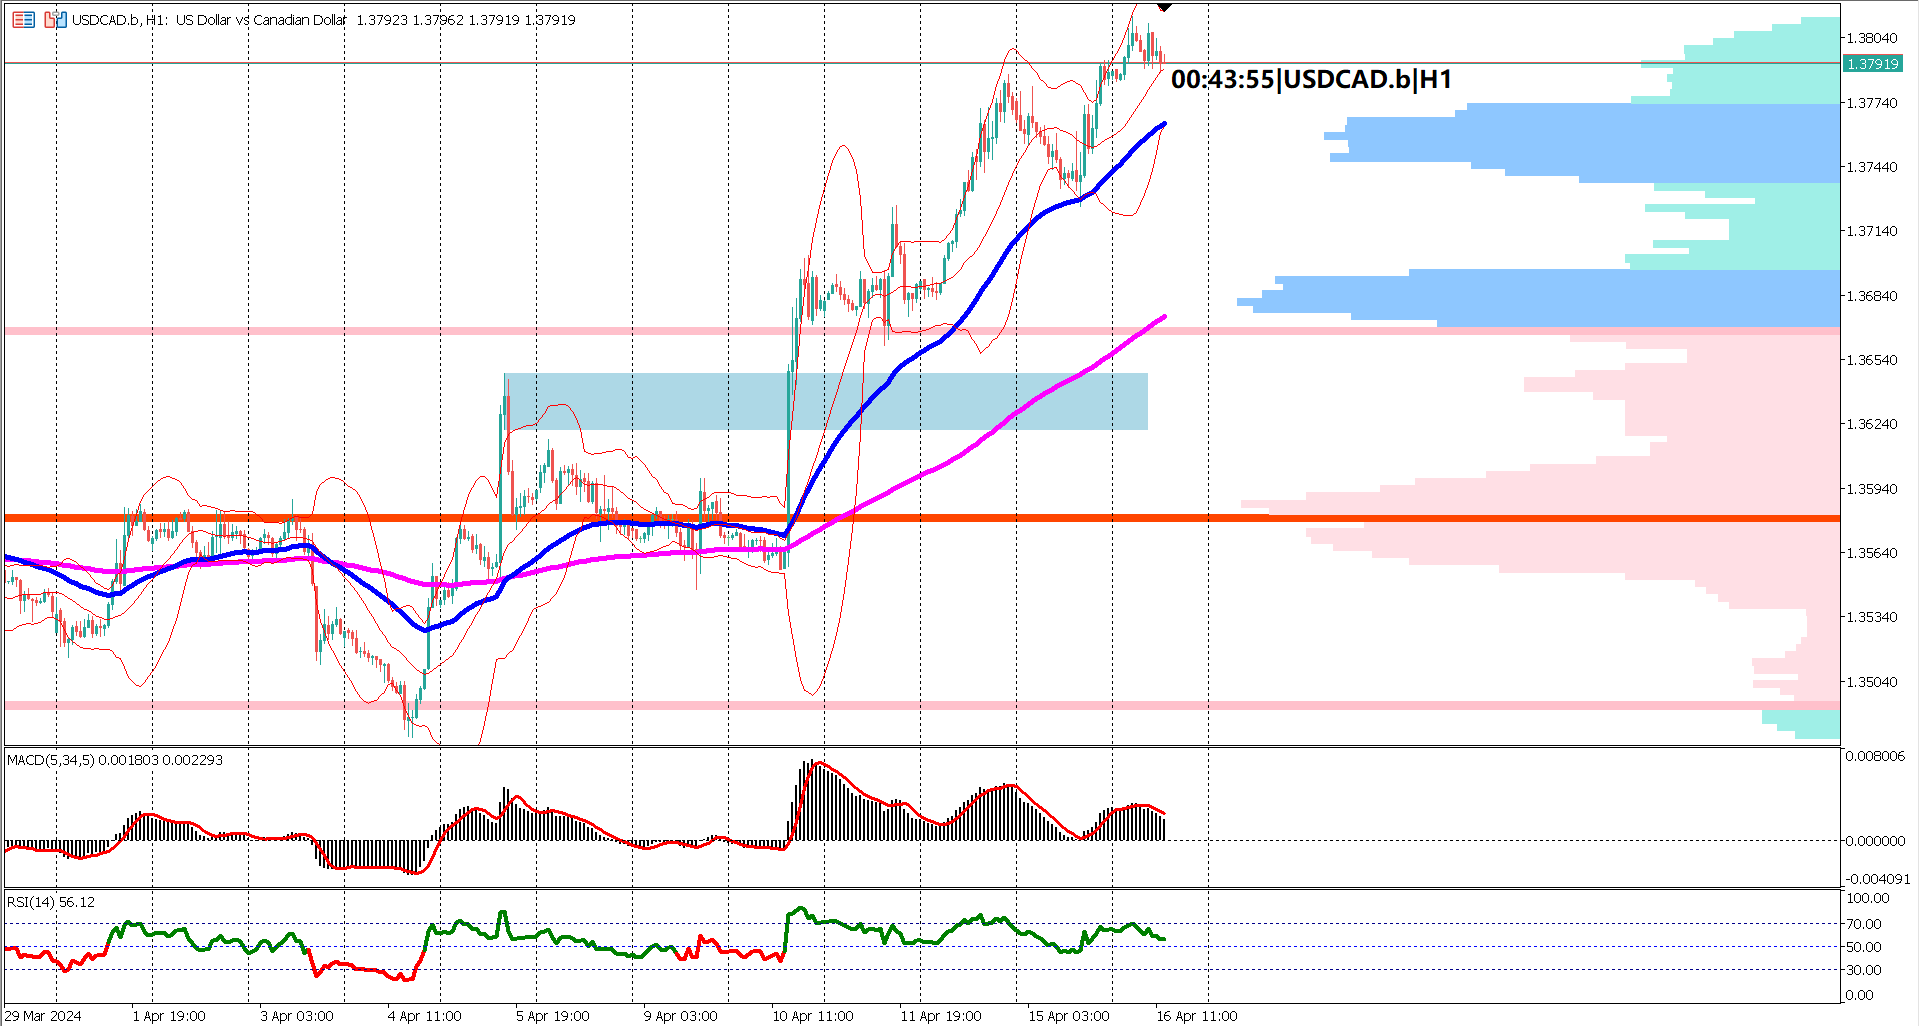

What next for USDCAD? It looks like USDCAD recently met support at 1.2016. The price stopped falling and hovered around 1.2105, making two waves in the process. Last period, the downward trend lasted almost 21 days, during these 21 days, the price stayed within the Bollinger Bands and barely fluctuated. And now, the stable downward trend seems to lose steam. The Fibonacci retracement level shows that the second wave of the price almost touched the 23.6% level. Is this time for USDCAD to go up?
.png?width=4920&name=Graph%20Template%20(19).png)
First, the previous downward trend was stable, so it is not easy to turn it around. We cannot deny the support here, however, it is not enough. We can see the price stopped at the 23.6% Fibonacci level and turns down again. Also looking at the Ichimoku indicator you can find that it already started to go up. MACD just made a death cross, and we can consider this fairly important. Next, Stochastics and RSI turn down abruptly, as can be seen, at a big angle. Now, most as you can see the signals are bearish. Is it possible that the price is already back in the downward trend?
We love to hear new ideas from traders and want to know what you think!
If you like this topic and want to suggest future topics that you find helpful, let us know by clicking the ‘submit your feedback’ button below.

Trading foreign exchange on margin carries a high level of risk, and may not be suitable for all investors. Before deciding to trade foreign exchange you should carefully consider your investment objectives, level of experience, and risk appetite.
Nothing contained in this website should be construed as investment advice. Any reference to an investment's past or potential performance is not, and should not be construed as, a recommendation or as a guarantee of any specific outcome or profit.