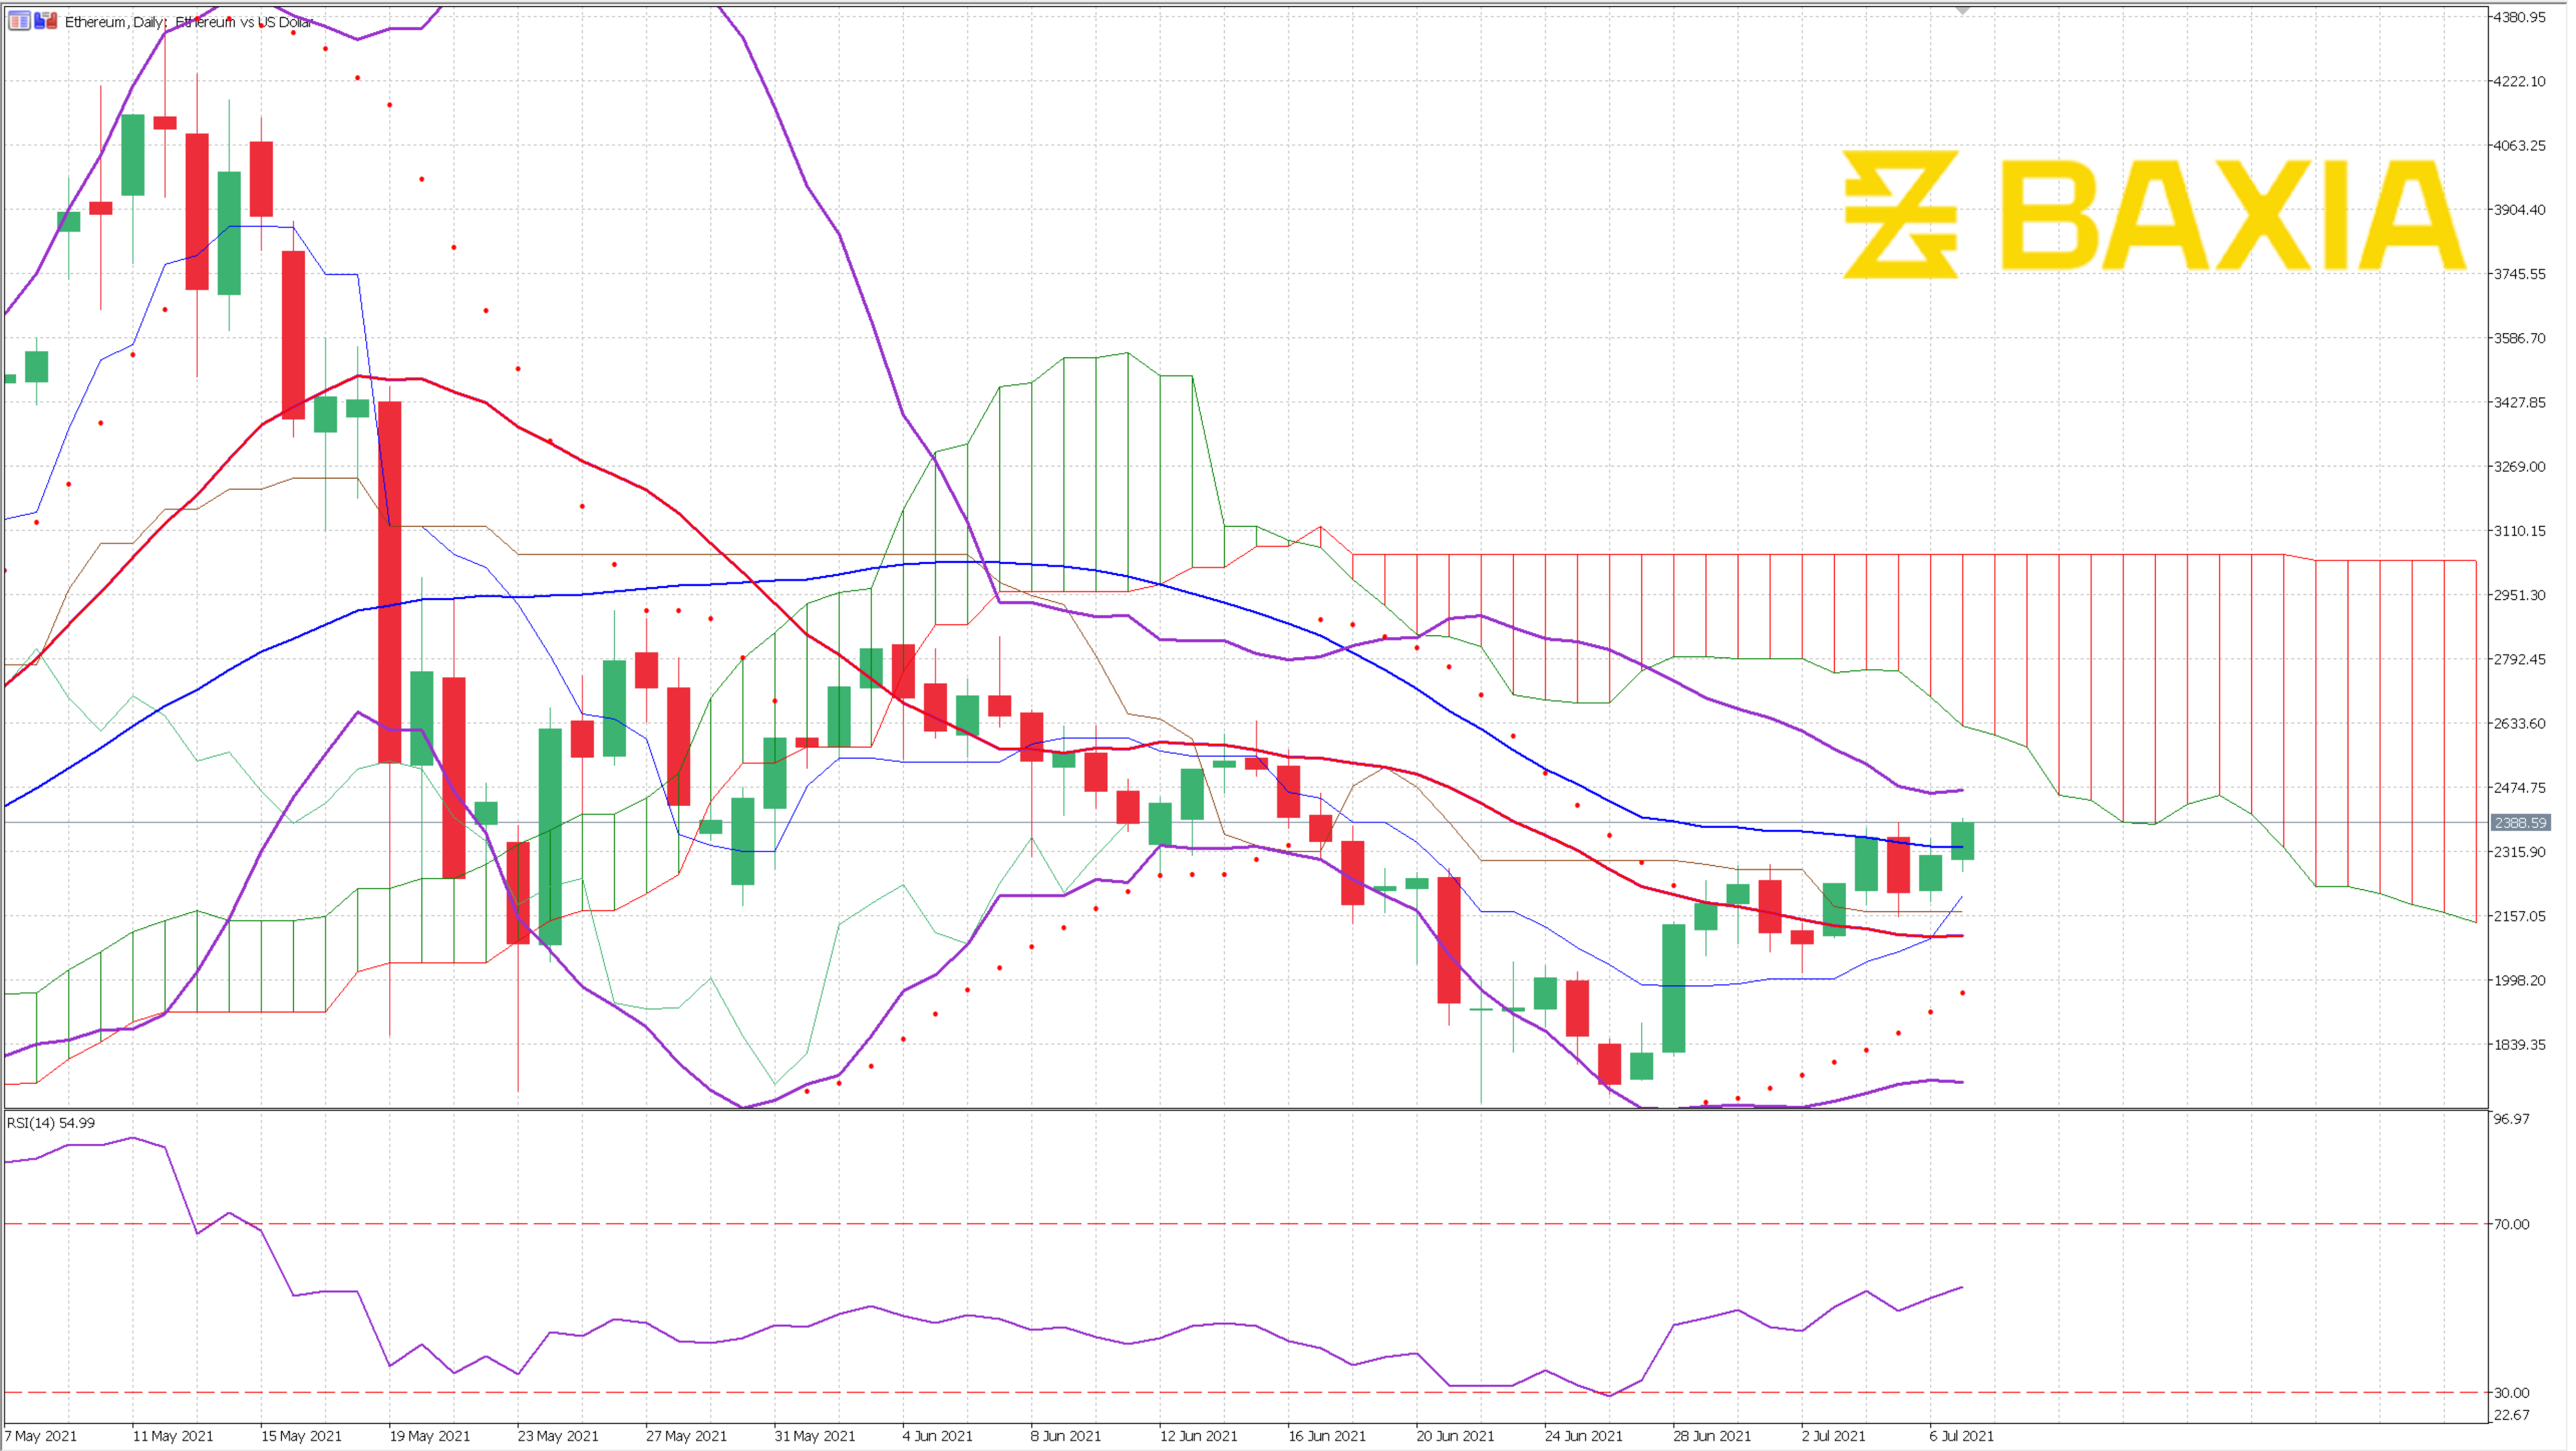
 The cryptocurrency had a seven-day winning streak that might come to an end after not consolidating the breakout at $2,345, which is at the 23.6% Fibonacci retracement.
The Bollinger bands are opening up at the edge, but the crypto trades very close to the upper band, suggesting that the price is relatively high.
The price trades inside the Ichimoku cloud, and this is interpreted as market uncertainty. The cloud indicates that a downtrend can be expected in the short term.
The relative strength index is at 58%, allowing the pair to continue its uptrend; we would have to wait and see if the resistance breakout can be completed.
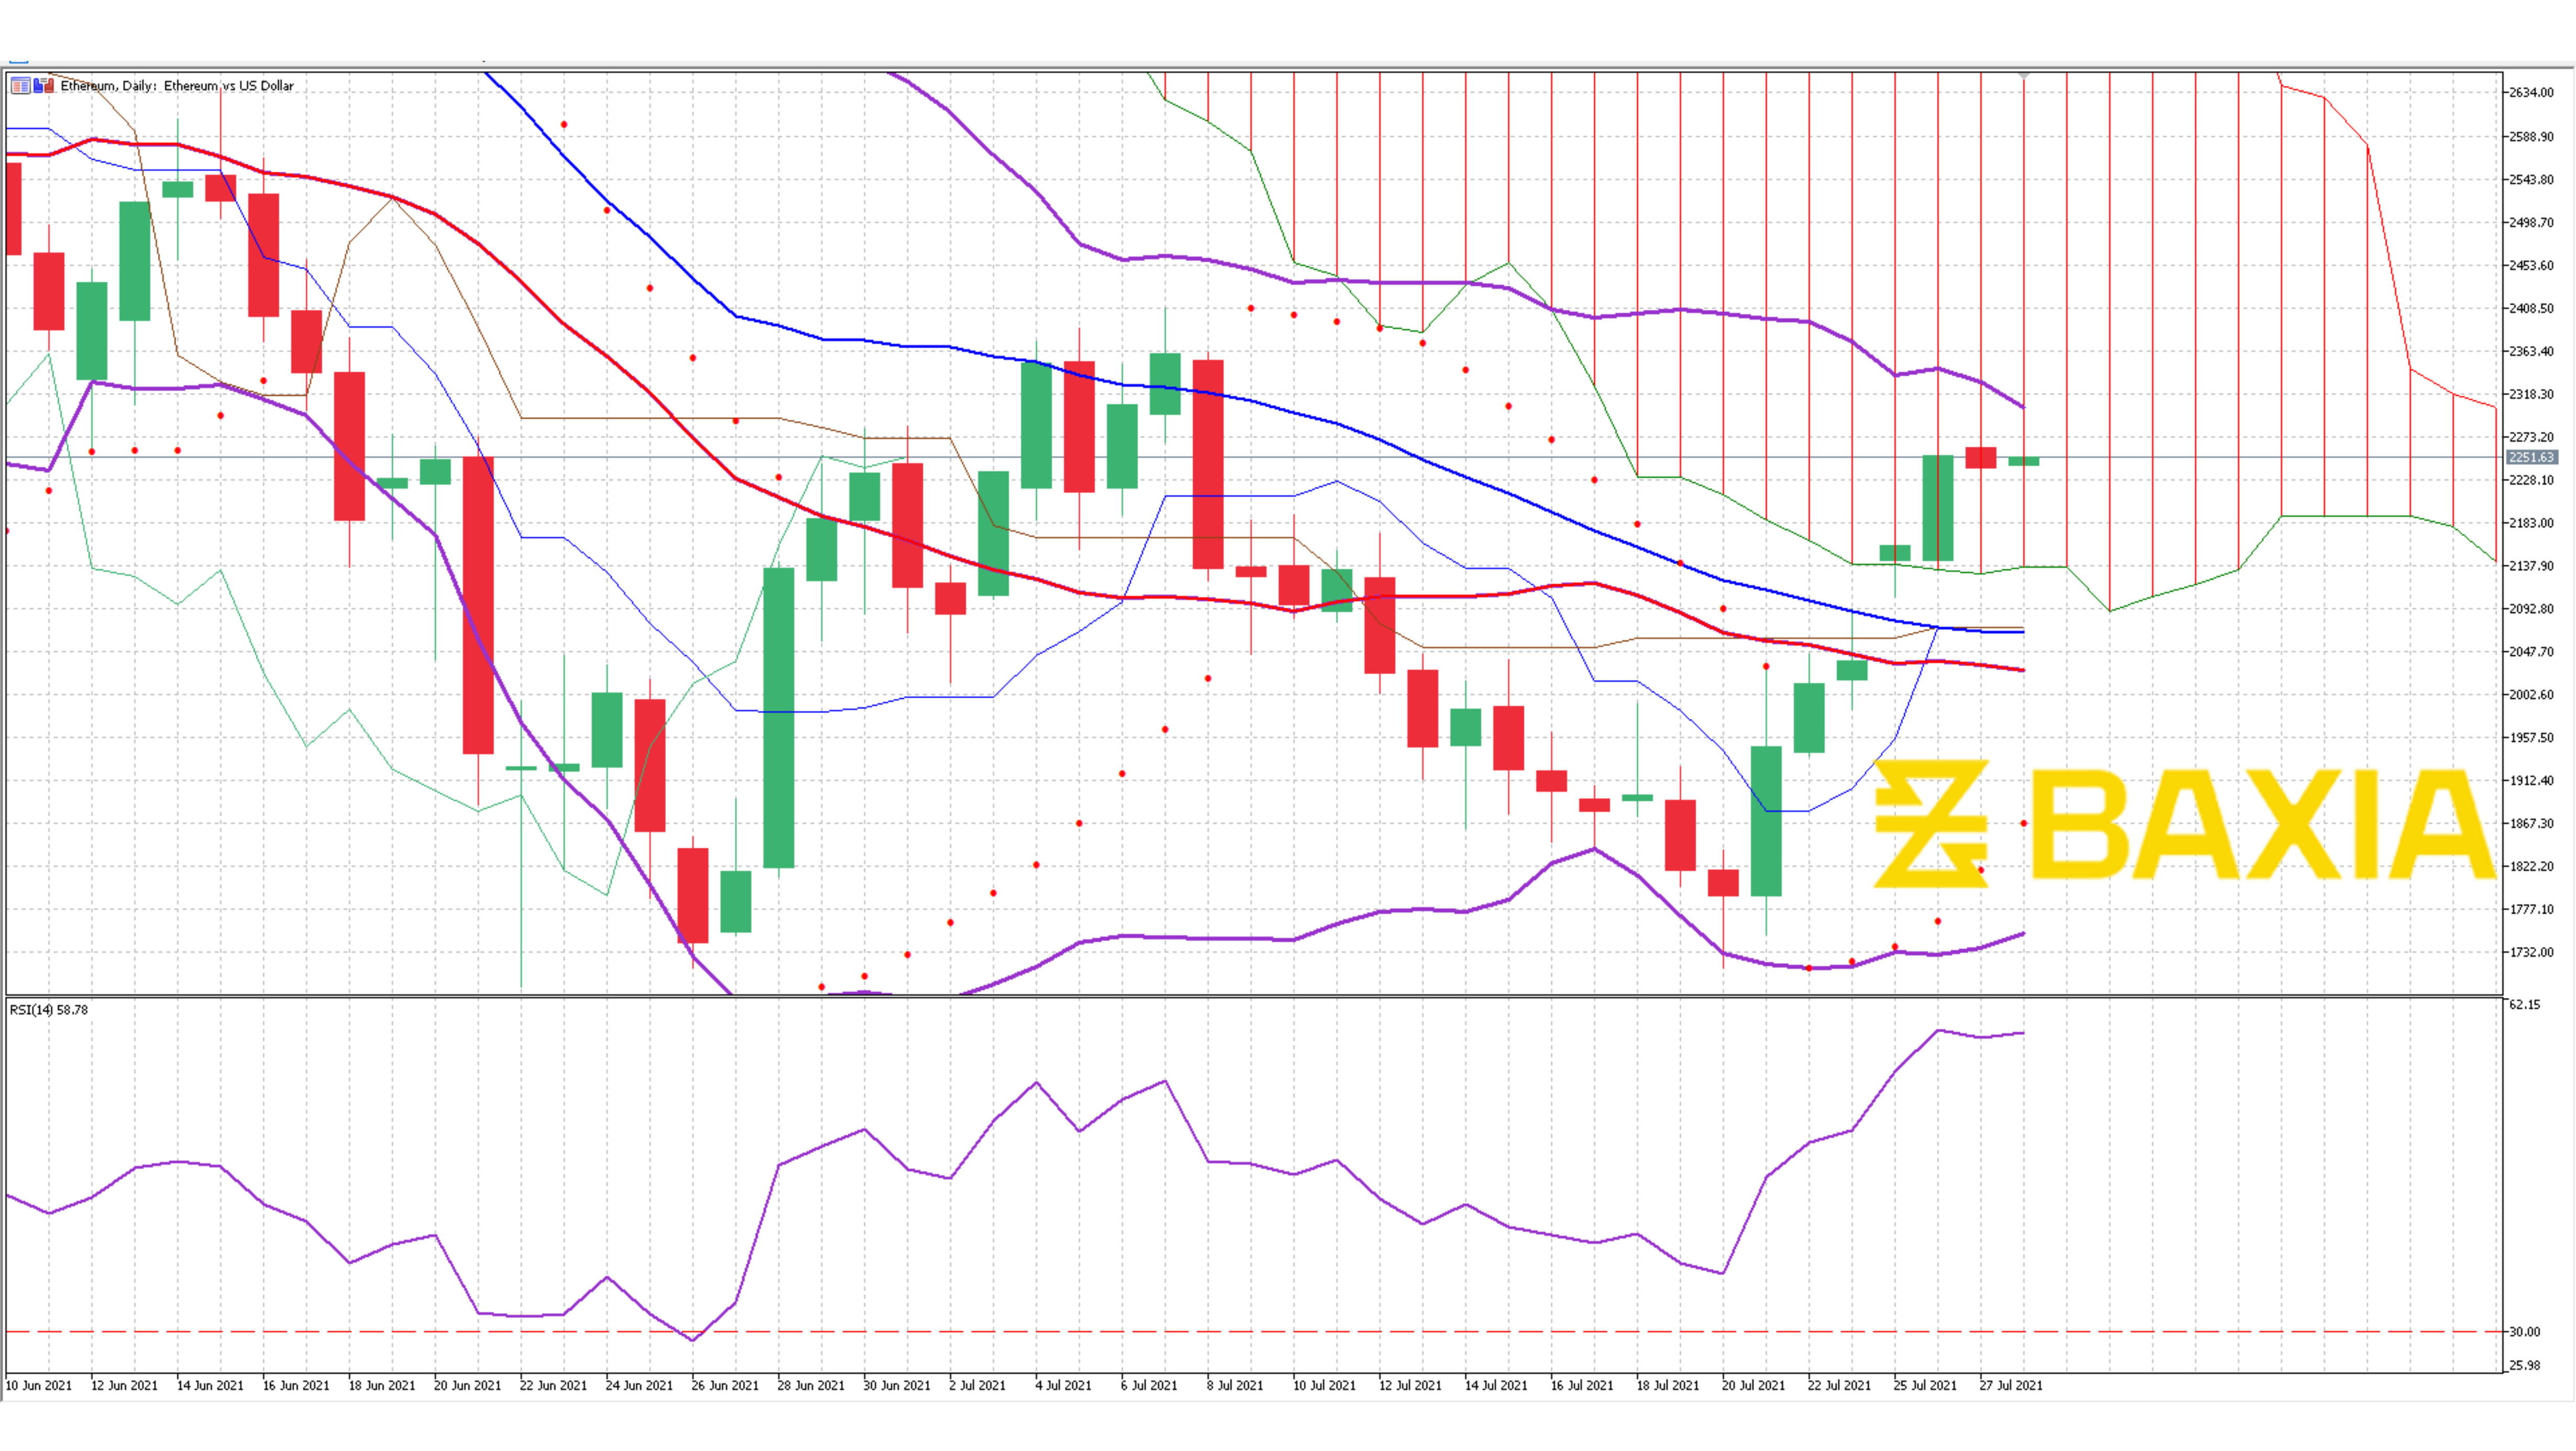
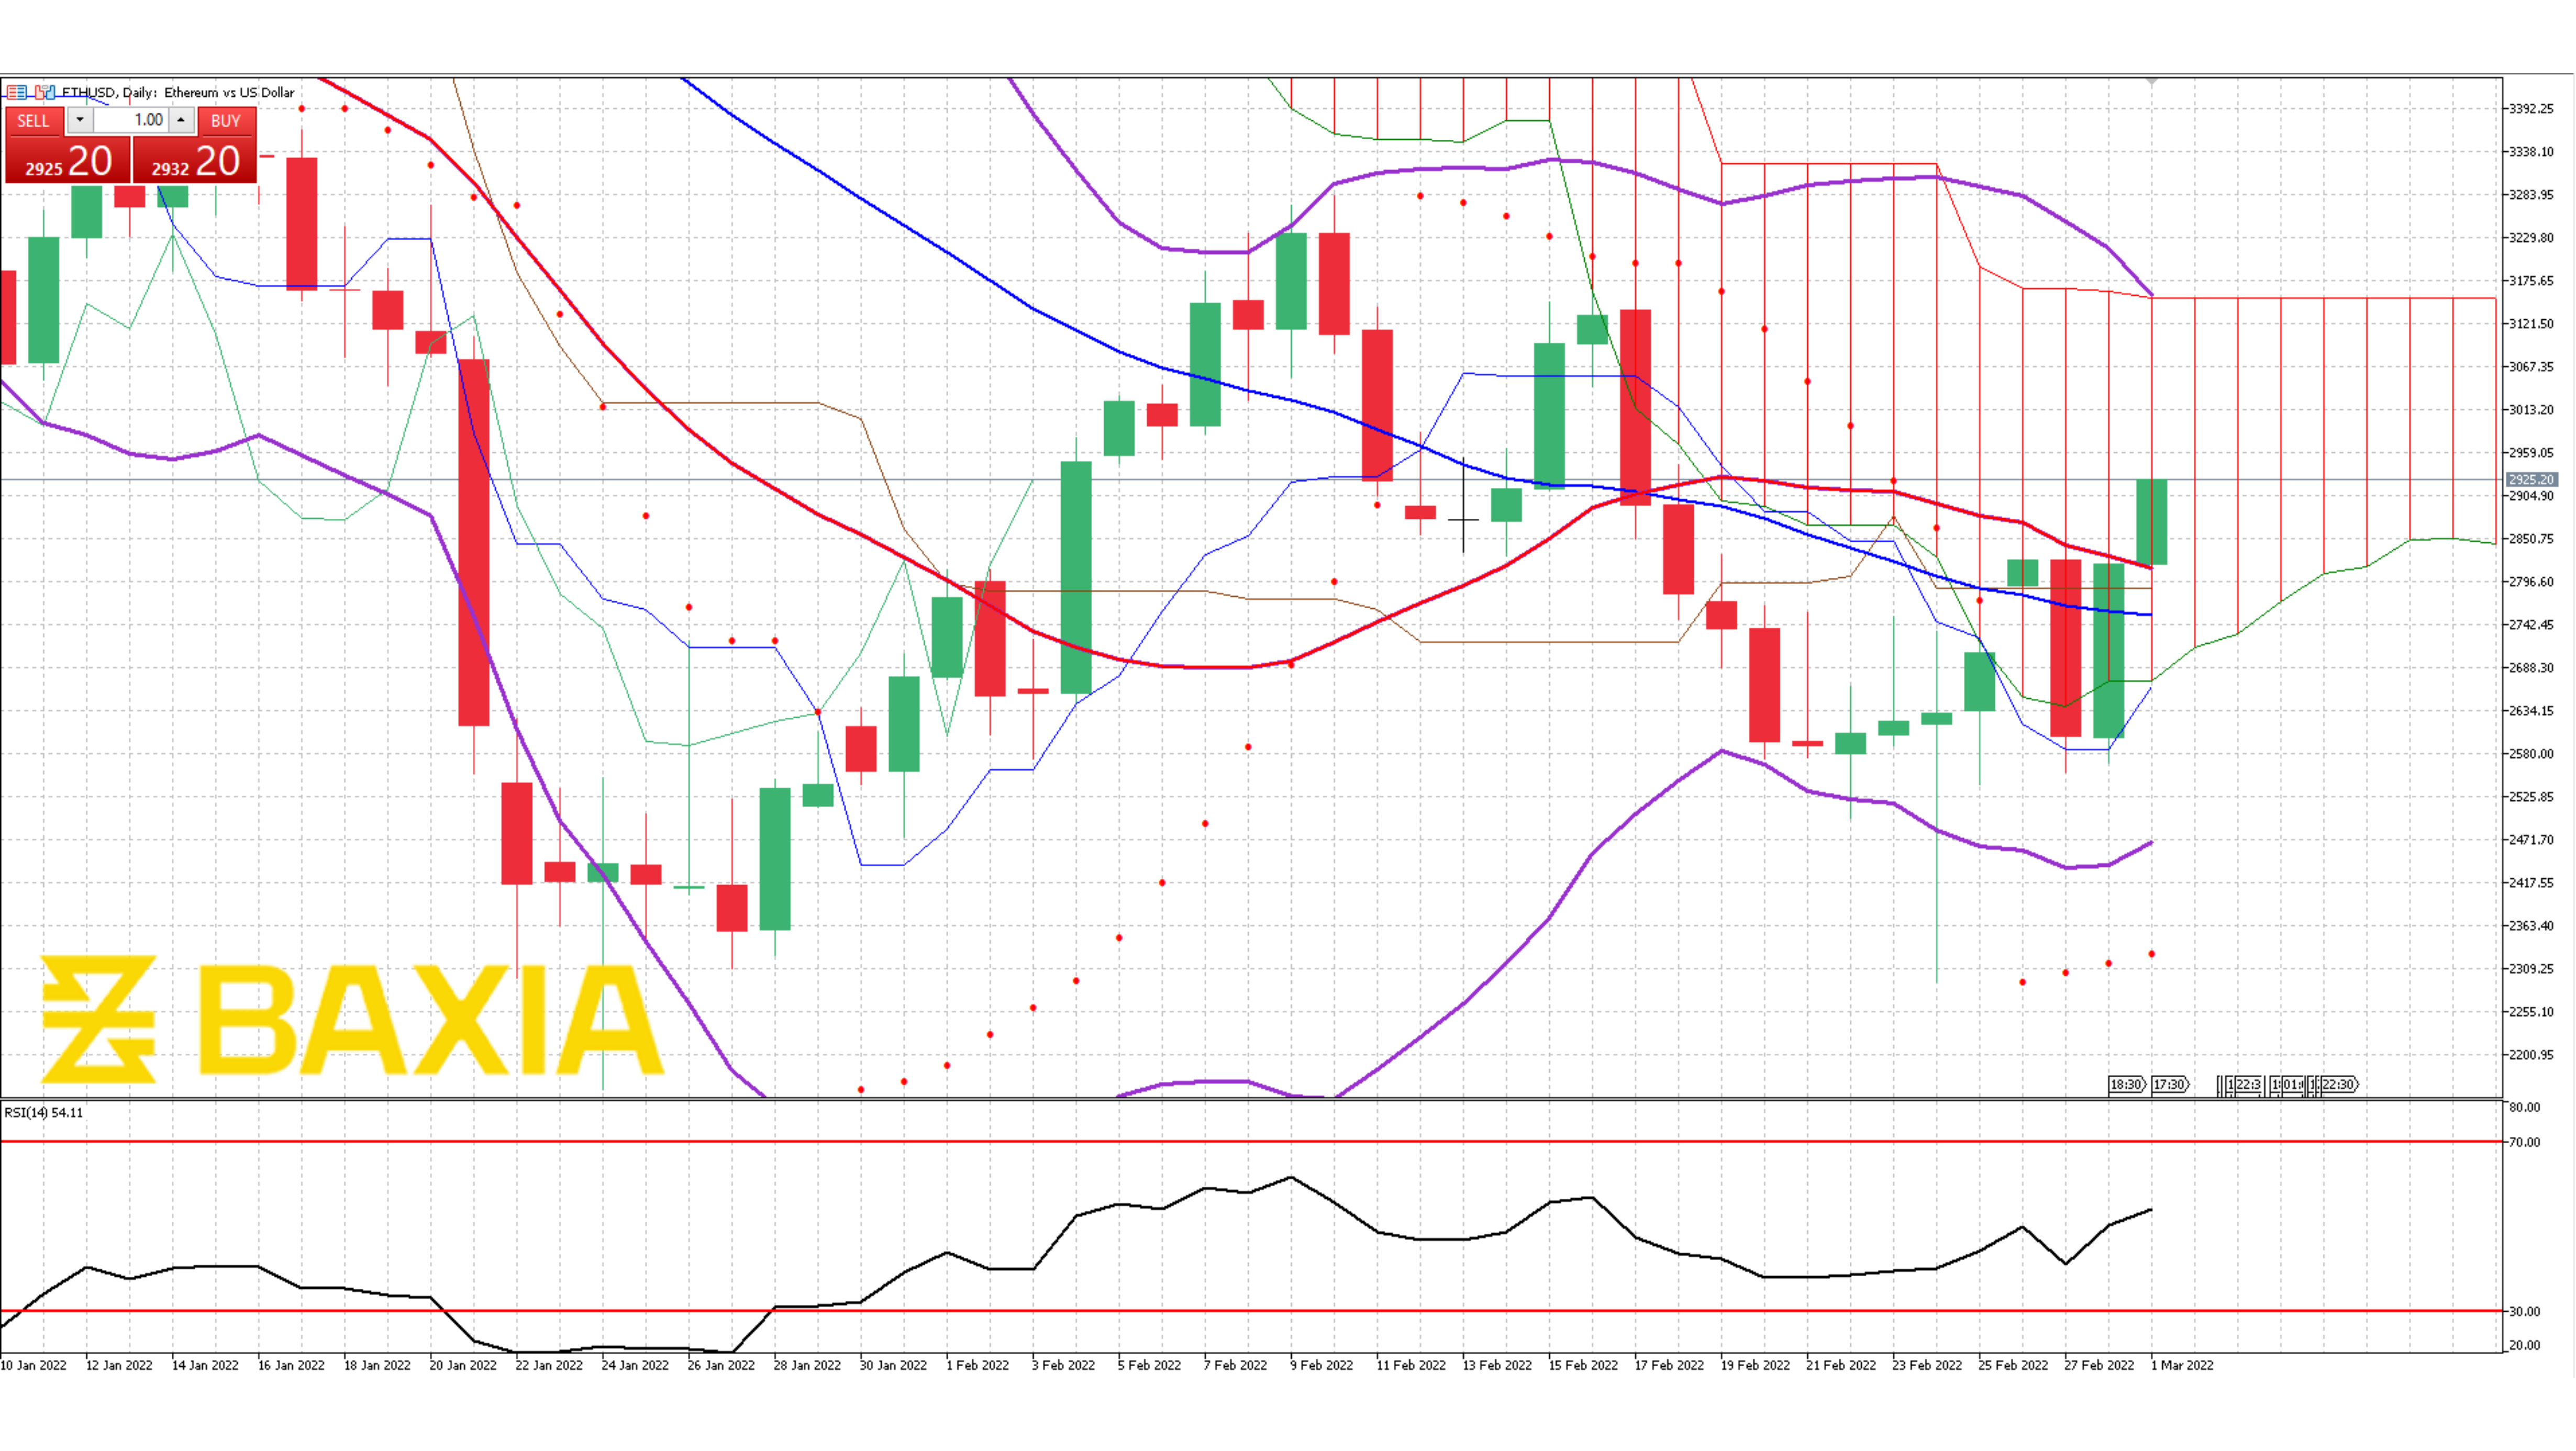
Our parabolic SAR indicator suggests that the price will continue to go up, and since the RSI is not close to being overbought, the price might keep moving up.
The short and long-term moving averages are very close to a crossing; if this happens, there could be a trend reversal in the short term, and we could see the price in the $2,500 very soon.
We love to hear new ideas from traders and want to know what you think!
If you like this topic and want to suggest future topics that you find helpful, let us know by clicking the ‘submit your feedback’ button below.

Trading foreign exchange on margin carries a high level of risk, and may not be suitable for all investors. Before deciding to trade foreign exchange you should carefully consider your investment objectives, level of experience, and risk appetite.
Nothing contained in this website should be construed as investment advice. Any reference to an investment's past or potential performance is not, and should not be construed as, a recommendation or as a guarantee of any specific outcome or profit.