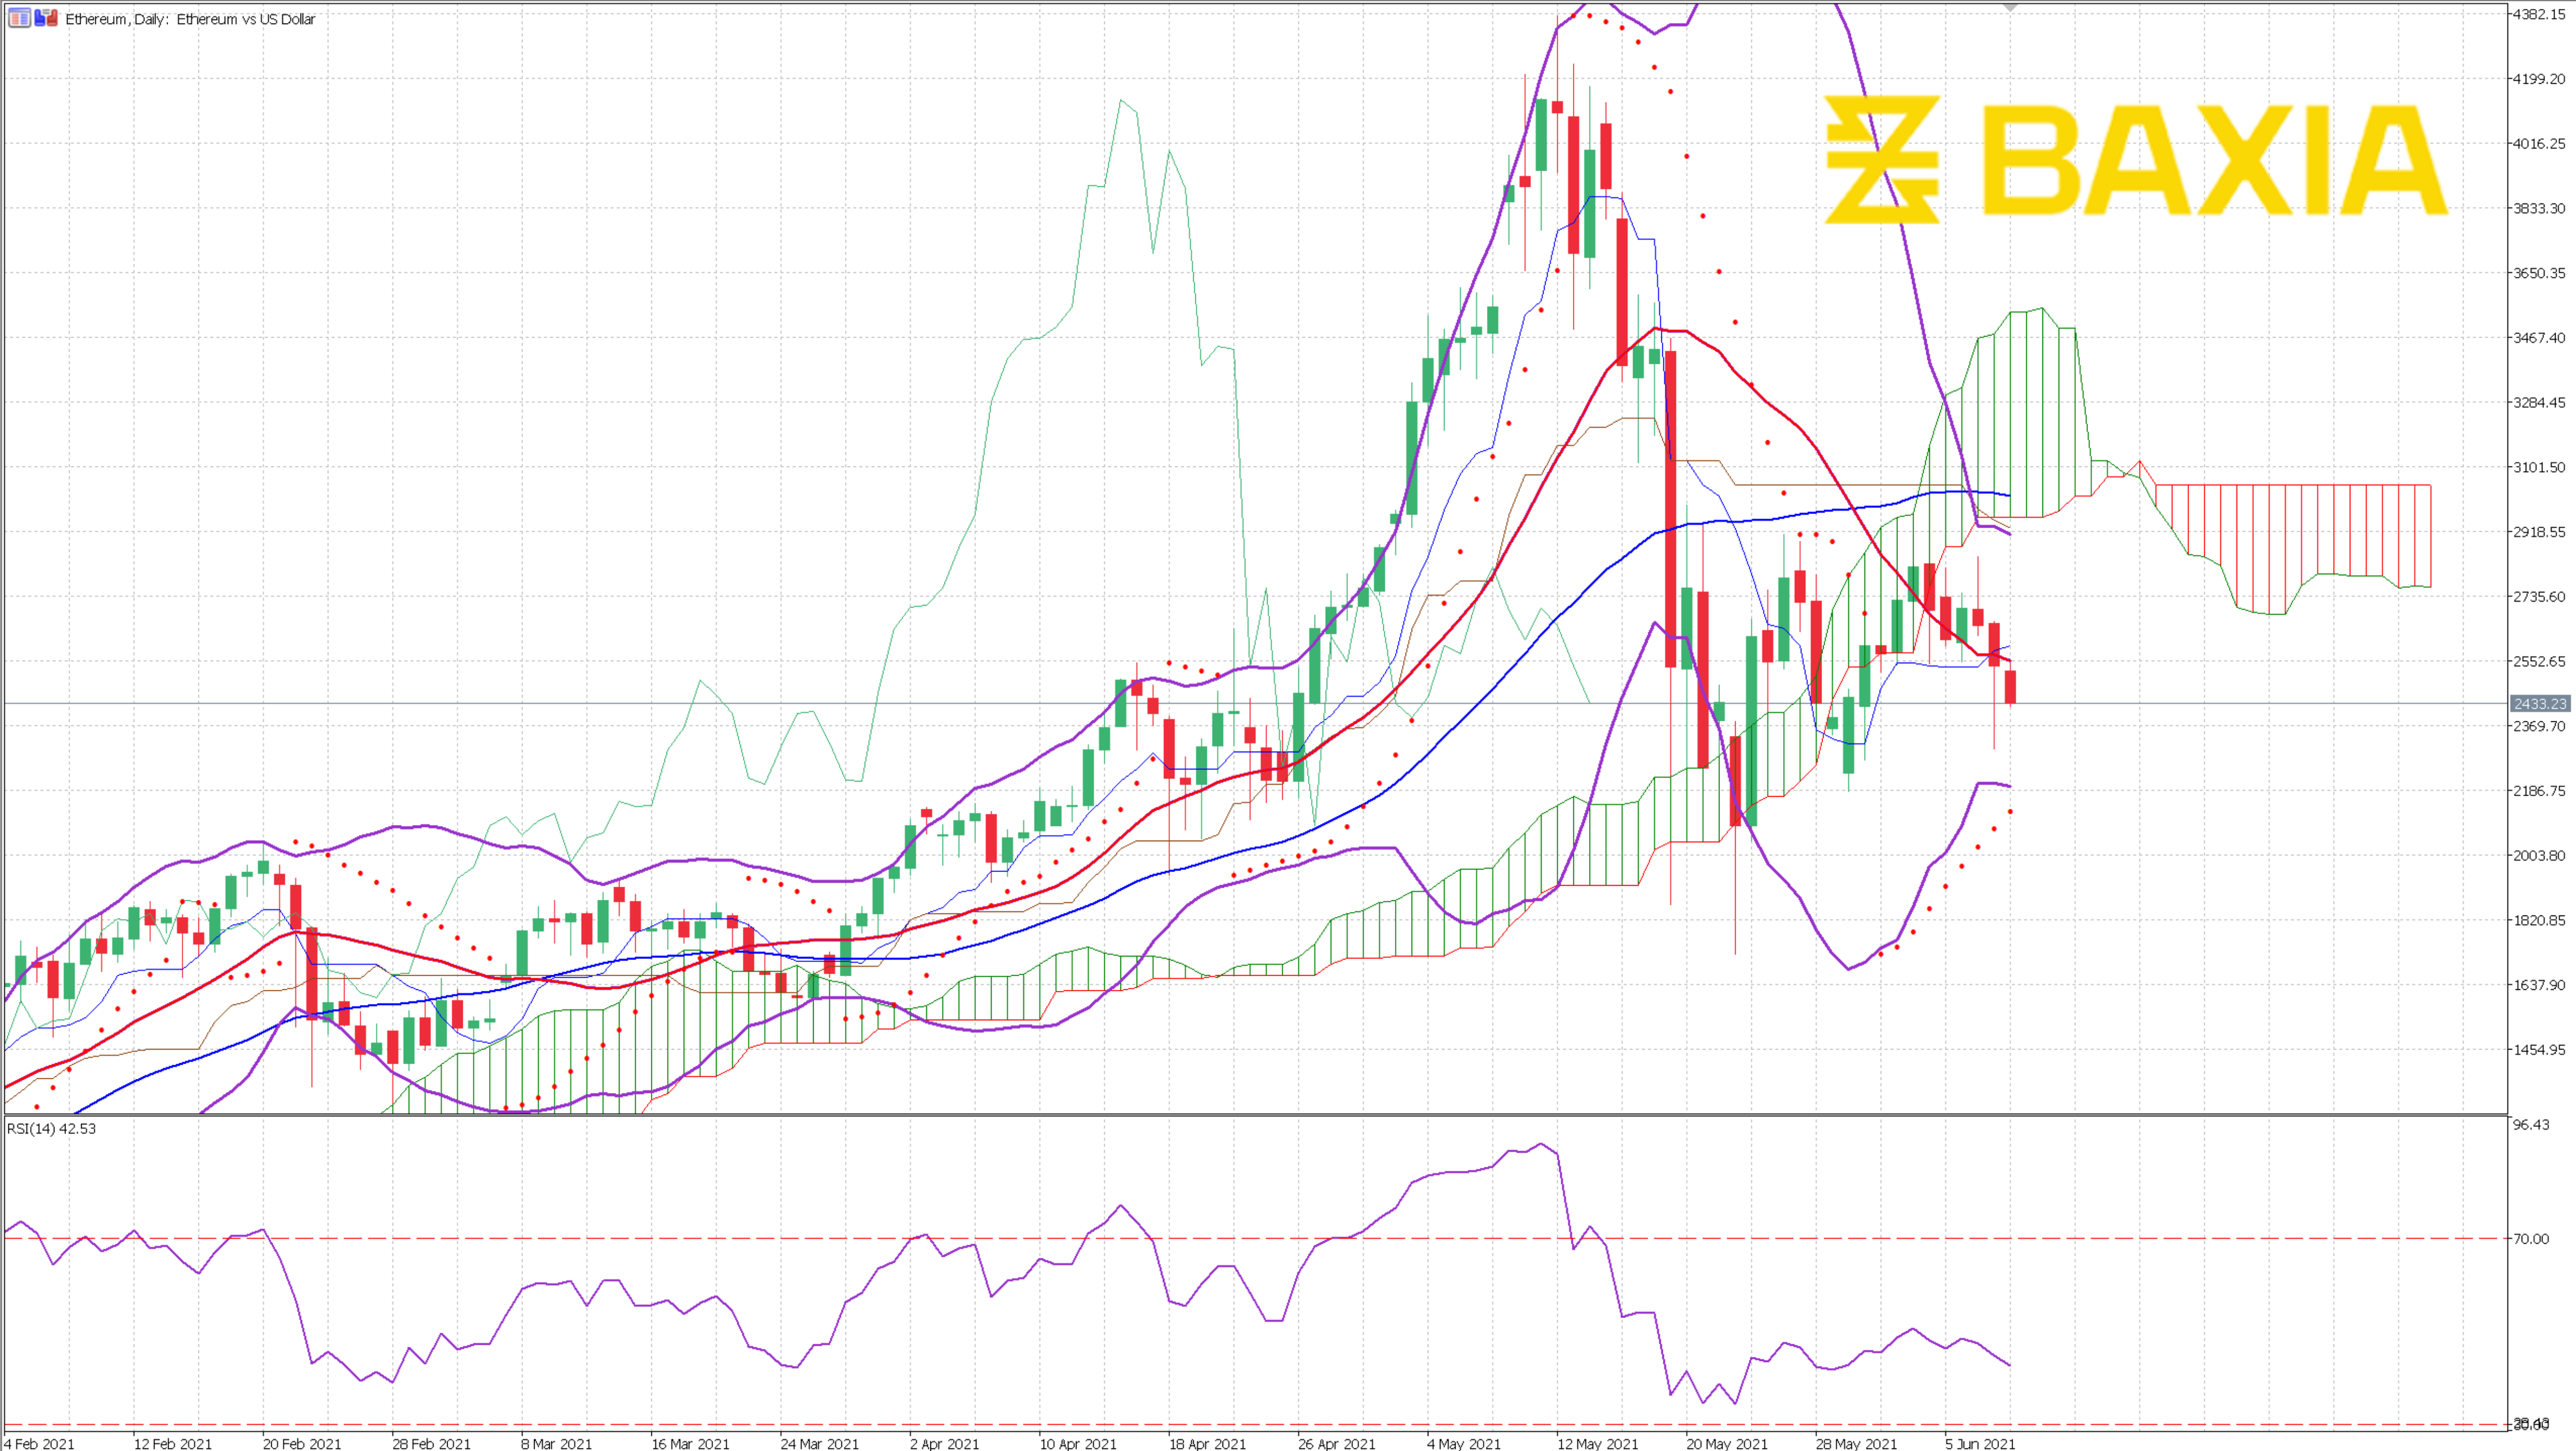

The cryptocurrency has been performing very well during the last seven trading sessions; it has managed to recover 29.33%; it broke two significant resistance levels at $3,340.32 and $3,356.44, which are at our 50% and 61.8% Fibonacci retracements.
The Bollinger bands are steady, and this could indicate a consolidation period. The bands have been very steady during the last nine trading sessions; the price trades closer to the upper band, suggesting it's relatively high. If the upper band does not start to open soon, we could expect a price drop in the short term, perhaps to the $3,356 levels, which is now a support area.
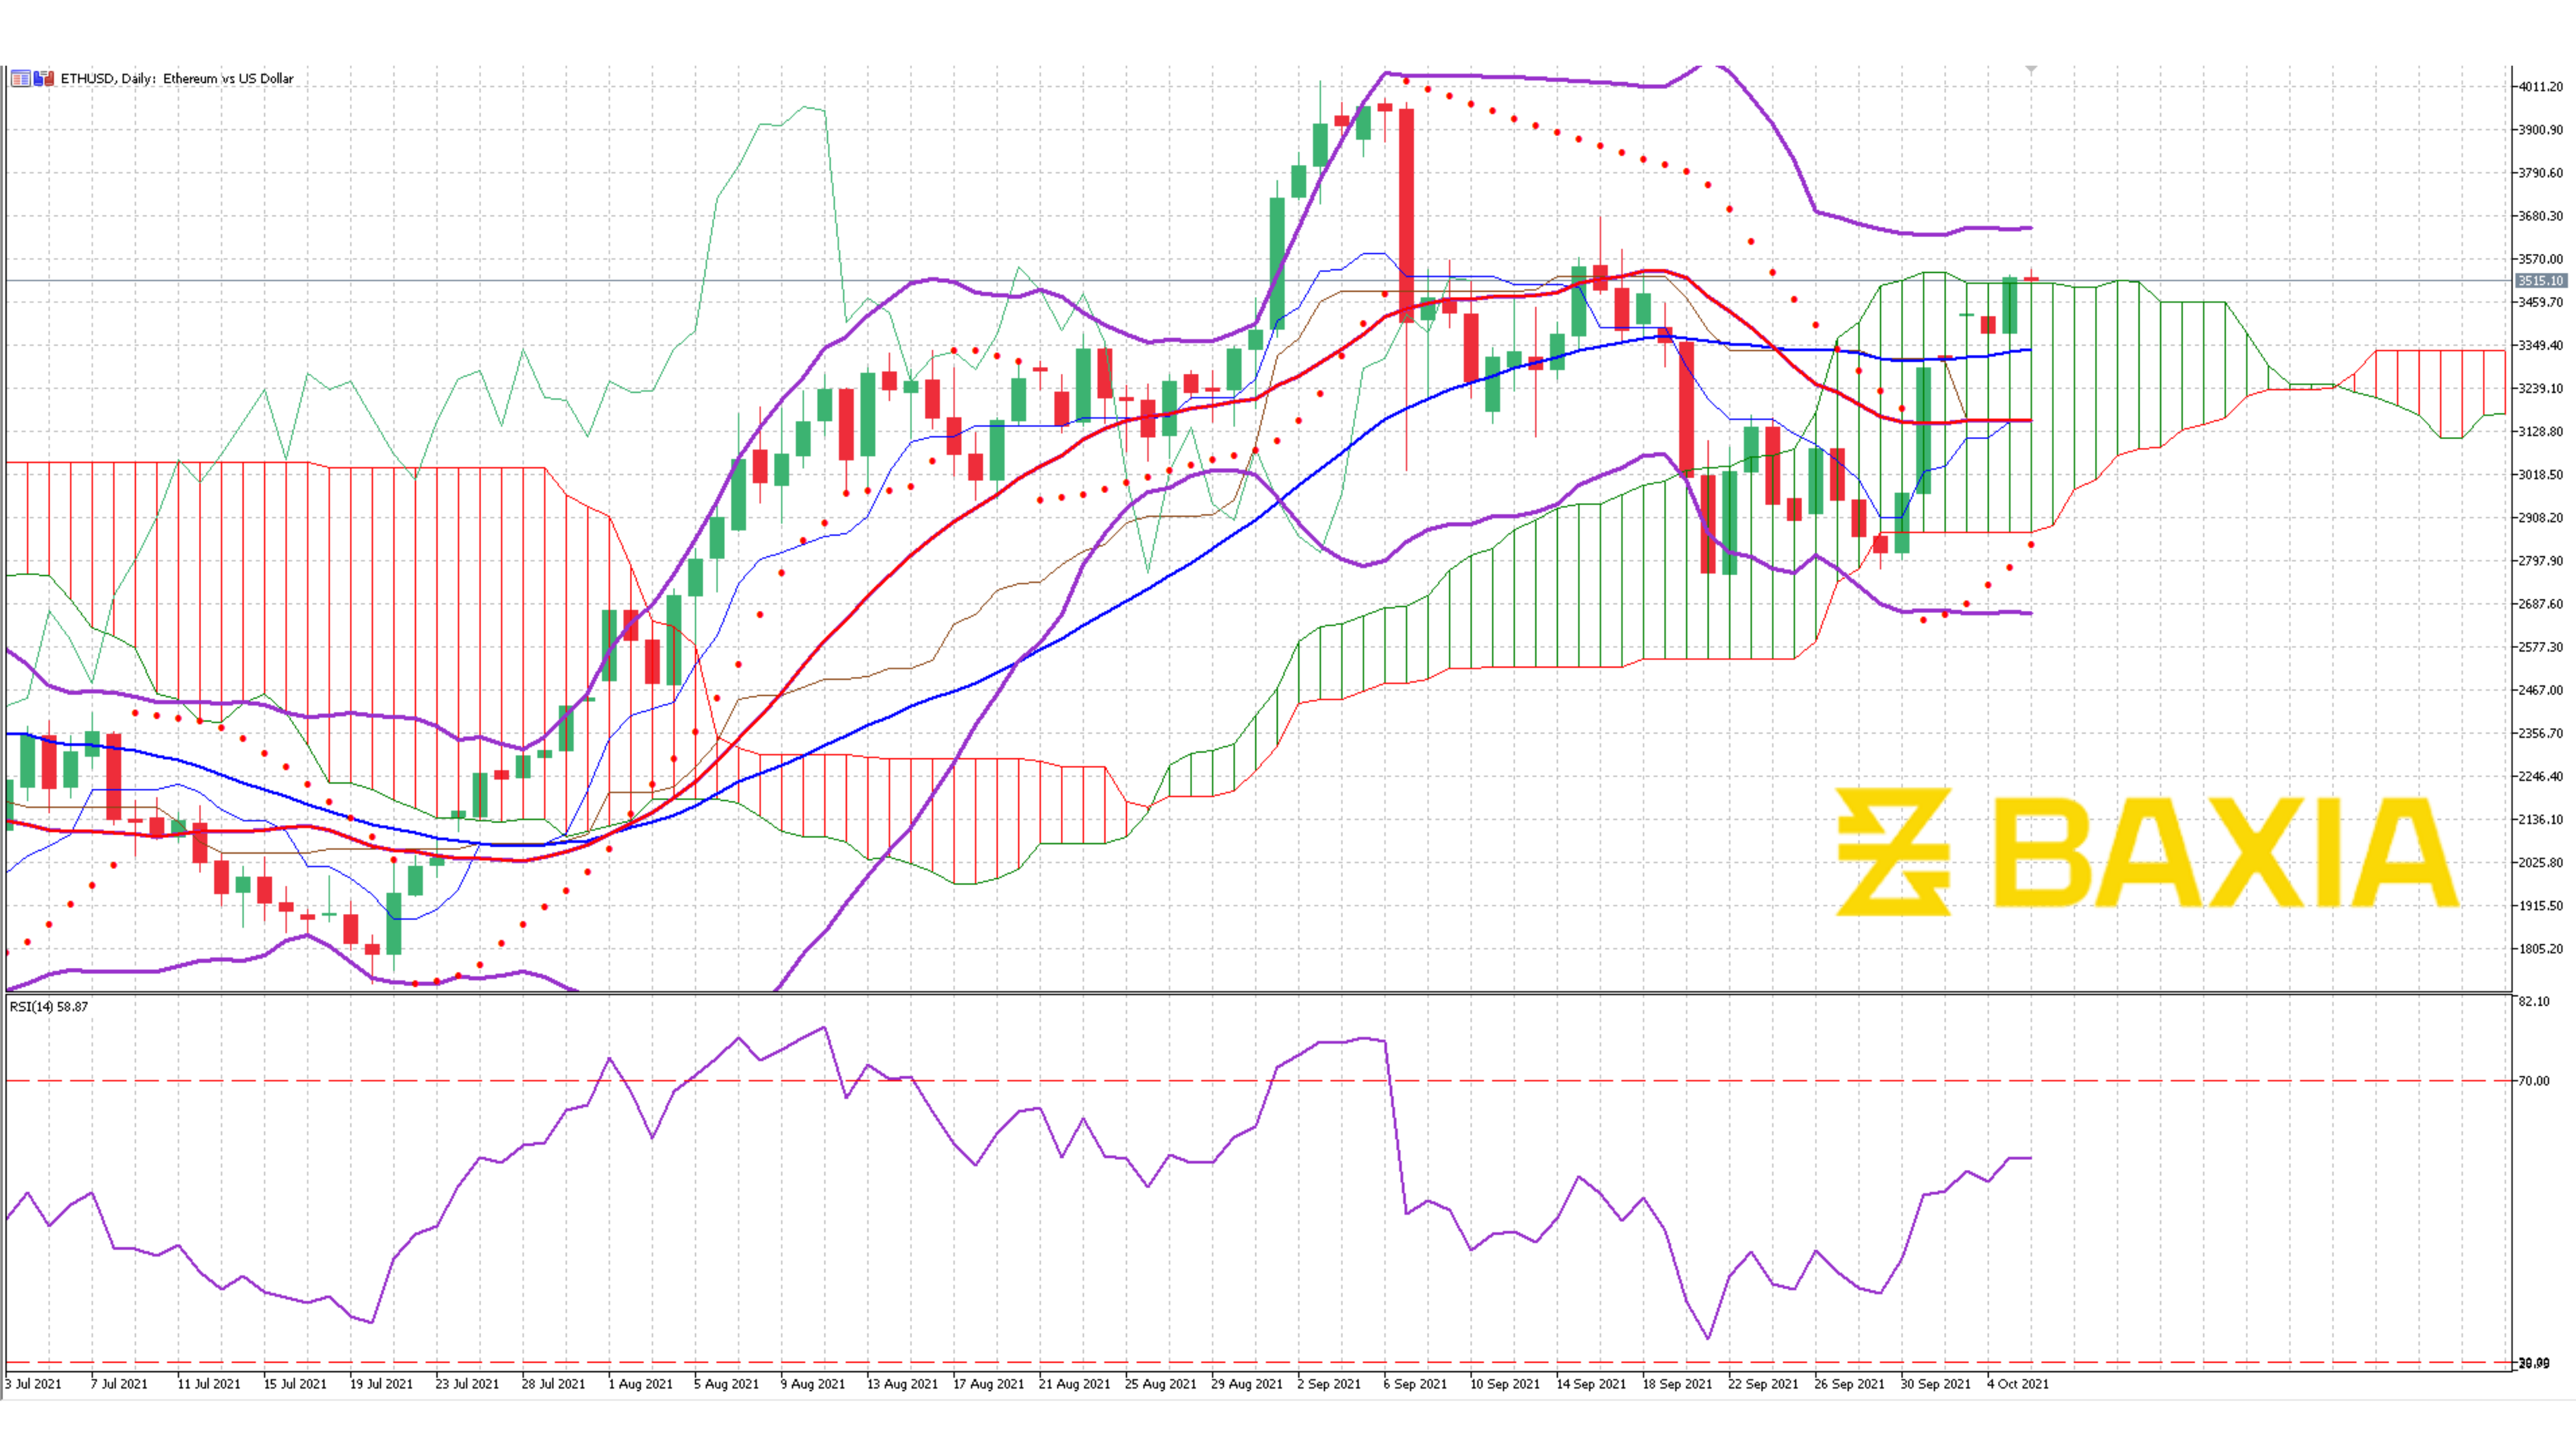
The relative strength index is at 60.28%, which will allow the price to continue moving up before entering an overbought status; however, once it gets closer to that 70%, we could see a temporary retracement.
Our parabolic SAR indicator suggests that the price will continue to move upwards, and we have no reason to believe it won't, but how long will this uptrend last before we have a pullback?
We love to hear new ideas from traders and want to know what you think!
If you like this topic and want to suggest future topics that you find helpful, let us know by clicking the ‘submit your feedback’ button below.

Trading foreign exchange on margin carries a high level of risk, and may not be suitable for all investors. Before deciding to trade foreign exchange you should carefully consider your investment objectives, level of experience, and risk appetite.
Nothing contained in this website should be construed as investment advice. Any reference to an investment's past or potential performance is not, and should not be construed as, a recommendation or as a guarantee of any specific outcome or profit.