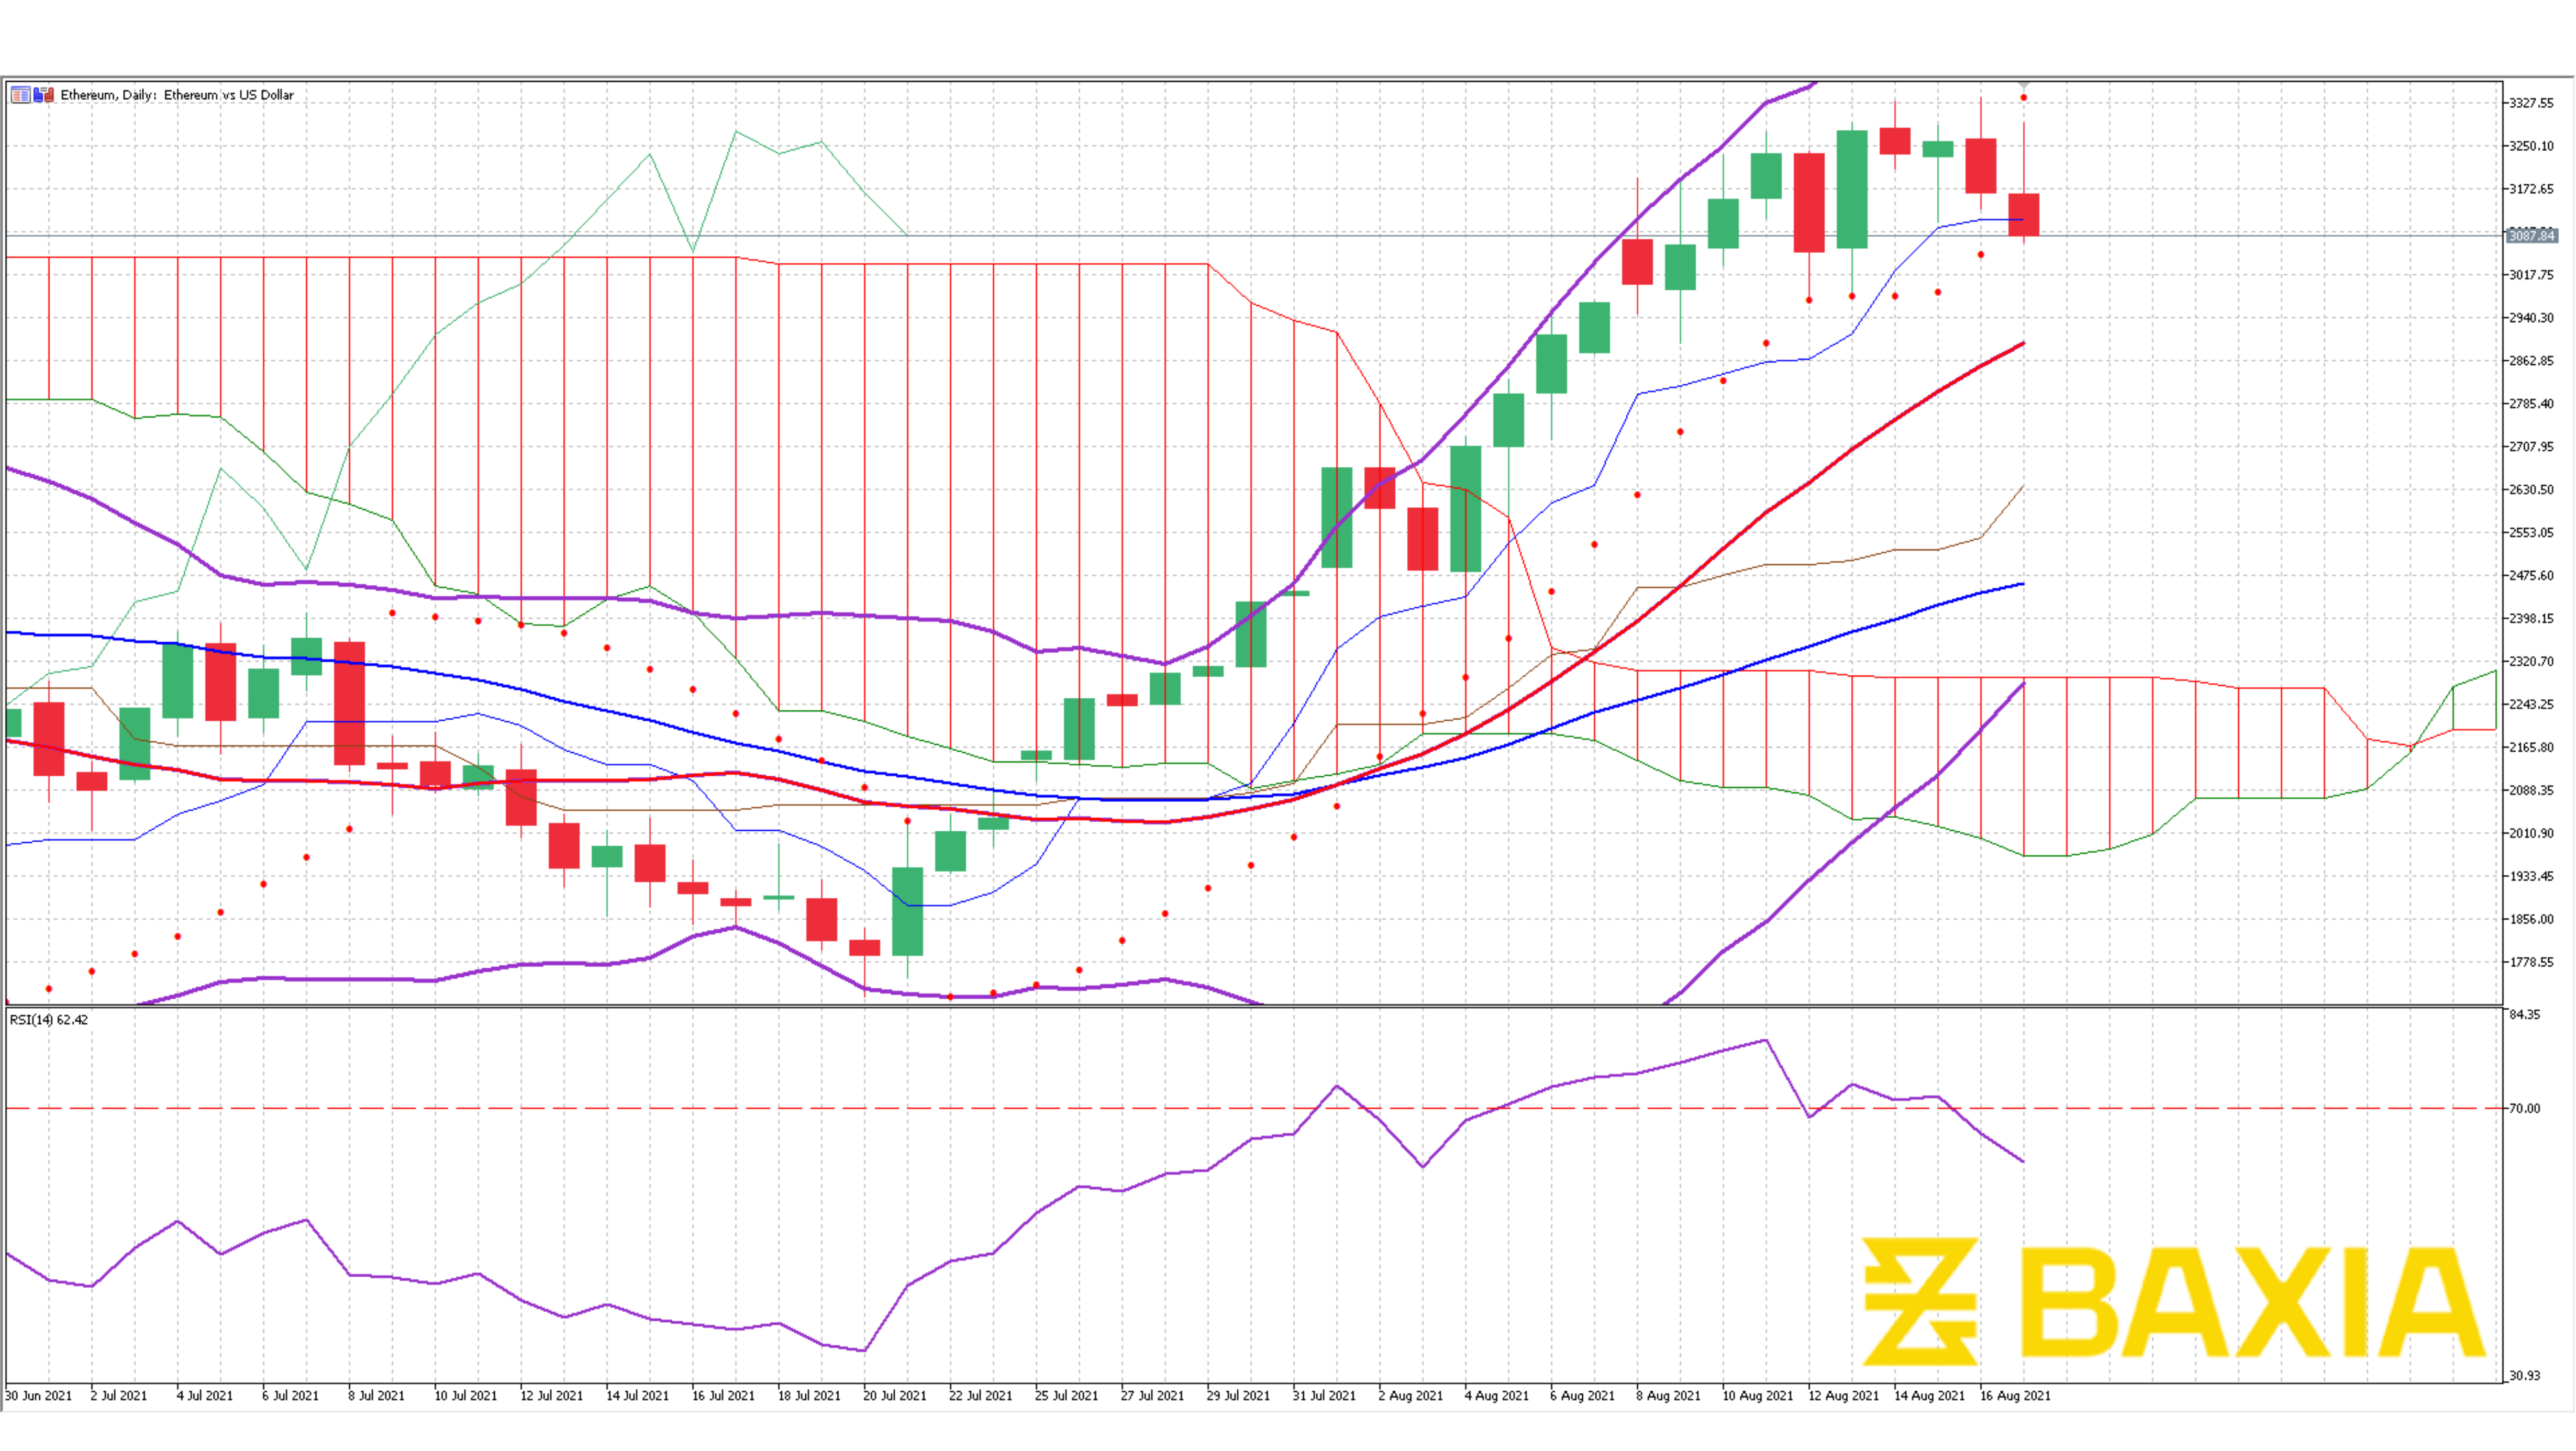

The cryptocurrency broke the 50% Fibonacci retracement, which signifies a trend reversal. After spending more than two months on a downtrend, the price is now back above the $3,000 level.
The price could break another resistance level at $3,366, located at 61.8%; this will help the pair in case there is a pullback or a correction in the short term as it will have two strong support levels.
The Bollinger bands are wide, indicating that volatility will be high in the following trading sessions. The pair is trading very close to the upper band, which some traders might see as a sign that the price is relatively high.
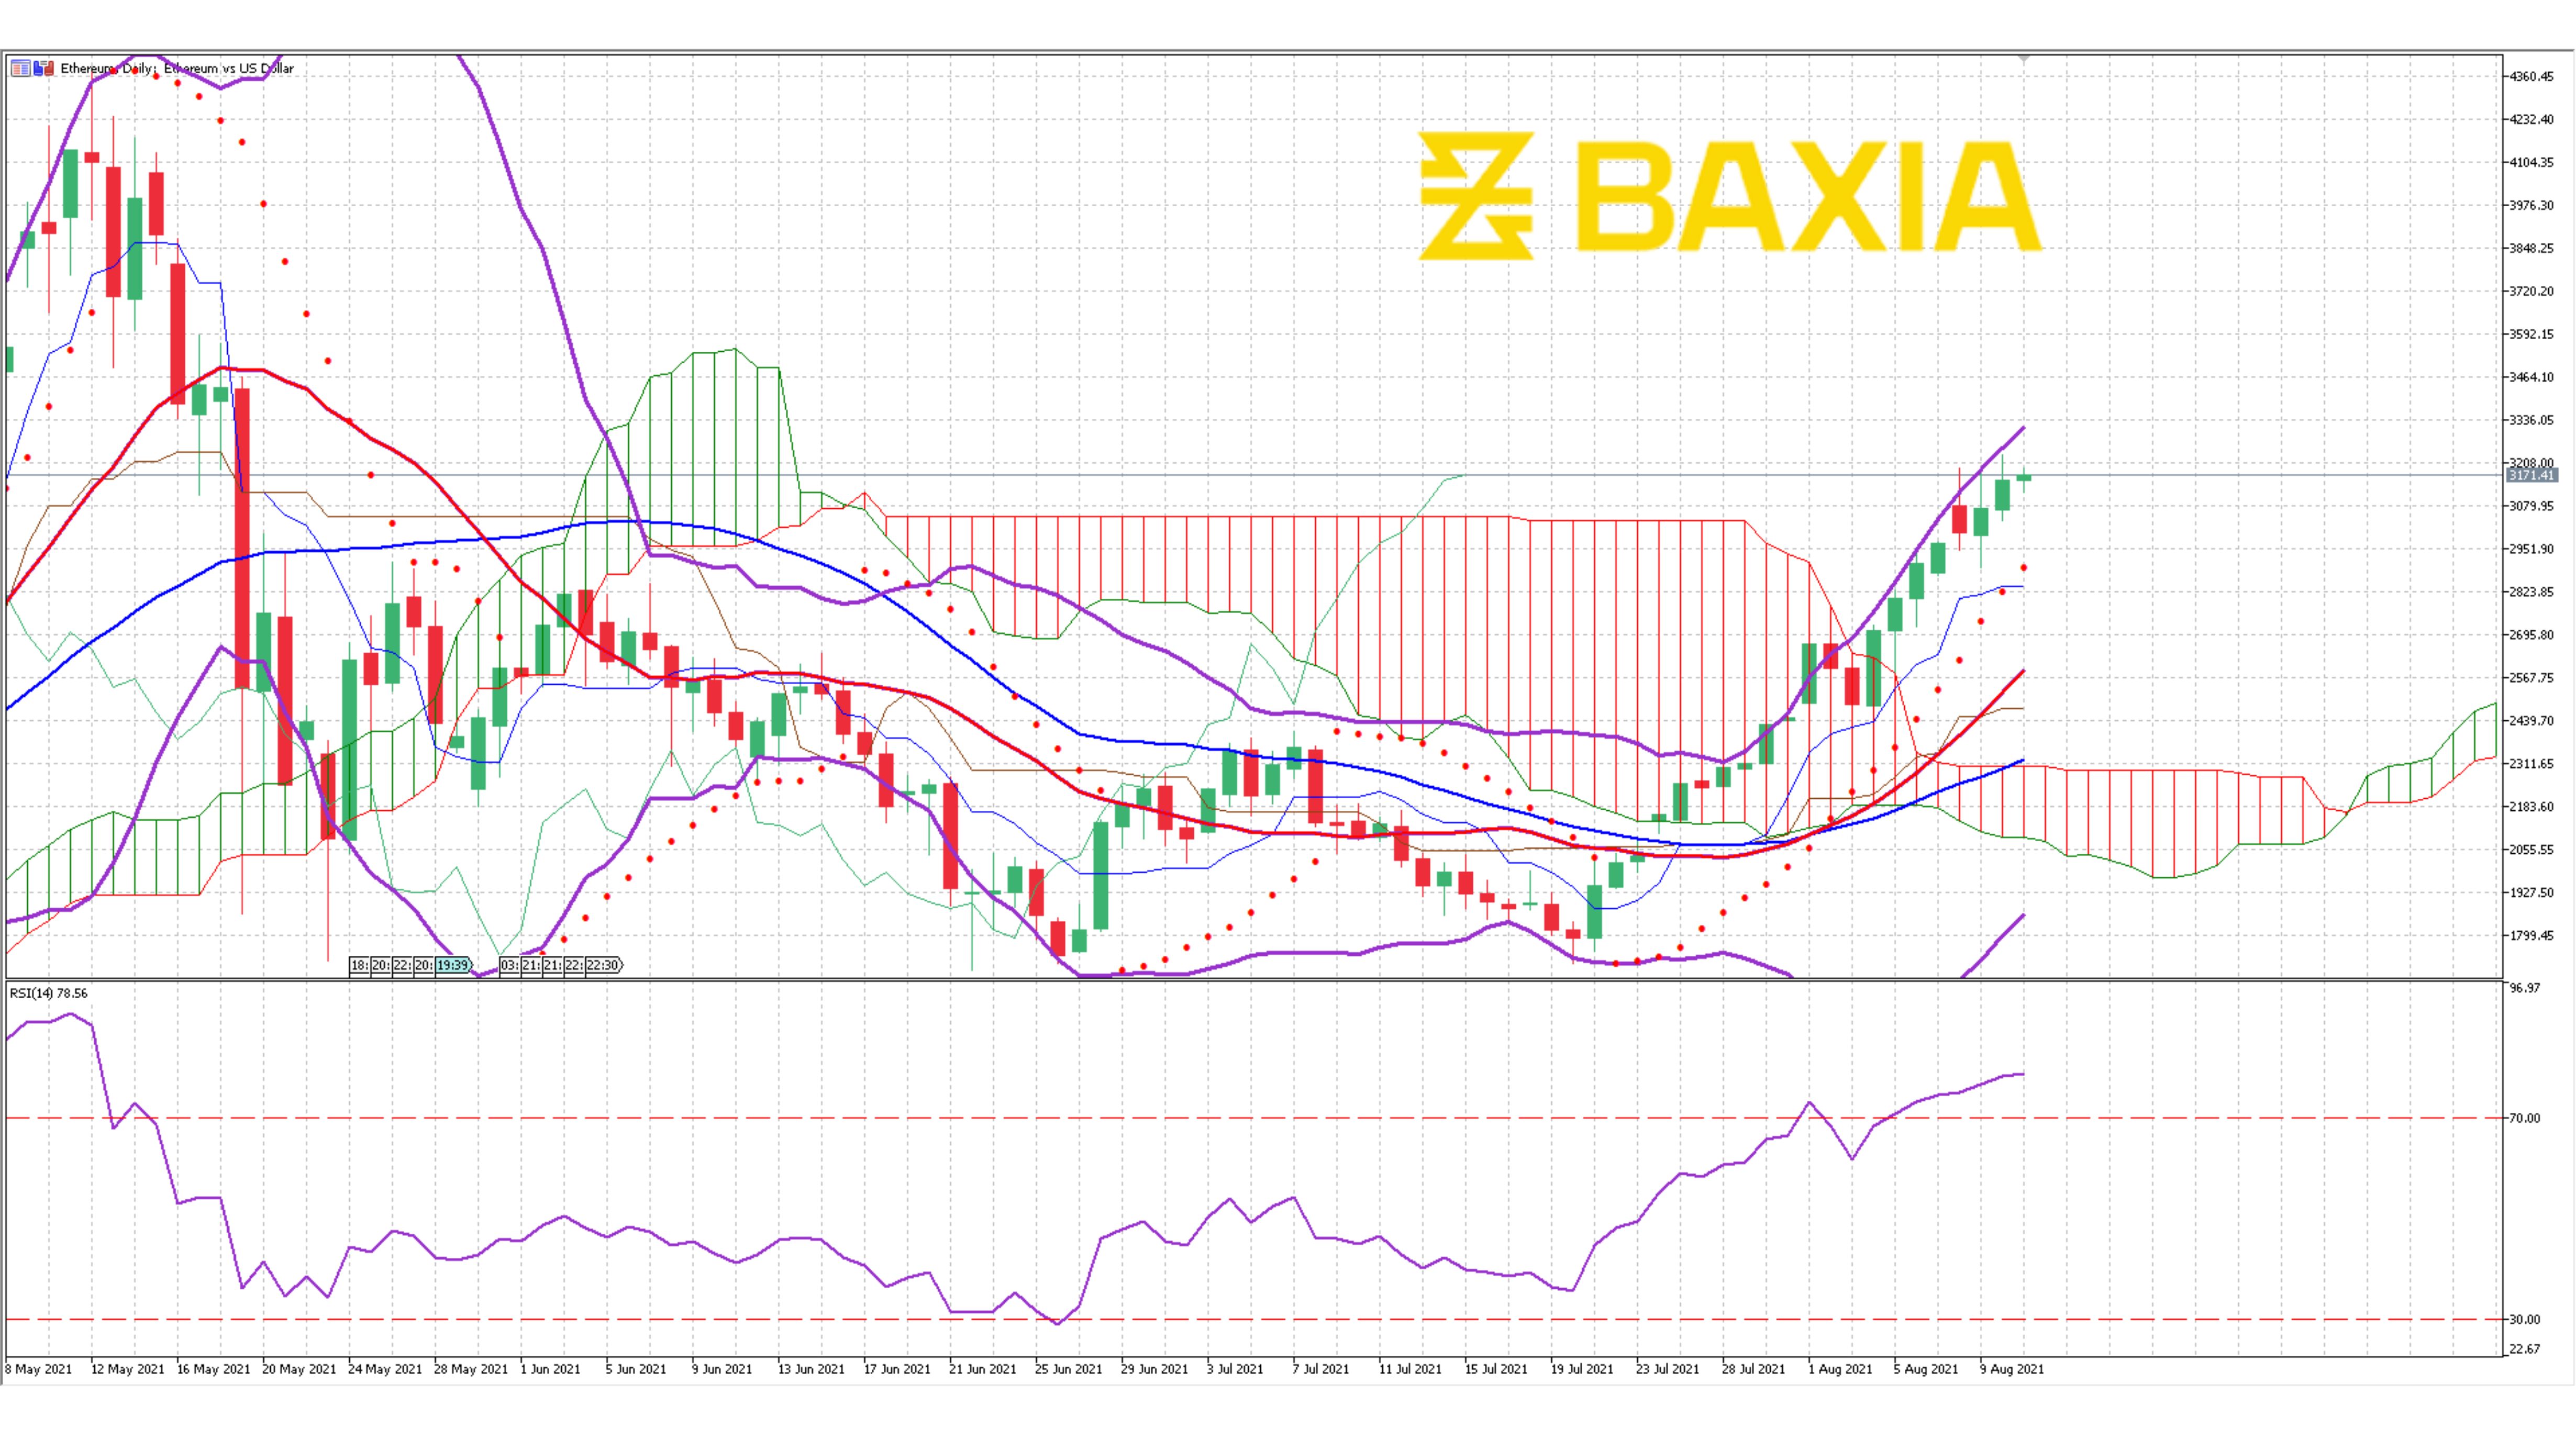
The relative strength index is currently overbought at 75%. From a technical analysis point of view, this should bring the price back down; however, we have seen ETH stay overbought and continue climbing in the past. The last time it went overbought, it stayed there for eleven trading sessions, right before the price plunged.
The short and long-term moving averages crossed at the beginning of the month; this often indicates an uptrend, strengthening the signals from our Fibonacci retracement.
We love to hear new ideas from traders and want to know what you think!
If you like this topic and want to suggest future topics that you find helpful, let us know by clicking the ‘submit your feedback’ button below.

Trading foreign exchange on margin carries a high level of risk, and may not be suitable for all investors. Before deciding to trade foreign exchange you should carefully consider your investment objectives, level of experience, and risk appetite.
Nothing contained in this website should be construed as investment advice. Any reference to an investment's past or potential performance is not, and should not be construed as, a recommendation or as a guarantee of any specific outcome or profit.