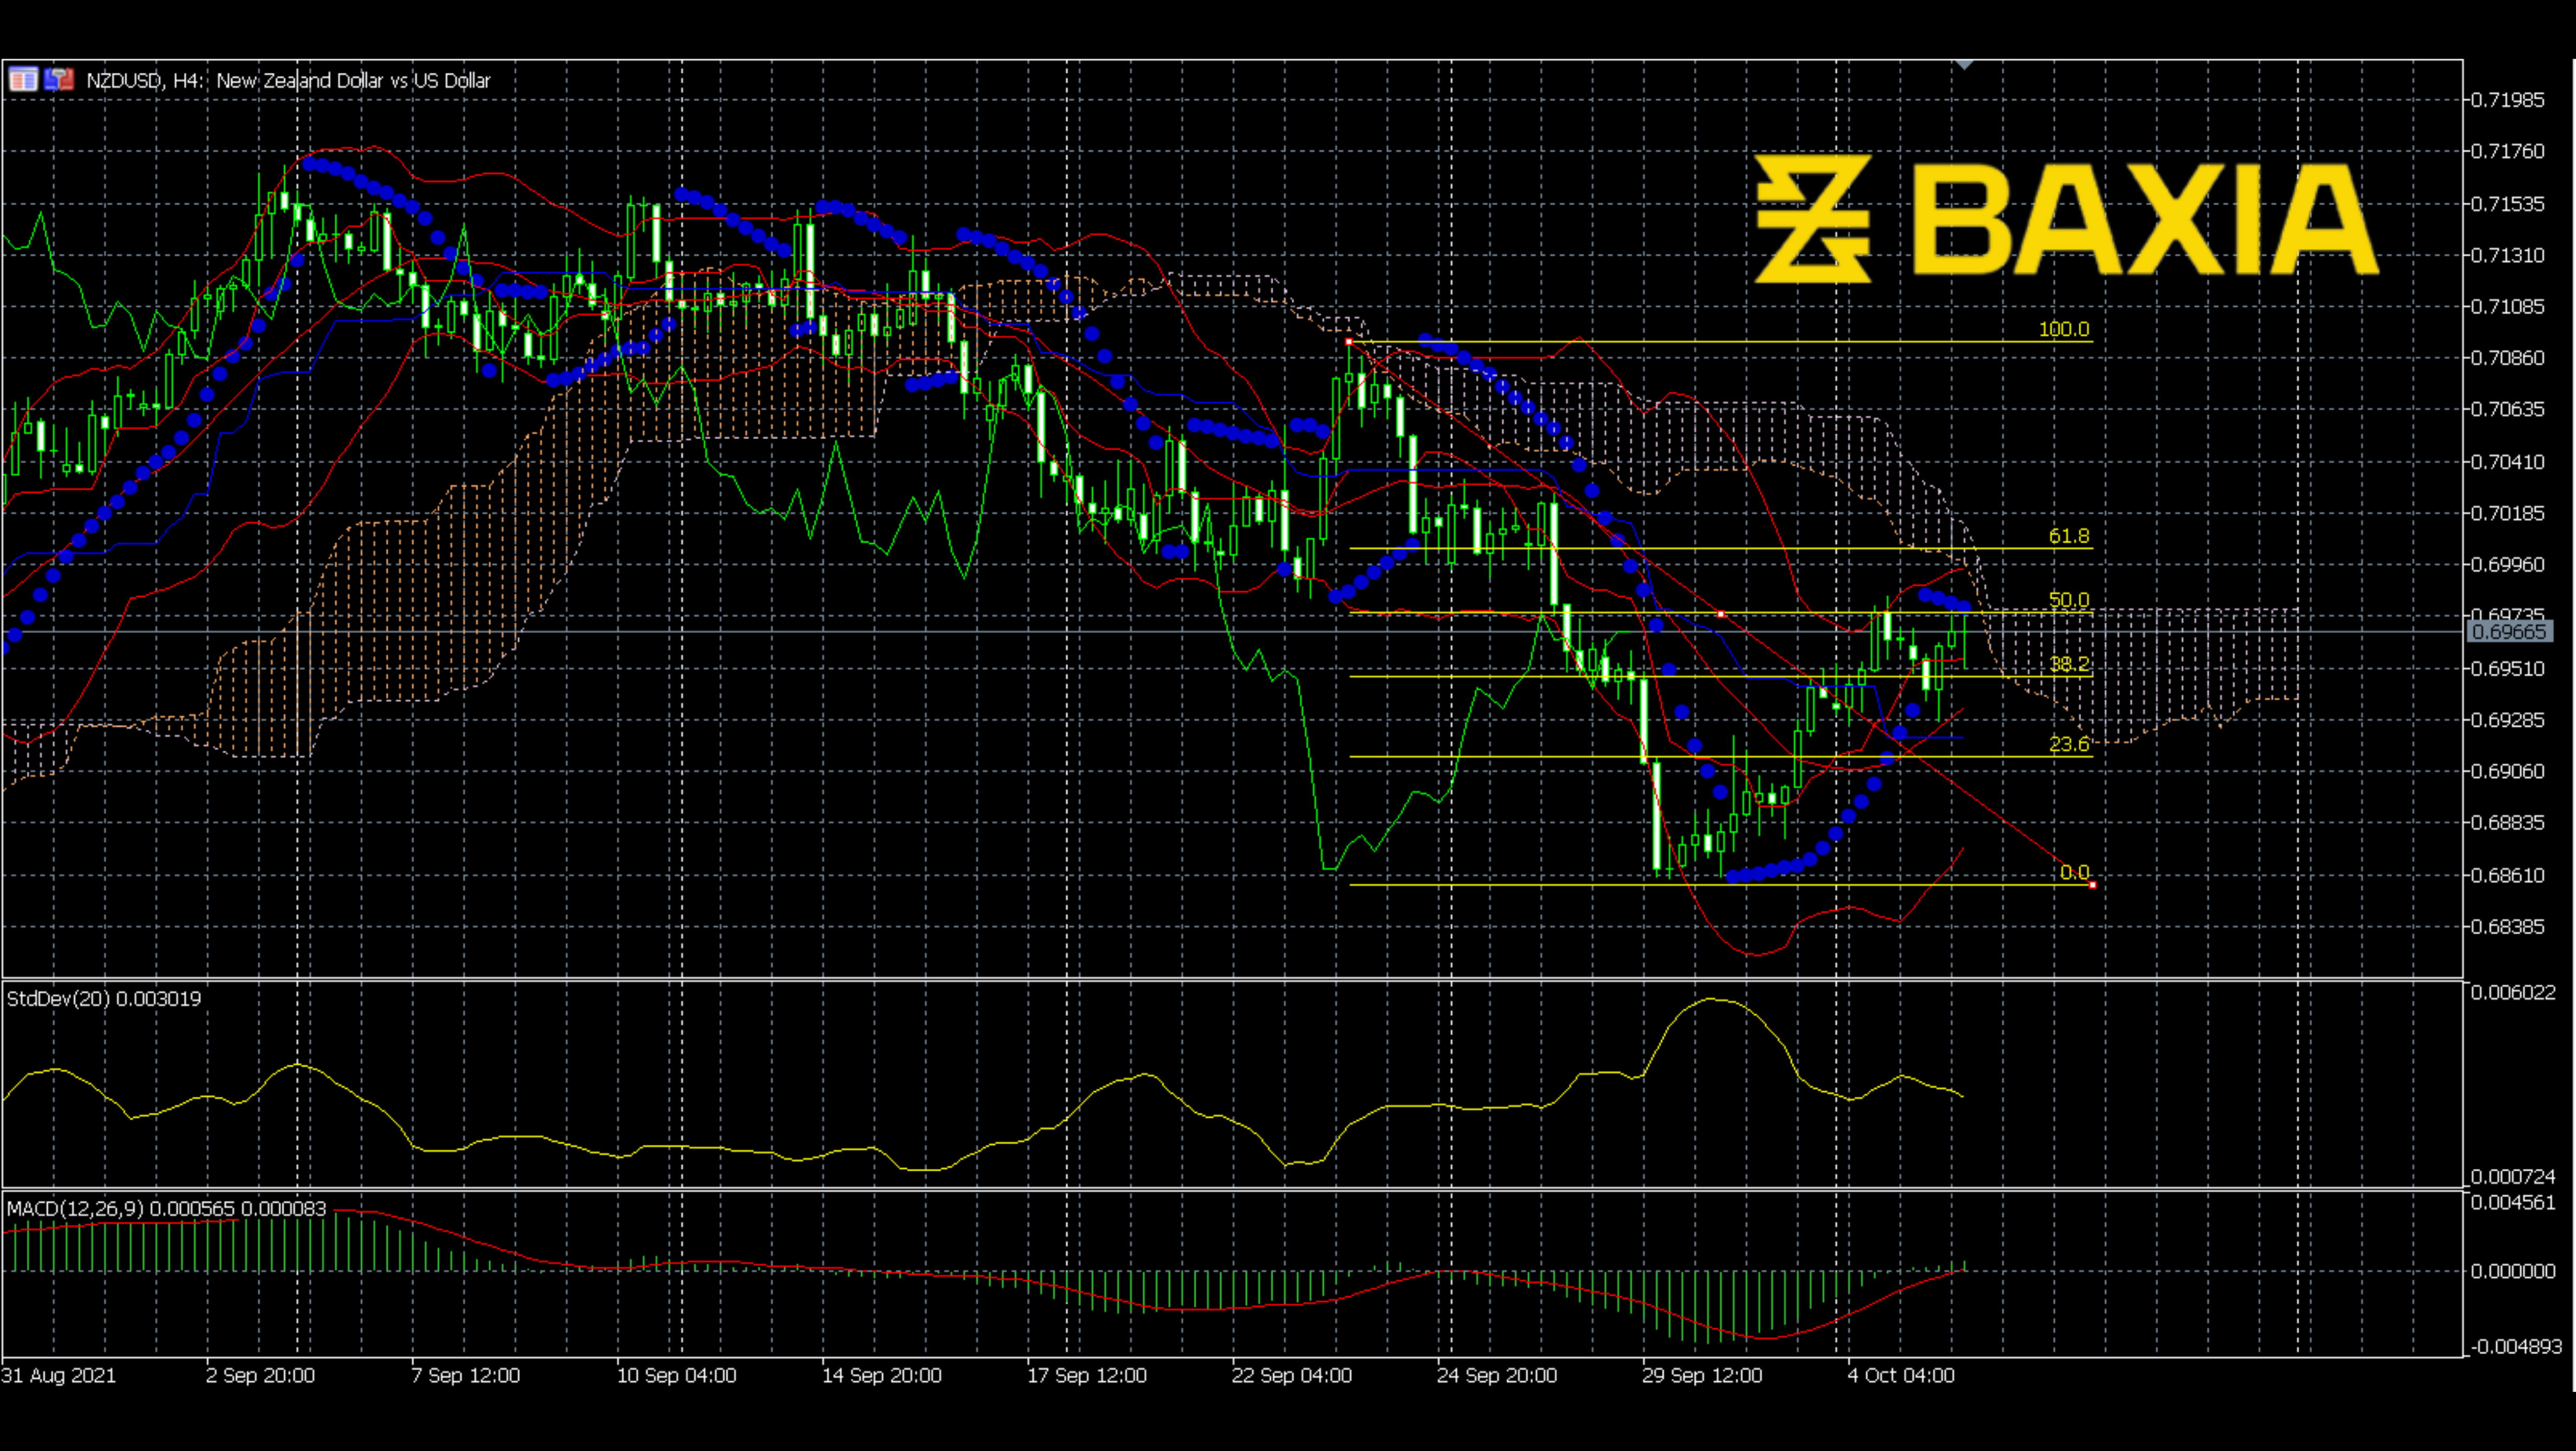

Previously, the price of GBPUSD had been going down for around 50 dayst. During this downward movement, the price had gone down by 4.75%, a considerable amount. The price then started to bounce up on Jul 20, already reaching the 50% Fibonacci level. Will the price meet the resistance here?
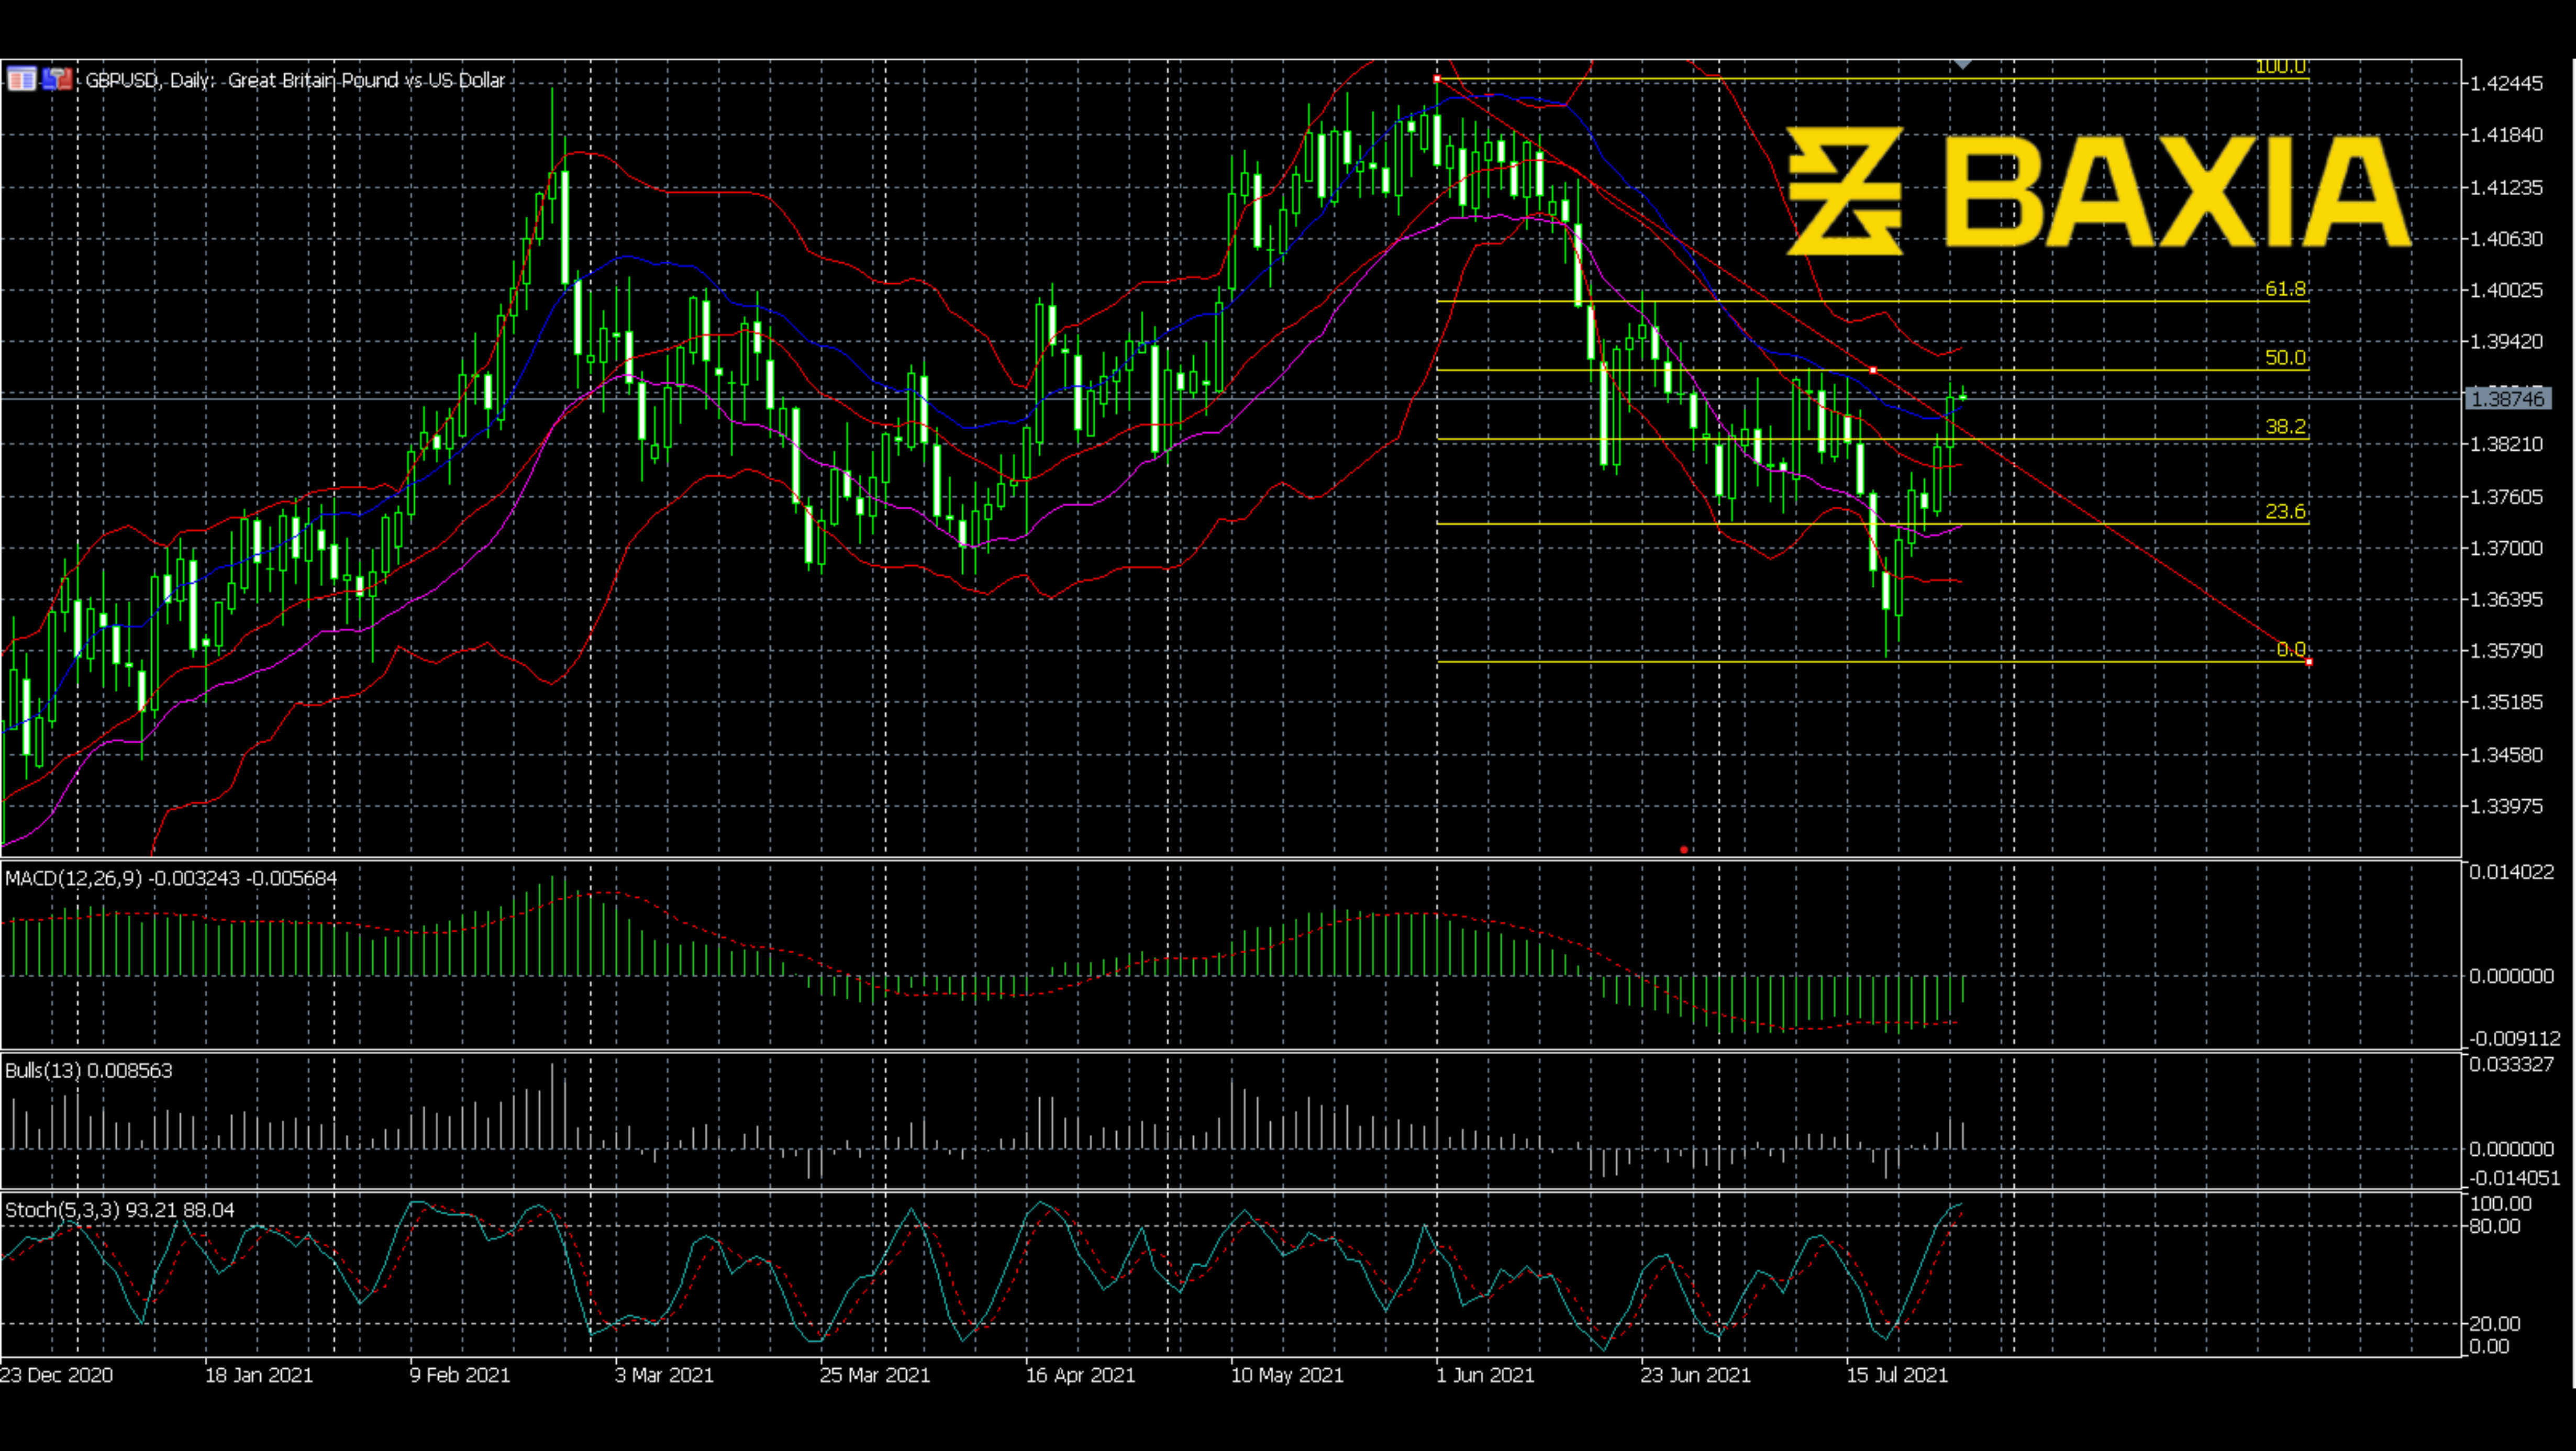
The 50% Fibonacci level is no doubt a resistant level. Also, the price recovered from the downward breakout of Bollinger Bands and reached the resistance line, so the upper Bollinger band is not far from here, which means the price may then face more pressure.
MACD is moving up; however, we know that MACD is a lagged indicator, the chart might review the lagging information. Stochastic is already oversold; the price could turn down at any second. Although the ball power is still positive, it's passed the peak. Let’s pay more attention to the price line and see if it could reach the upper Bollinger Band.
We love to hear new ideas from traders and want to know what you think!
If you like this topic and want to suggest future topics that you find helpful, let us know by clicking the ‘submit your feedback’ button below.

Trading foreign exchange on margin carries a high level of risk, and may not be suitable for all investors. Before deciding to trade foreign exchange you should carefully consider your investment objectives, level of experience, and risk appetite.
Nothing contained in this website should be construed as investment advice. Any reference to an investment's past or potential performance is not, and should not be construed as, a recommendation or as a guarantee of any specific outcome or profit.