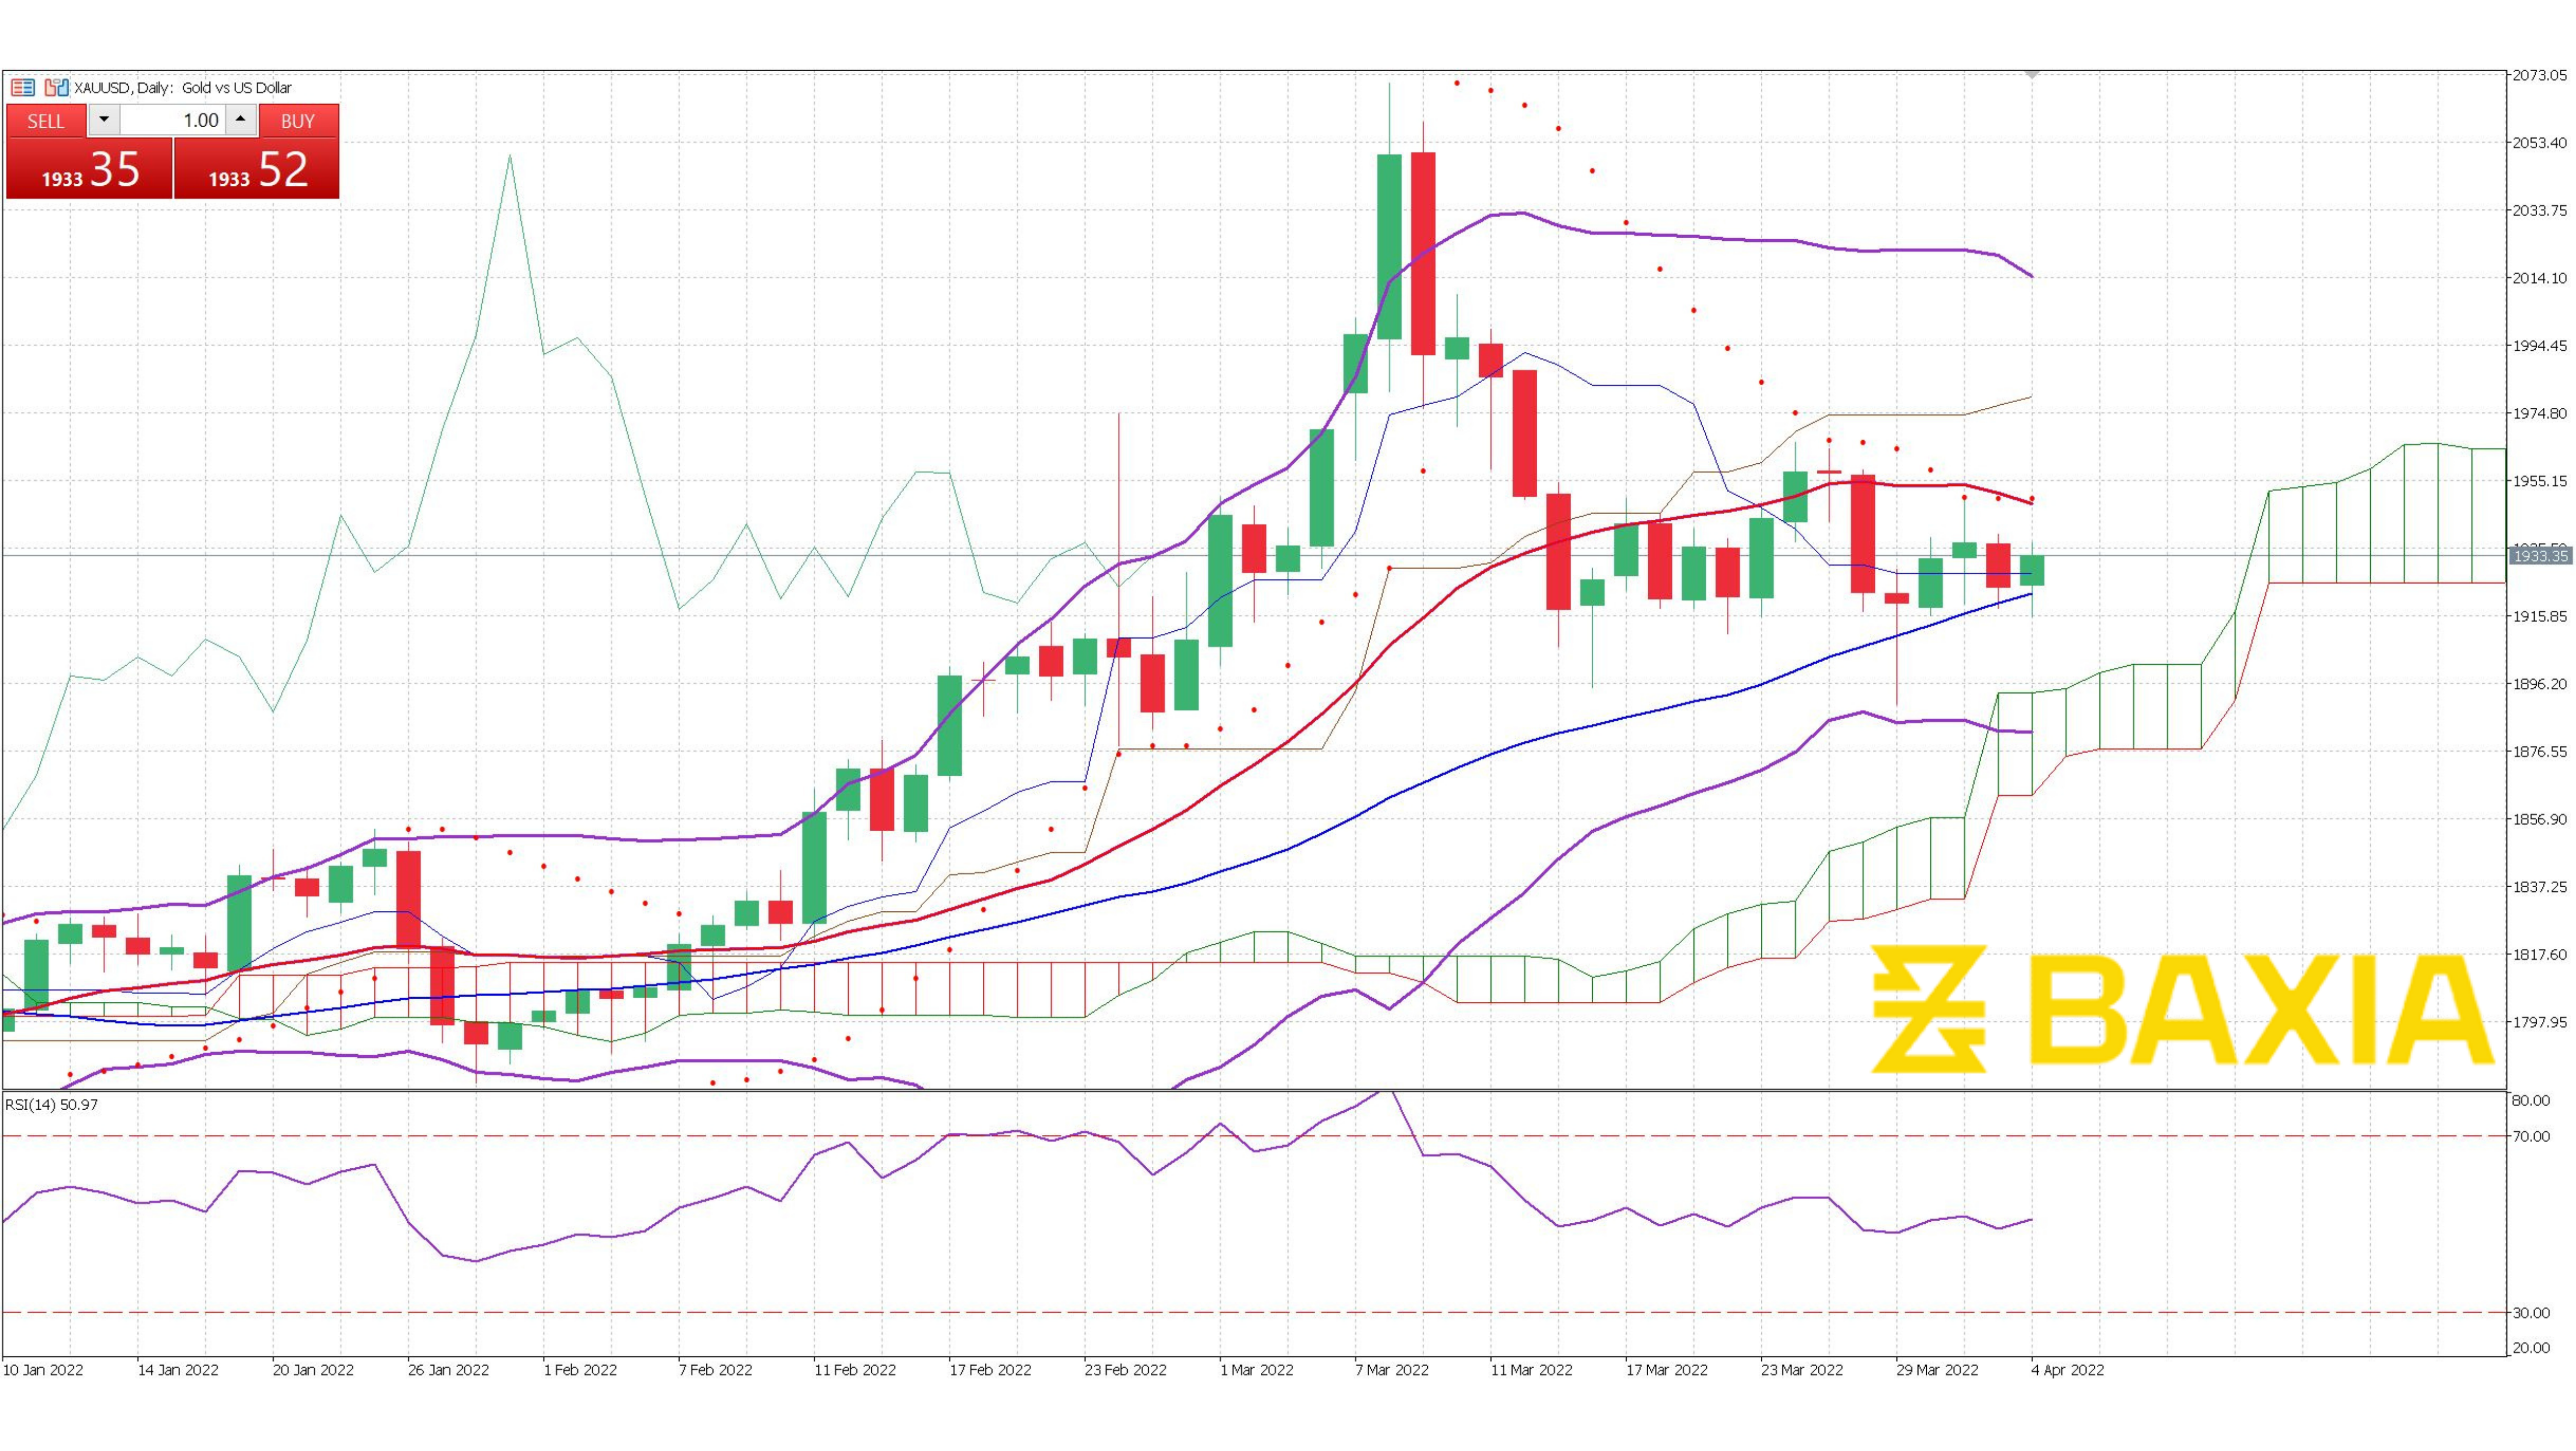

The precious metal continues moving within the 50% and 38.2% Fibonacci retracements for the seventh consecutive day, the pair is finding support at $1,911 and resistance at $1,949. The price is currently trading slightly below the short-term moving average but above the long-term. If gold is able to break the resistance we could see the upward trend continue for some sessions.
The Bollinger bands are very wide but they are starting to close; however, volatility should still be high, the pair trades in a safe zone between the bands, and the price is considered to be at a fair level.
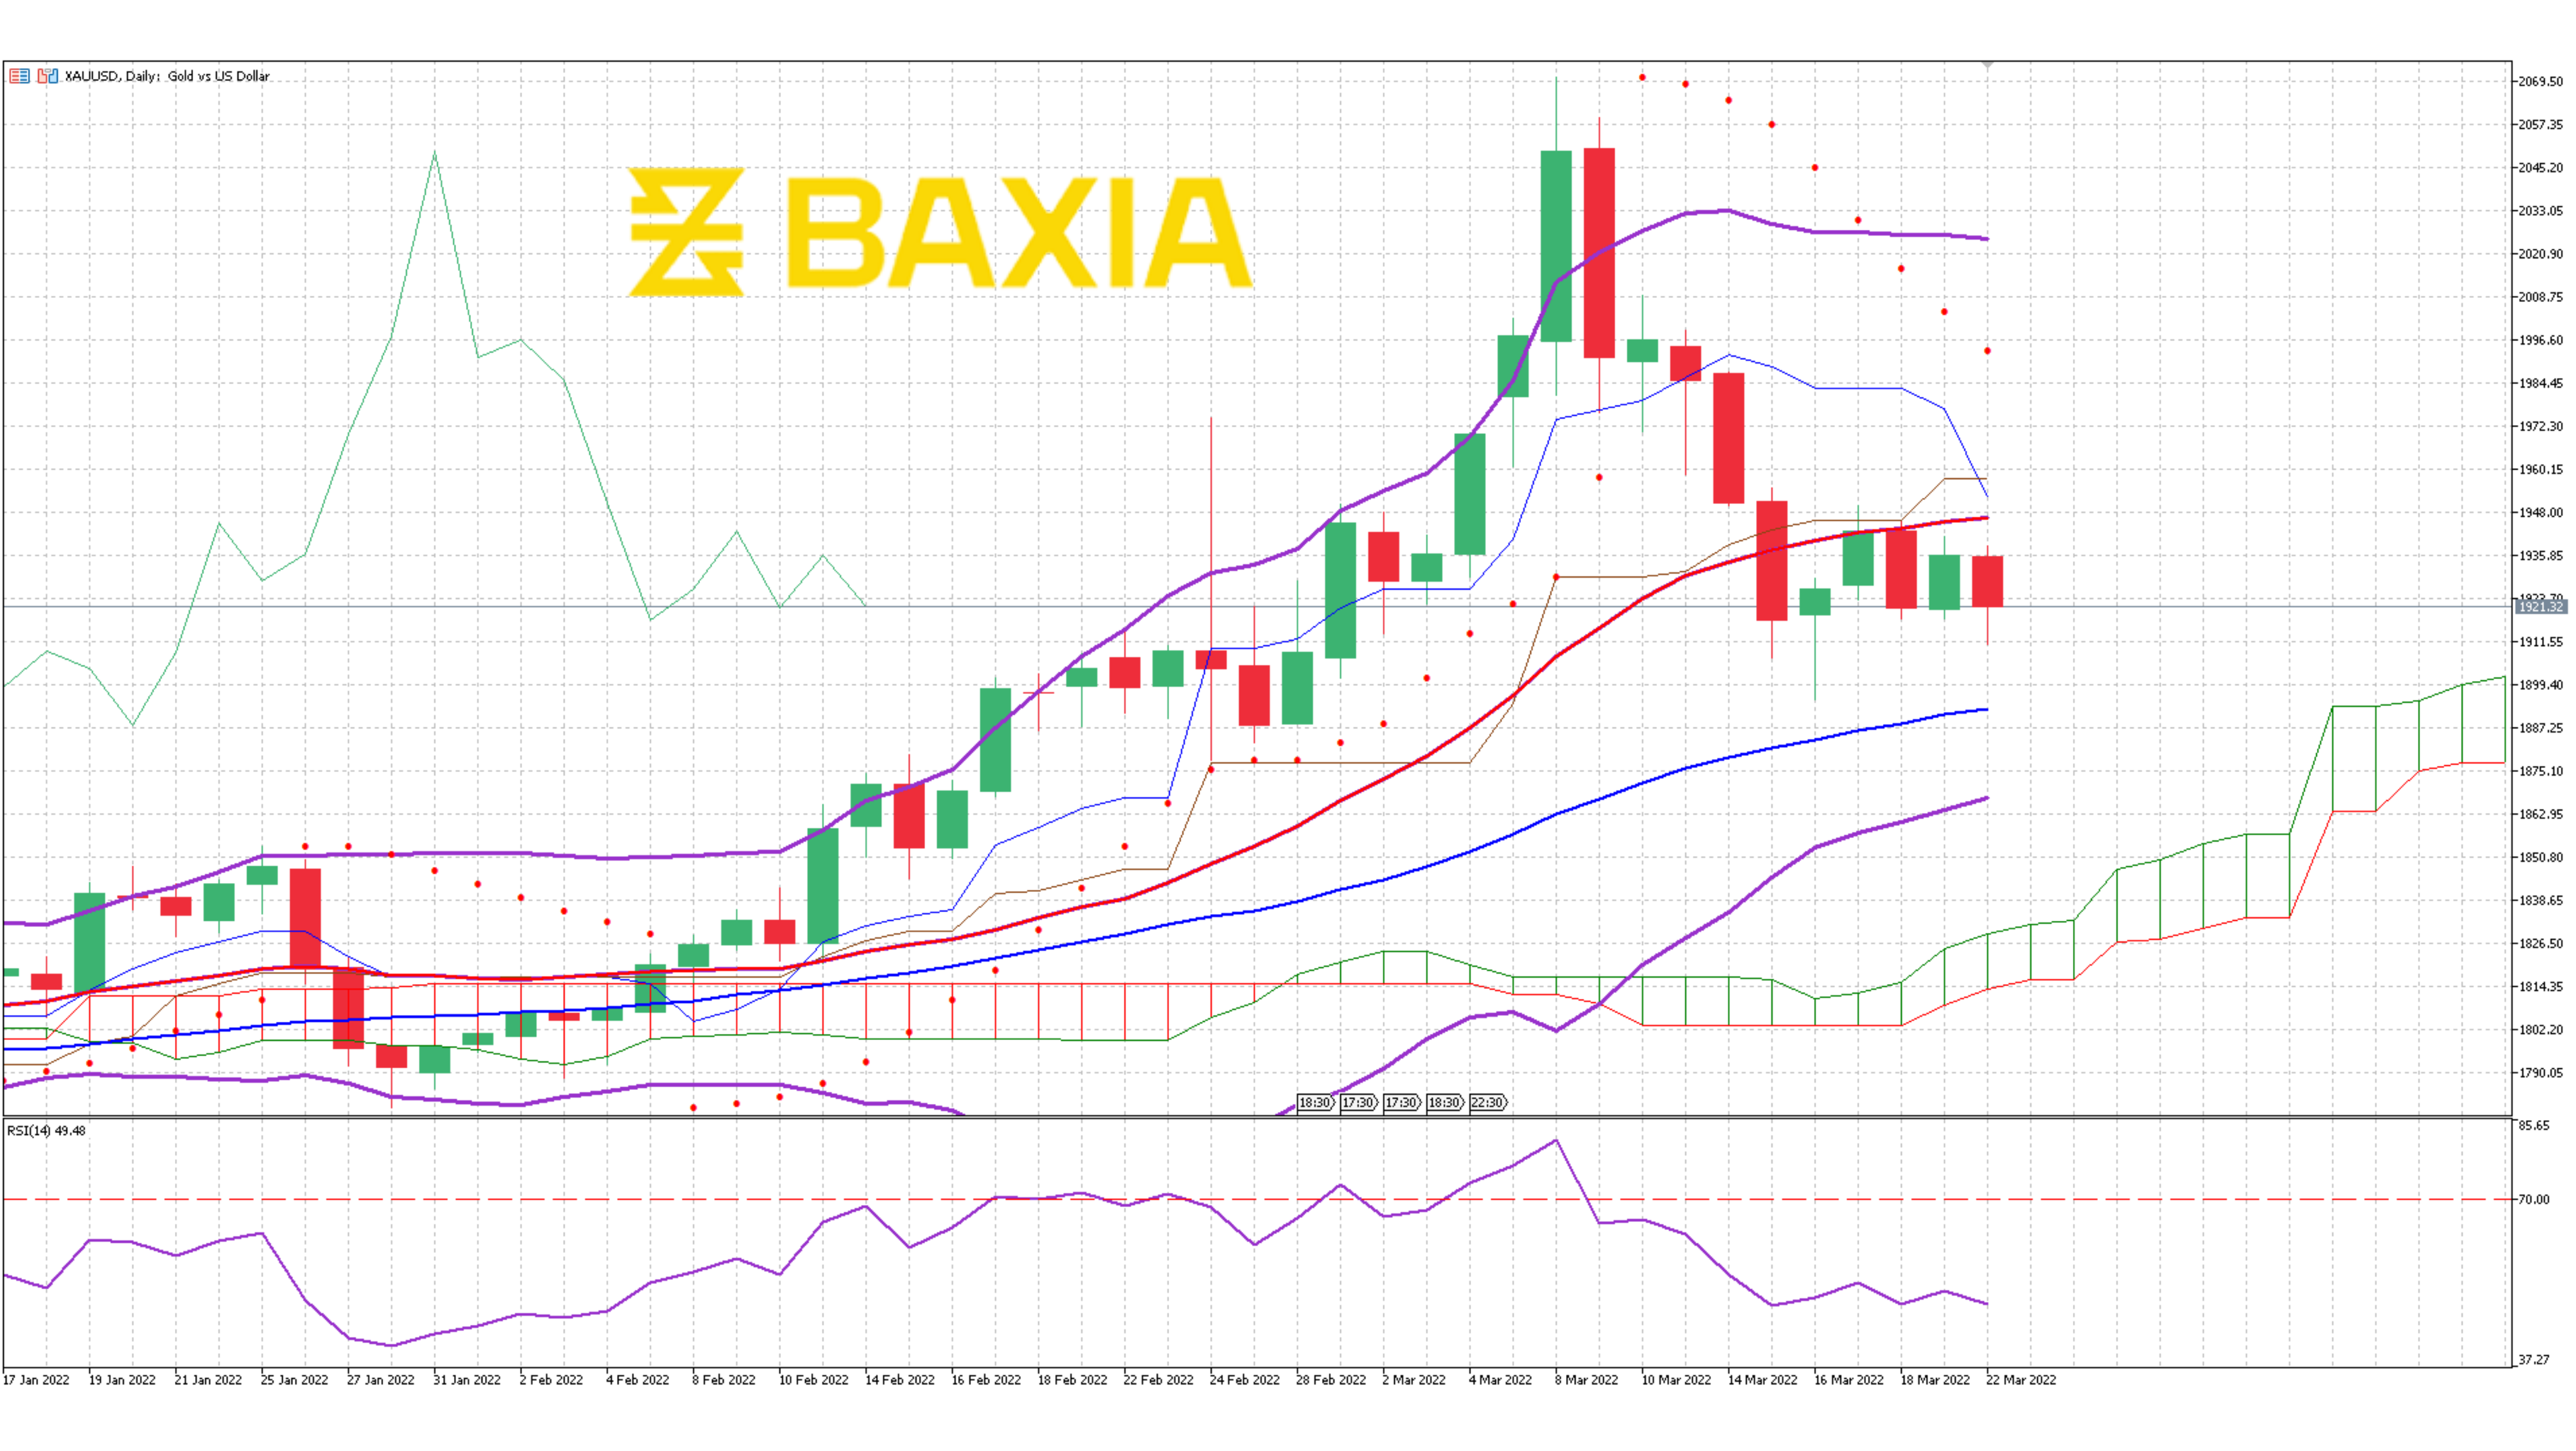
The relative strength index is at 54% which will allow Gold to continue moving up in the upcoming sessions, once it gets closer to the overbought status we might start seeing temporary pullbacks. Our SAR indicator suggests that the price will fall in the short term, but most technical indicators suggest the opposite.
We love to hear new ideas from traders and want to know what you think!
If you like this topic and want to suggest future topics that you find helpful, let us know by clicking the ‘submit your feedback’ button below.

Trading foreign exchange on margin carries a high level of risk, and may not be suitable for all investors. Before deciding to trade foreign exchange you should carefully consider your investment objectives, level of experience, and risk appetite.
Nothing contained in this website should be construed as investment advice. Any reference to an investment's past or potential performance is not, and should not be construed as, a recommendation or as a guarantee of any specific outcome or profit.