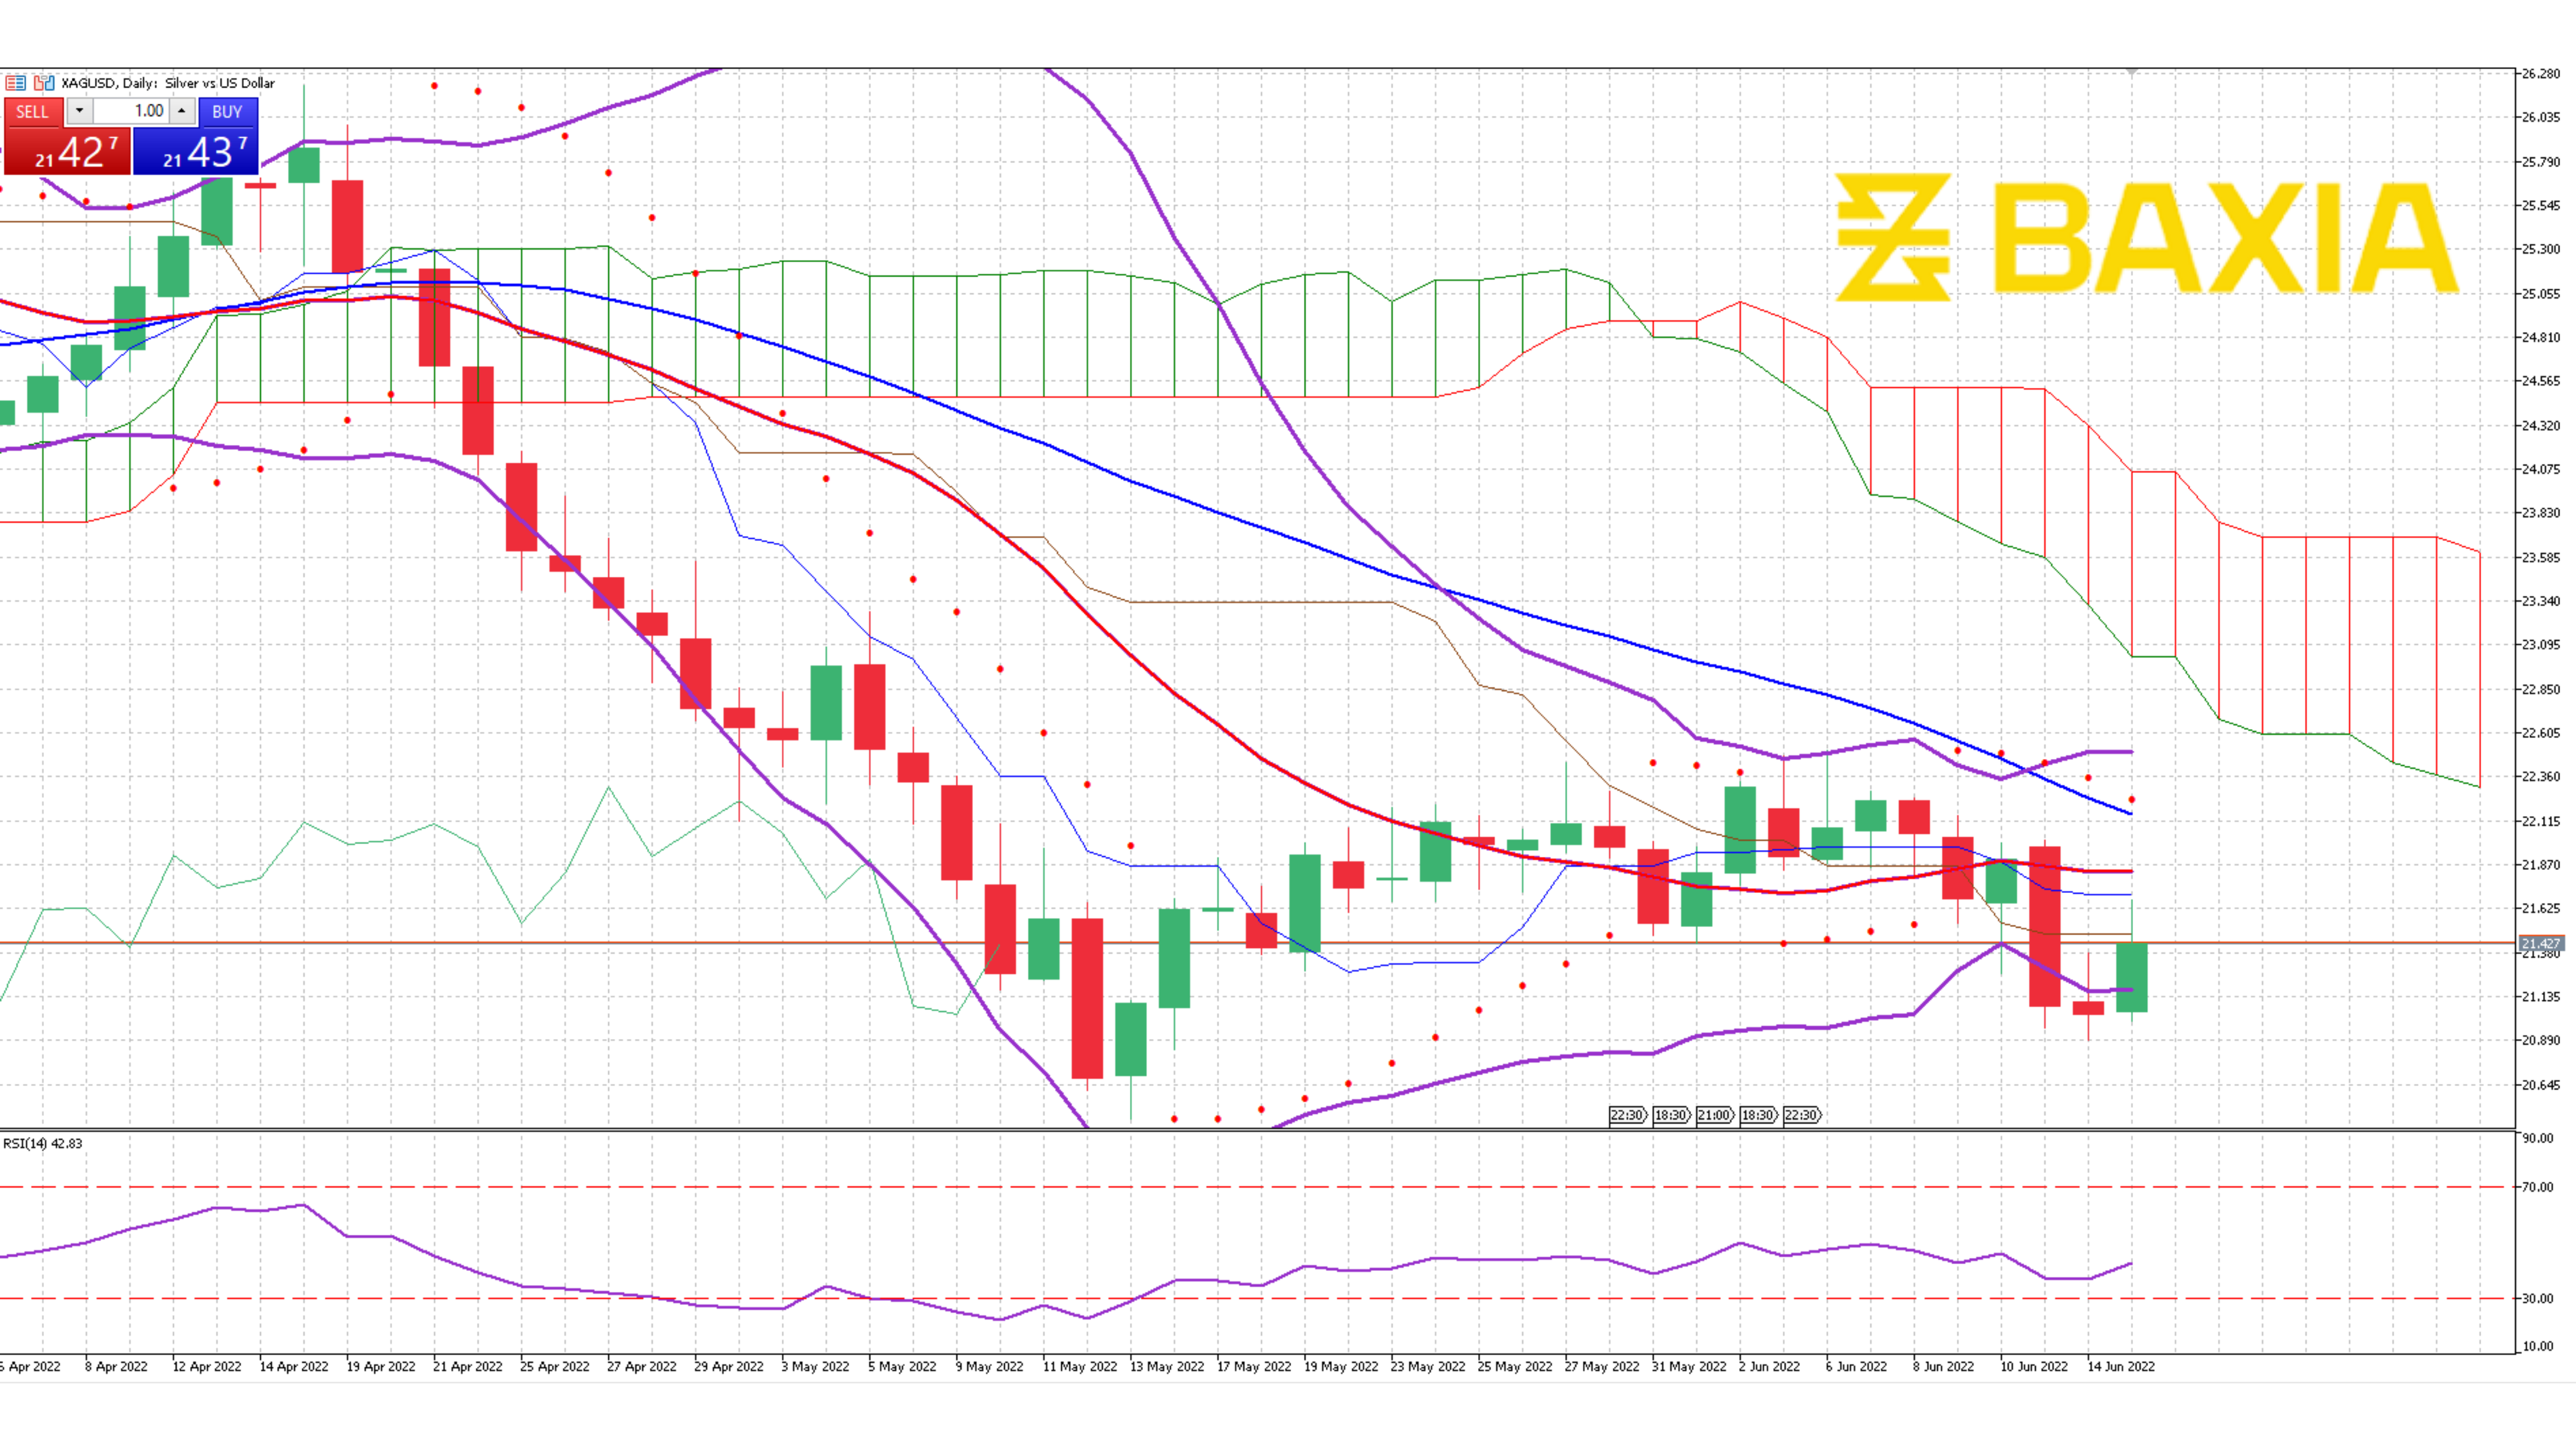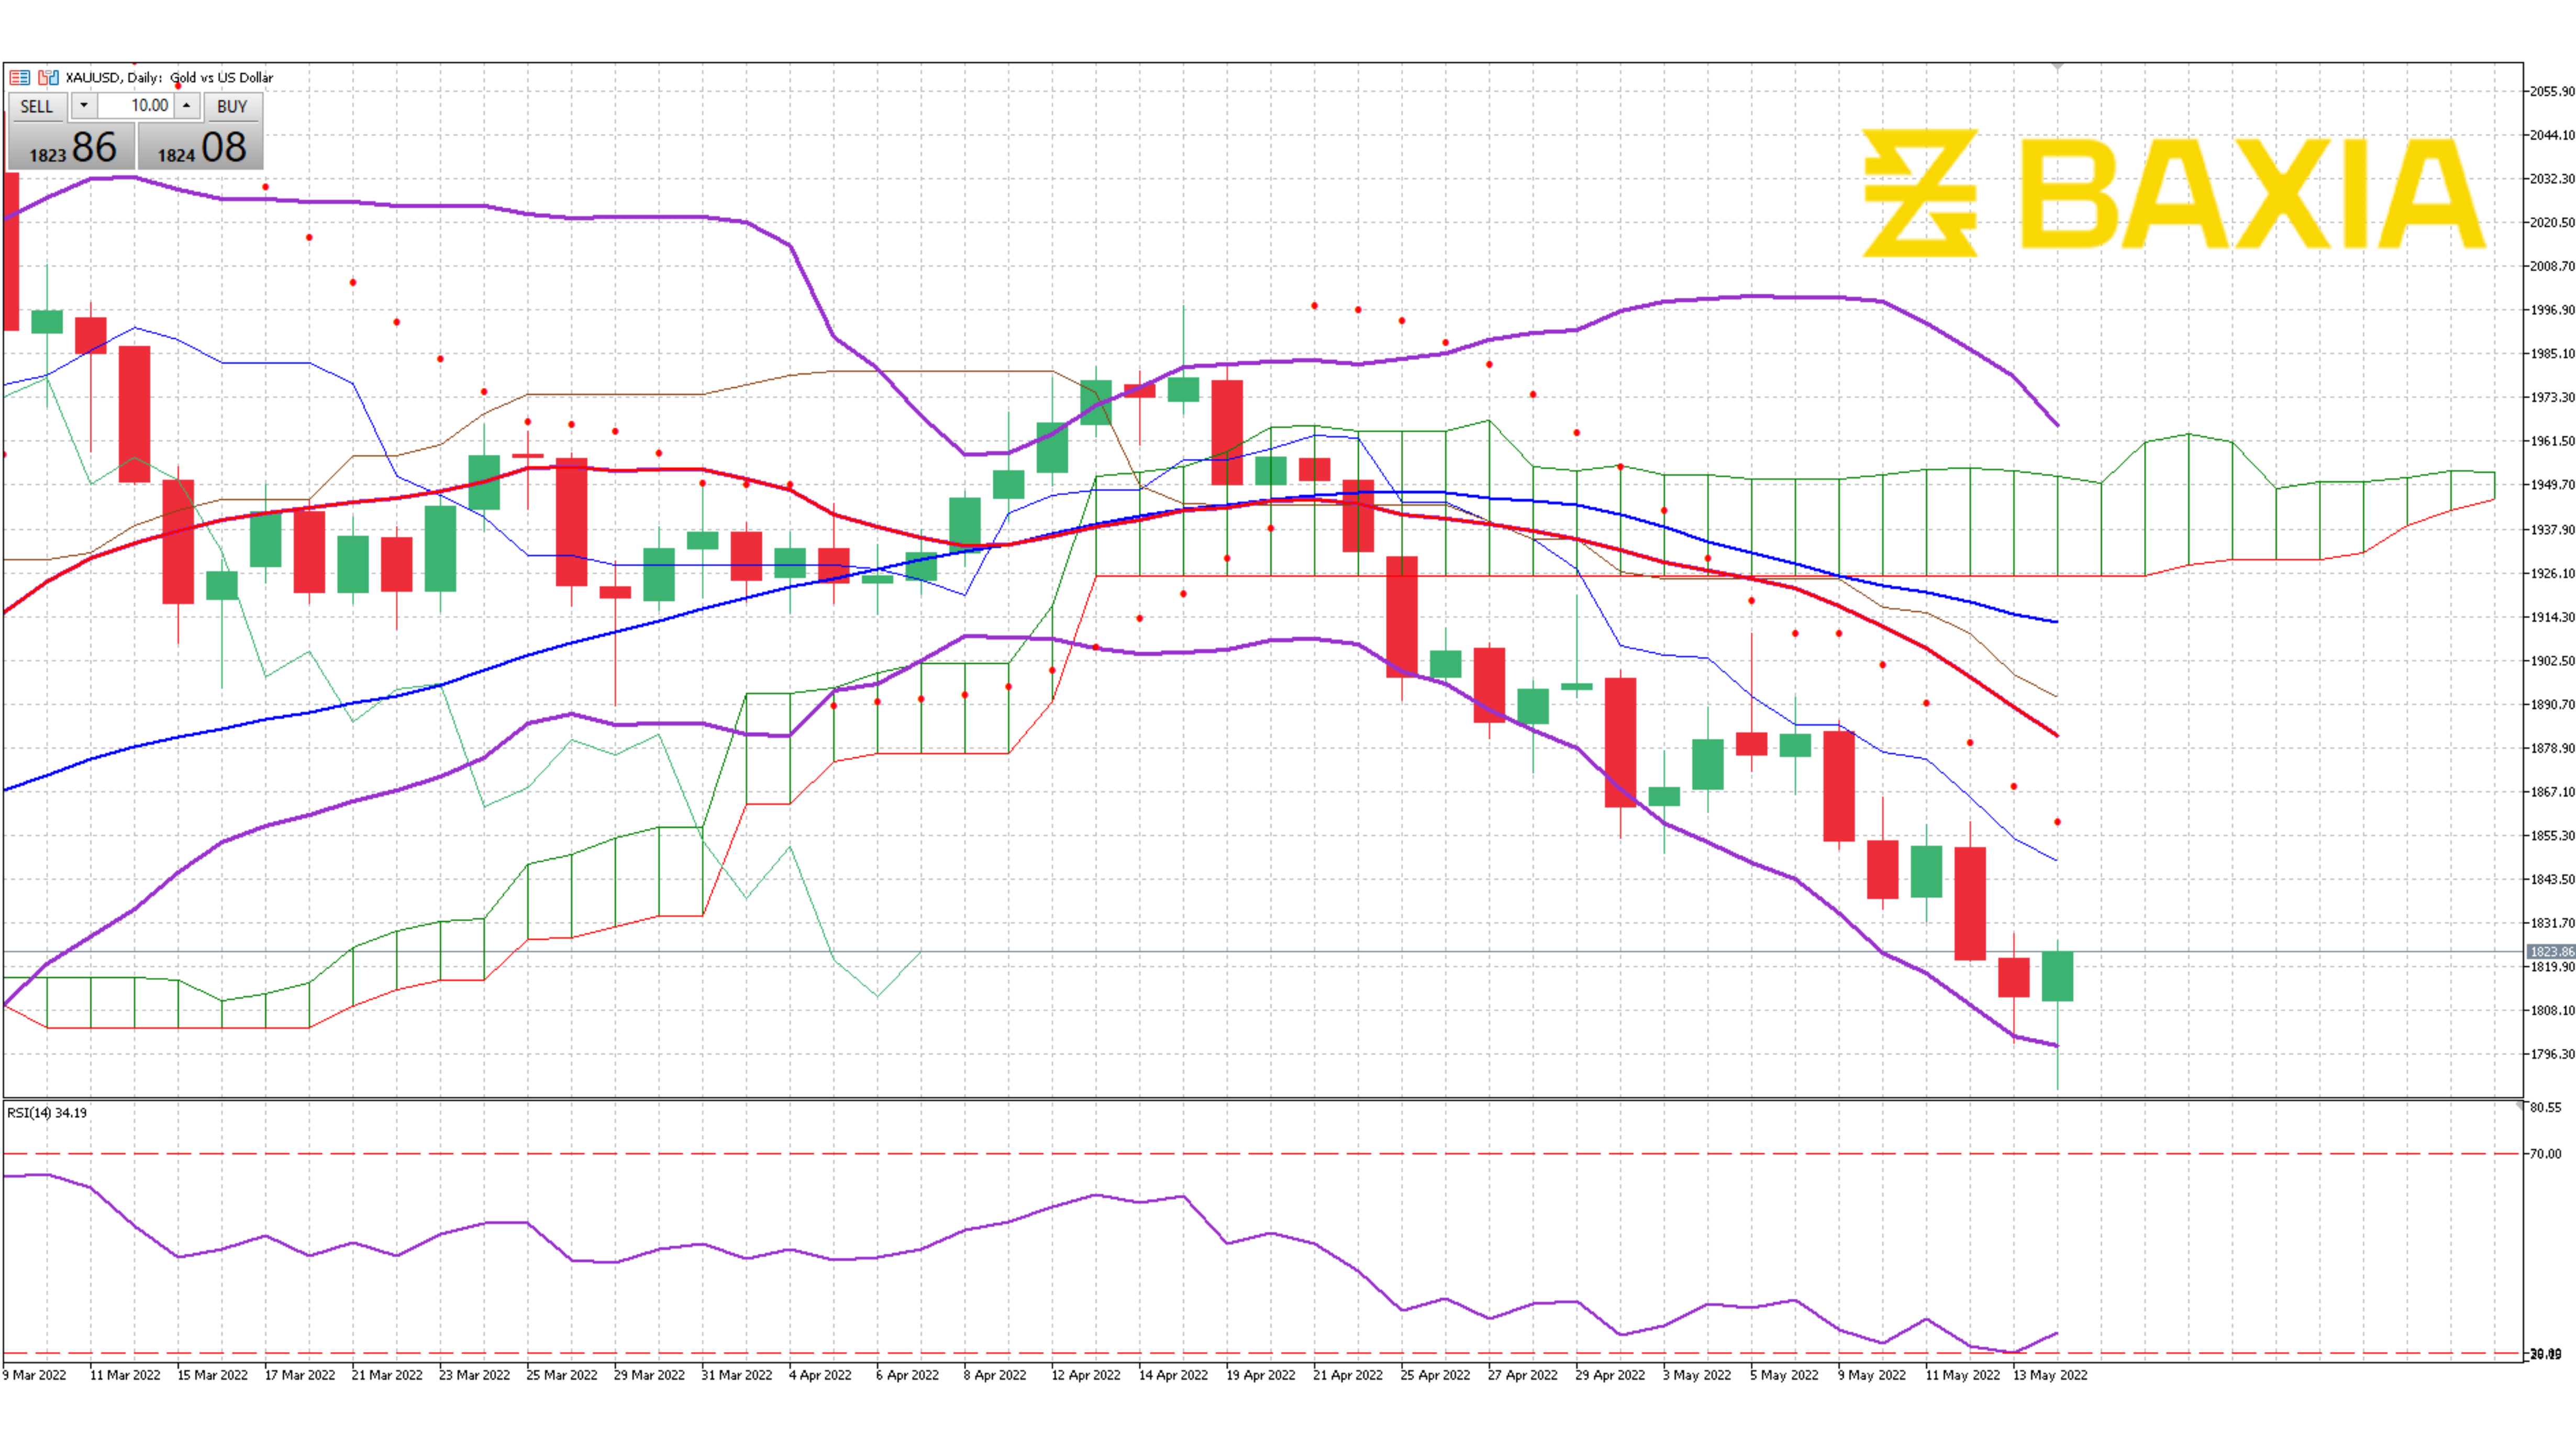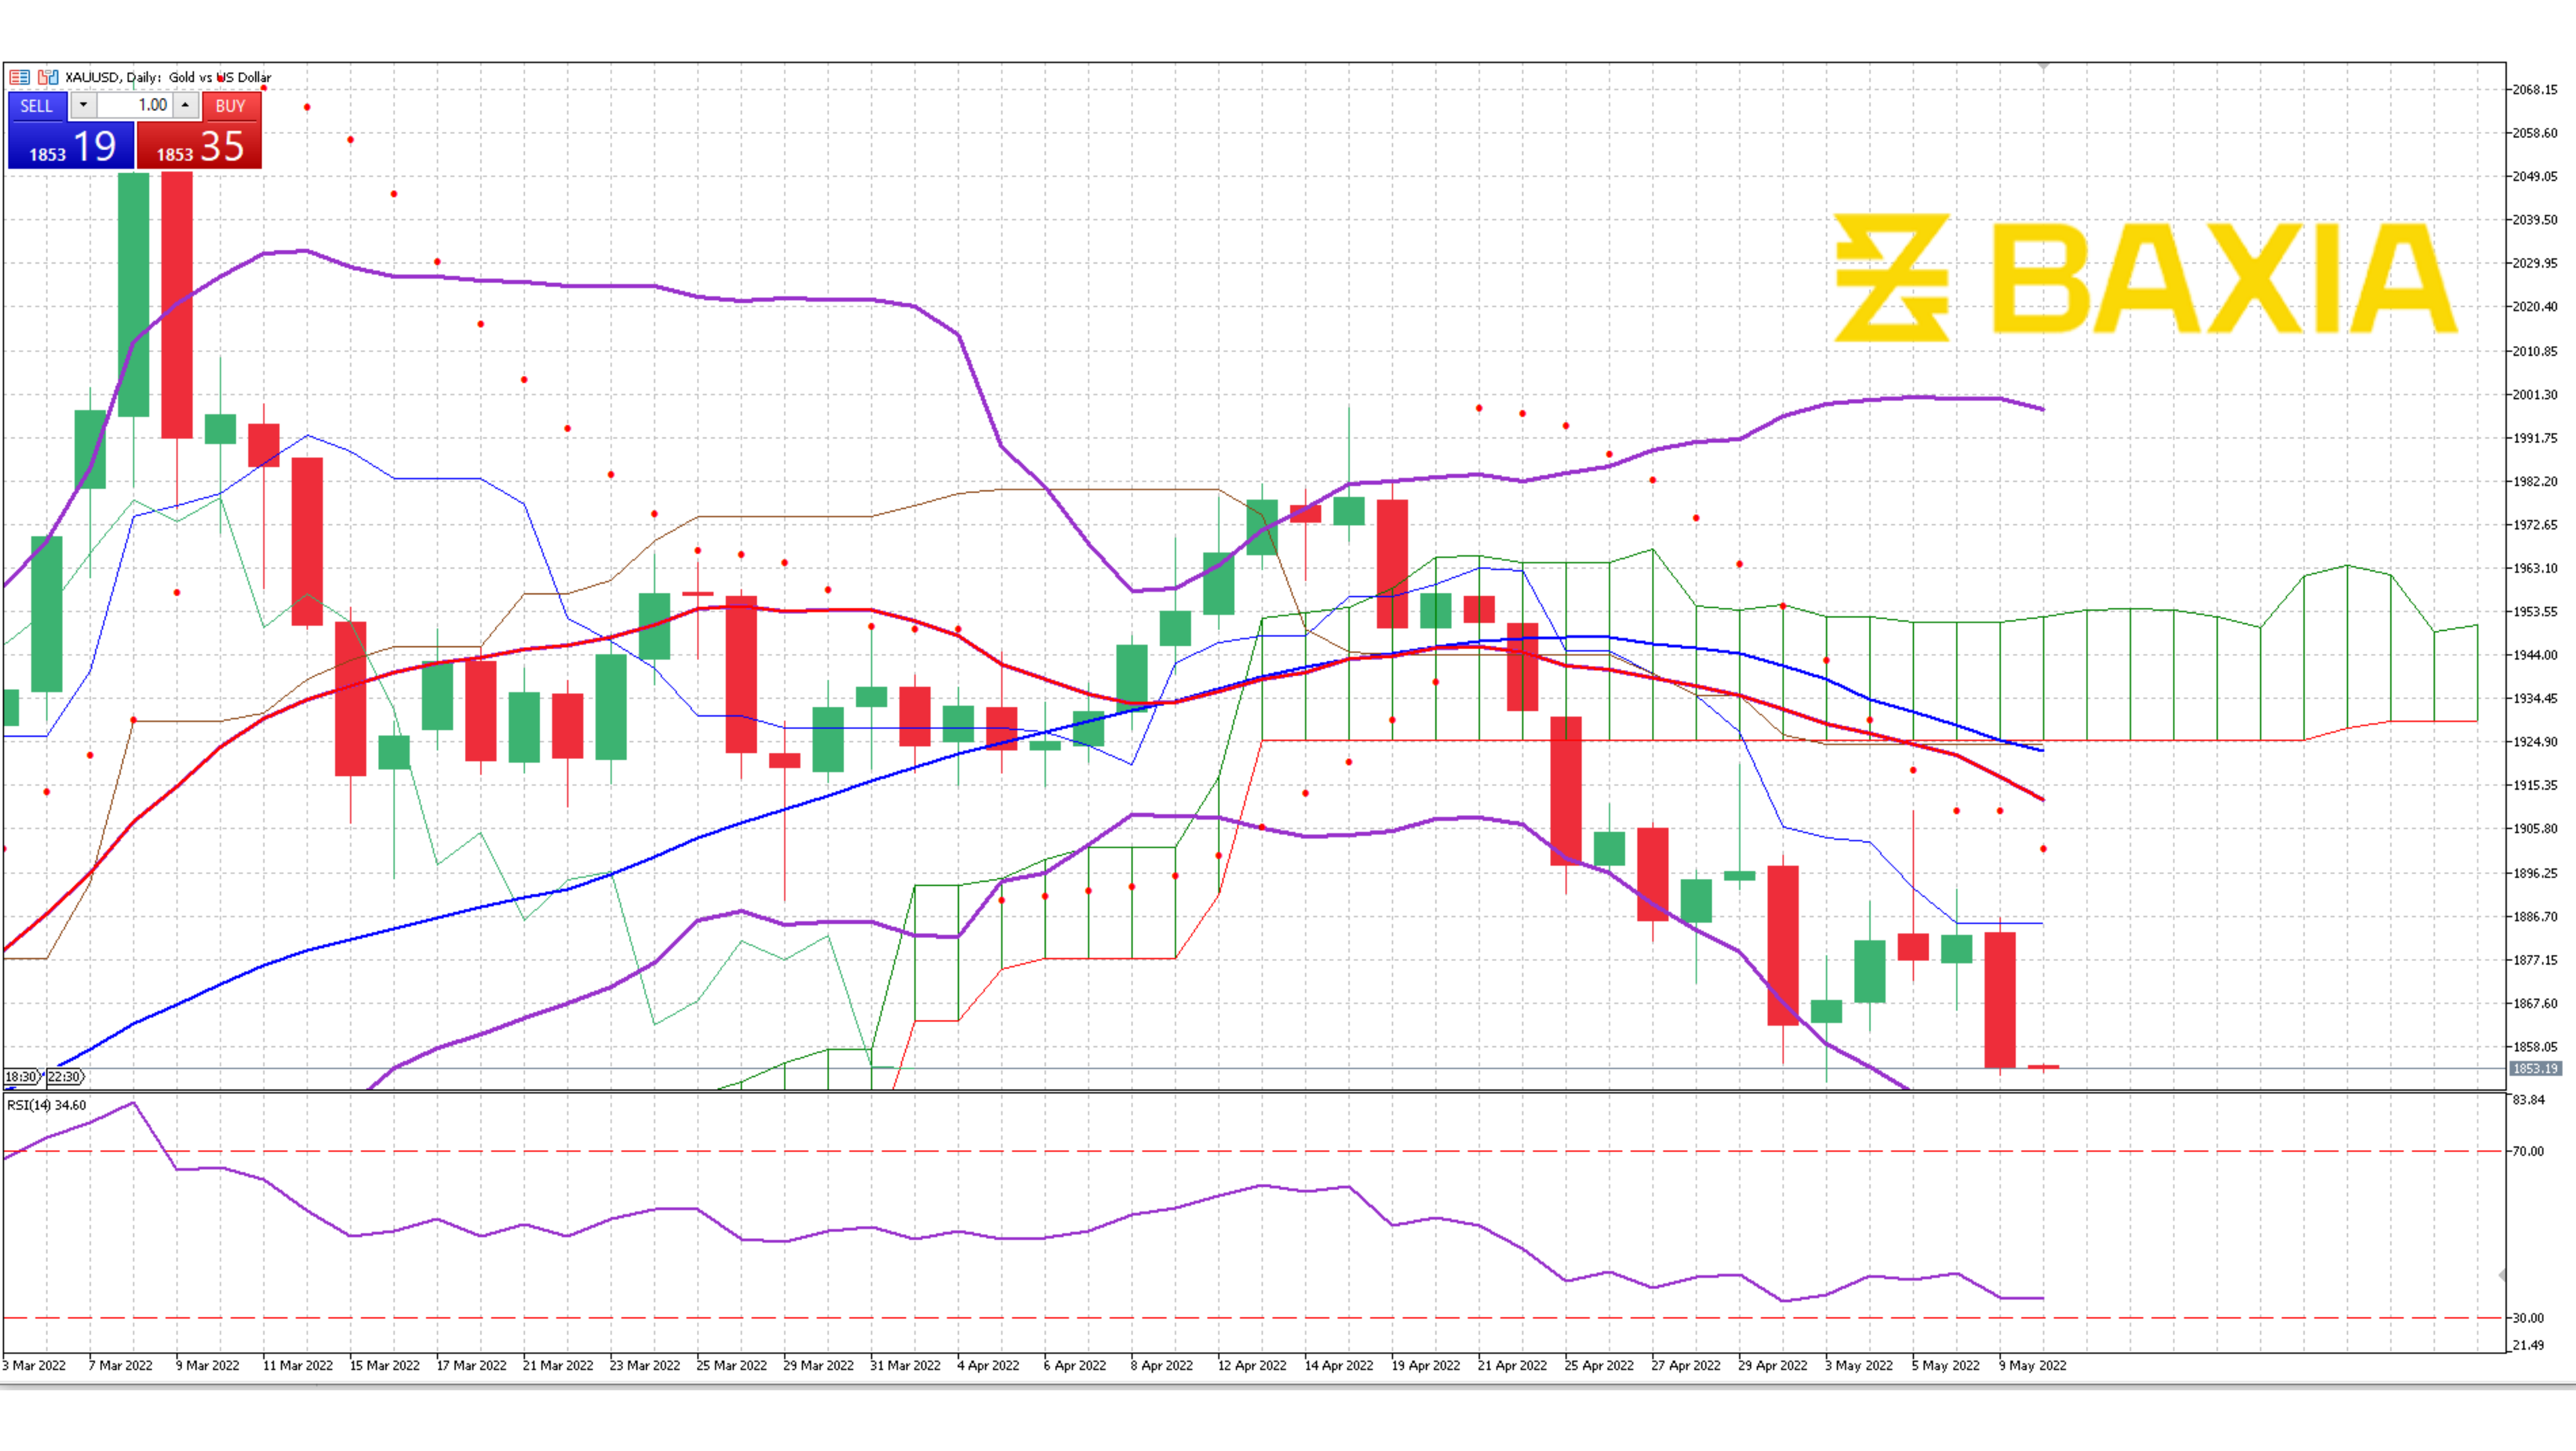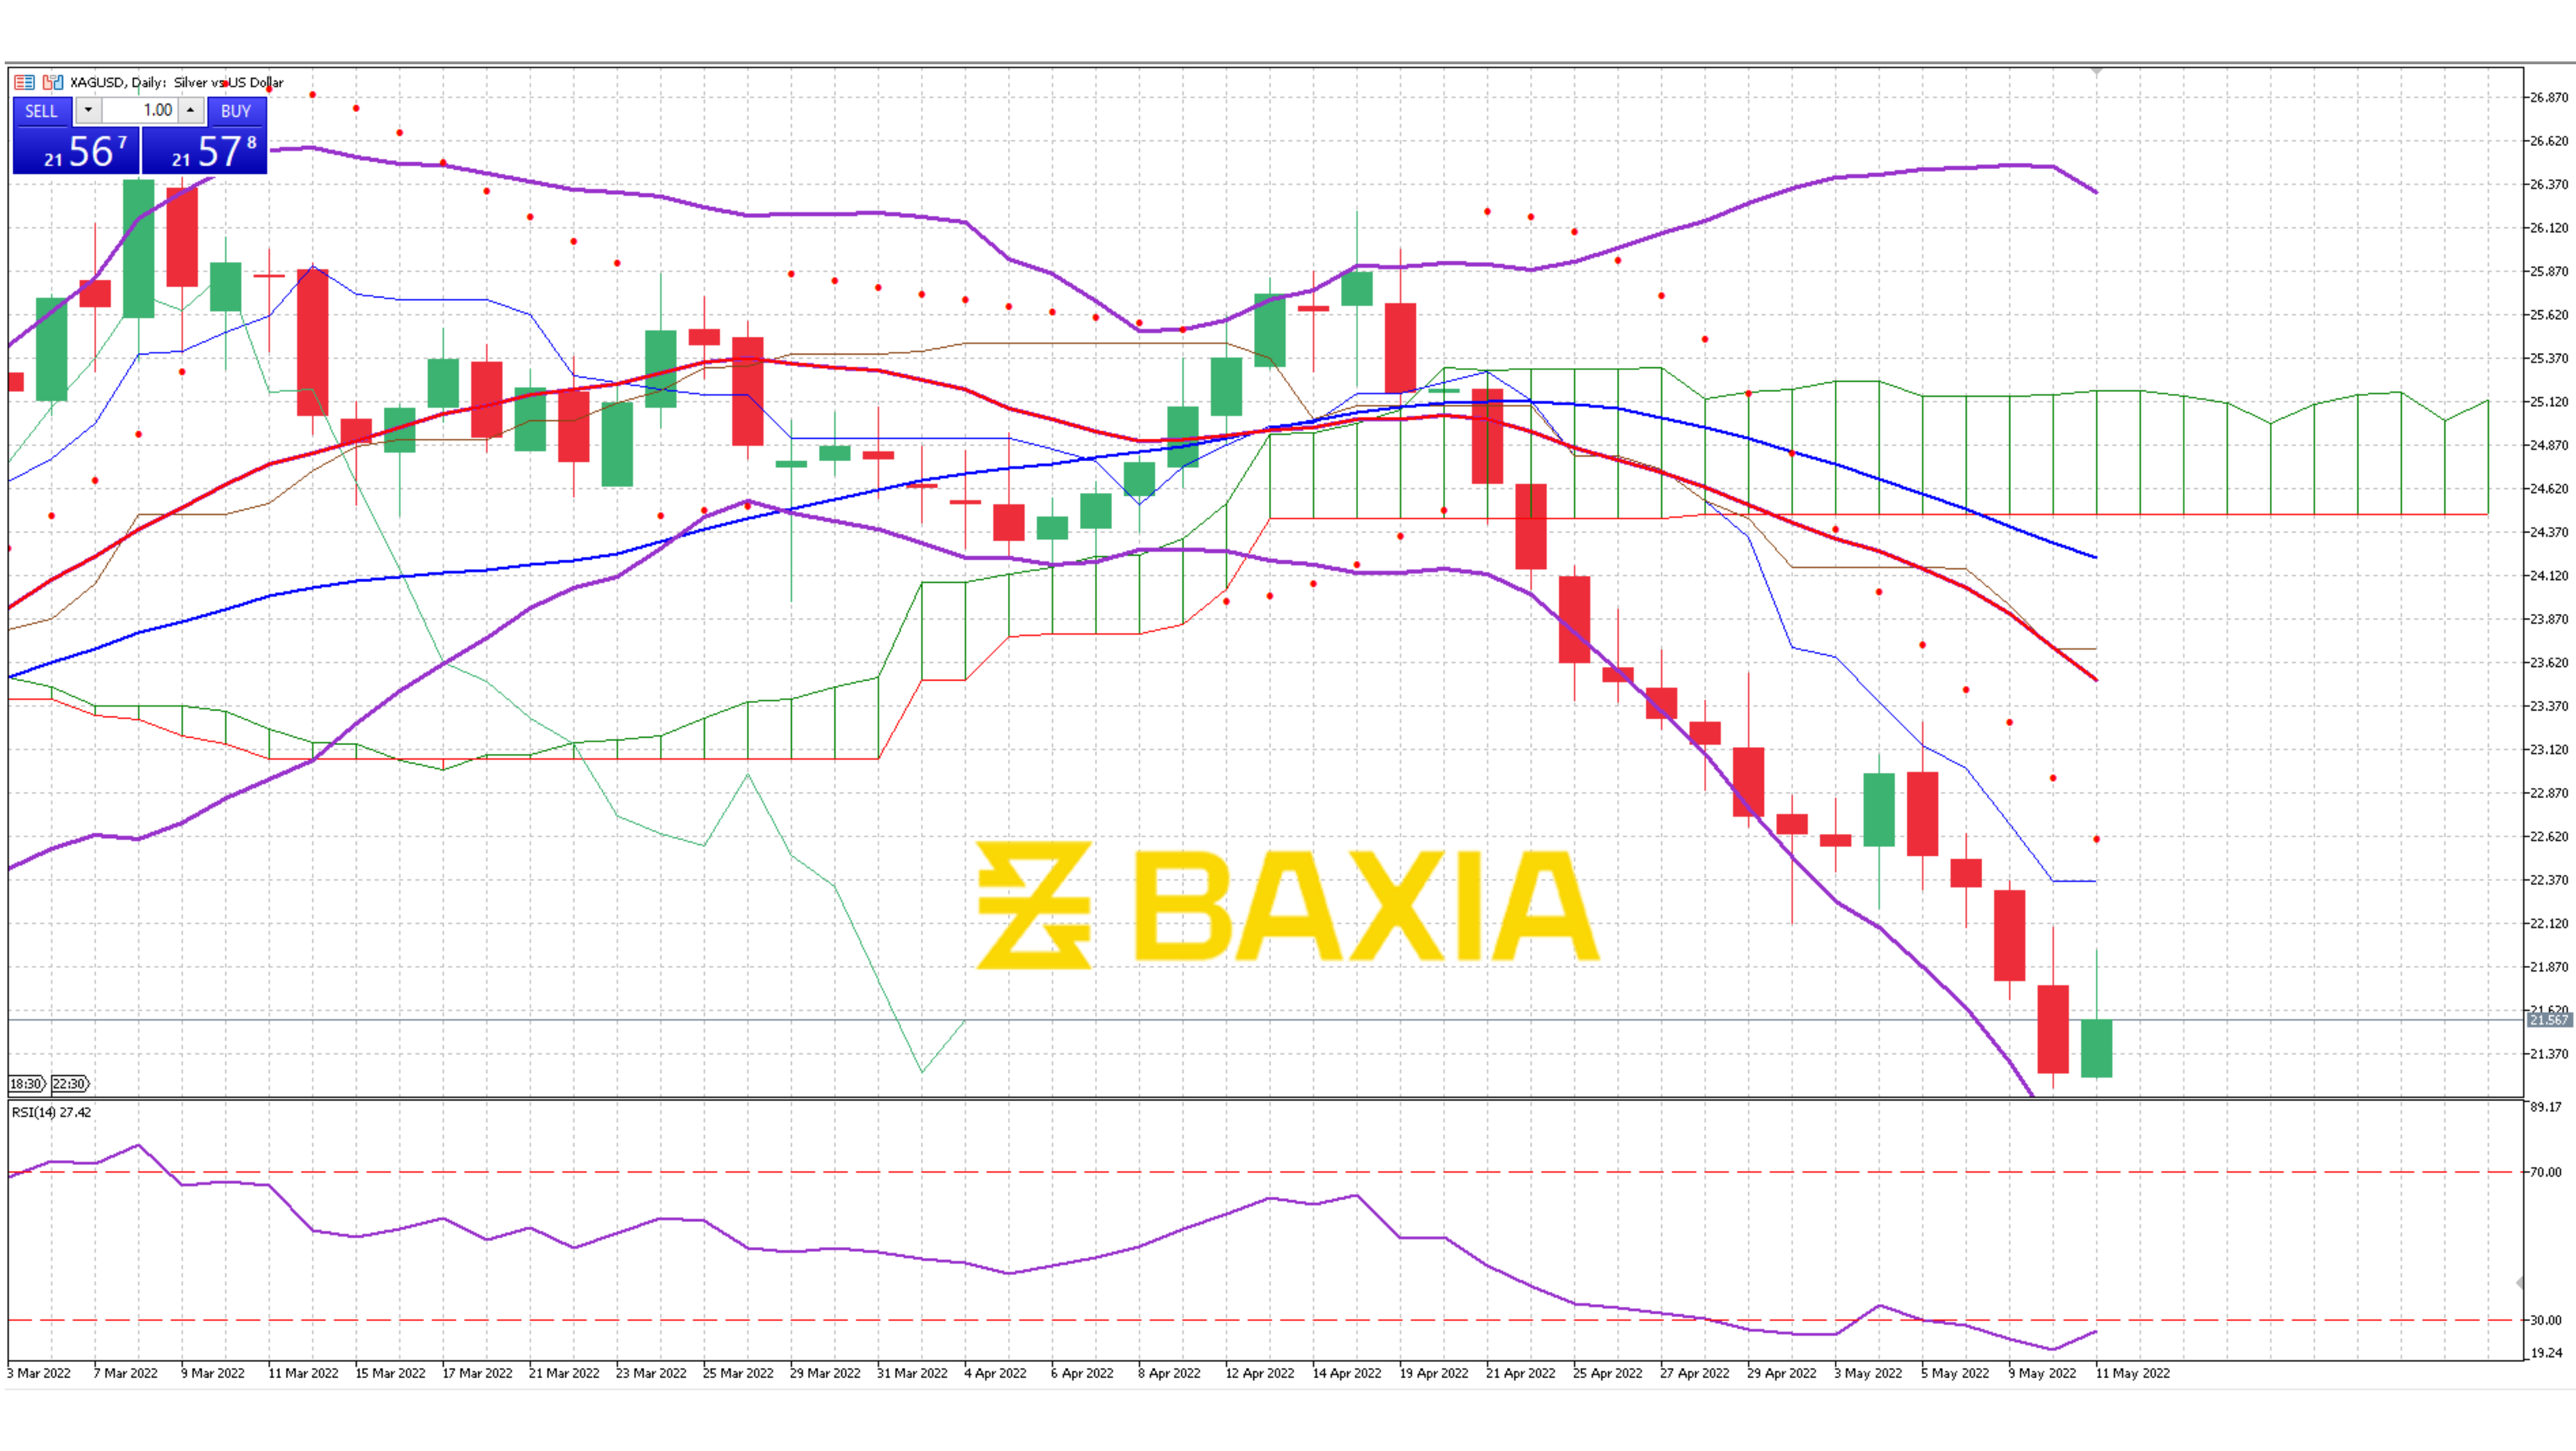

The precious metal is taking a hit and closed with a loss in 4 of the 5 last trading sessions, the pair could find support at $1,890. The short and long-term moving averages crossed a few sessions ago, indicating that the downwards trend should continue.
The Bollinger bands are wide and they are starting to open which often indicates a trend reversal, if the support level is strong enough to hold the price we would likely see the price move upwards in the upcoming sessions. The pair currently trades below the lower band, suggesting that the price is relatively low, which could incentivize investors to open long positions on the precious metal.
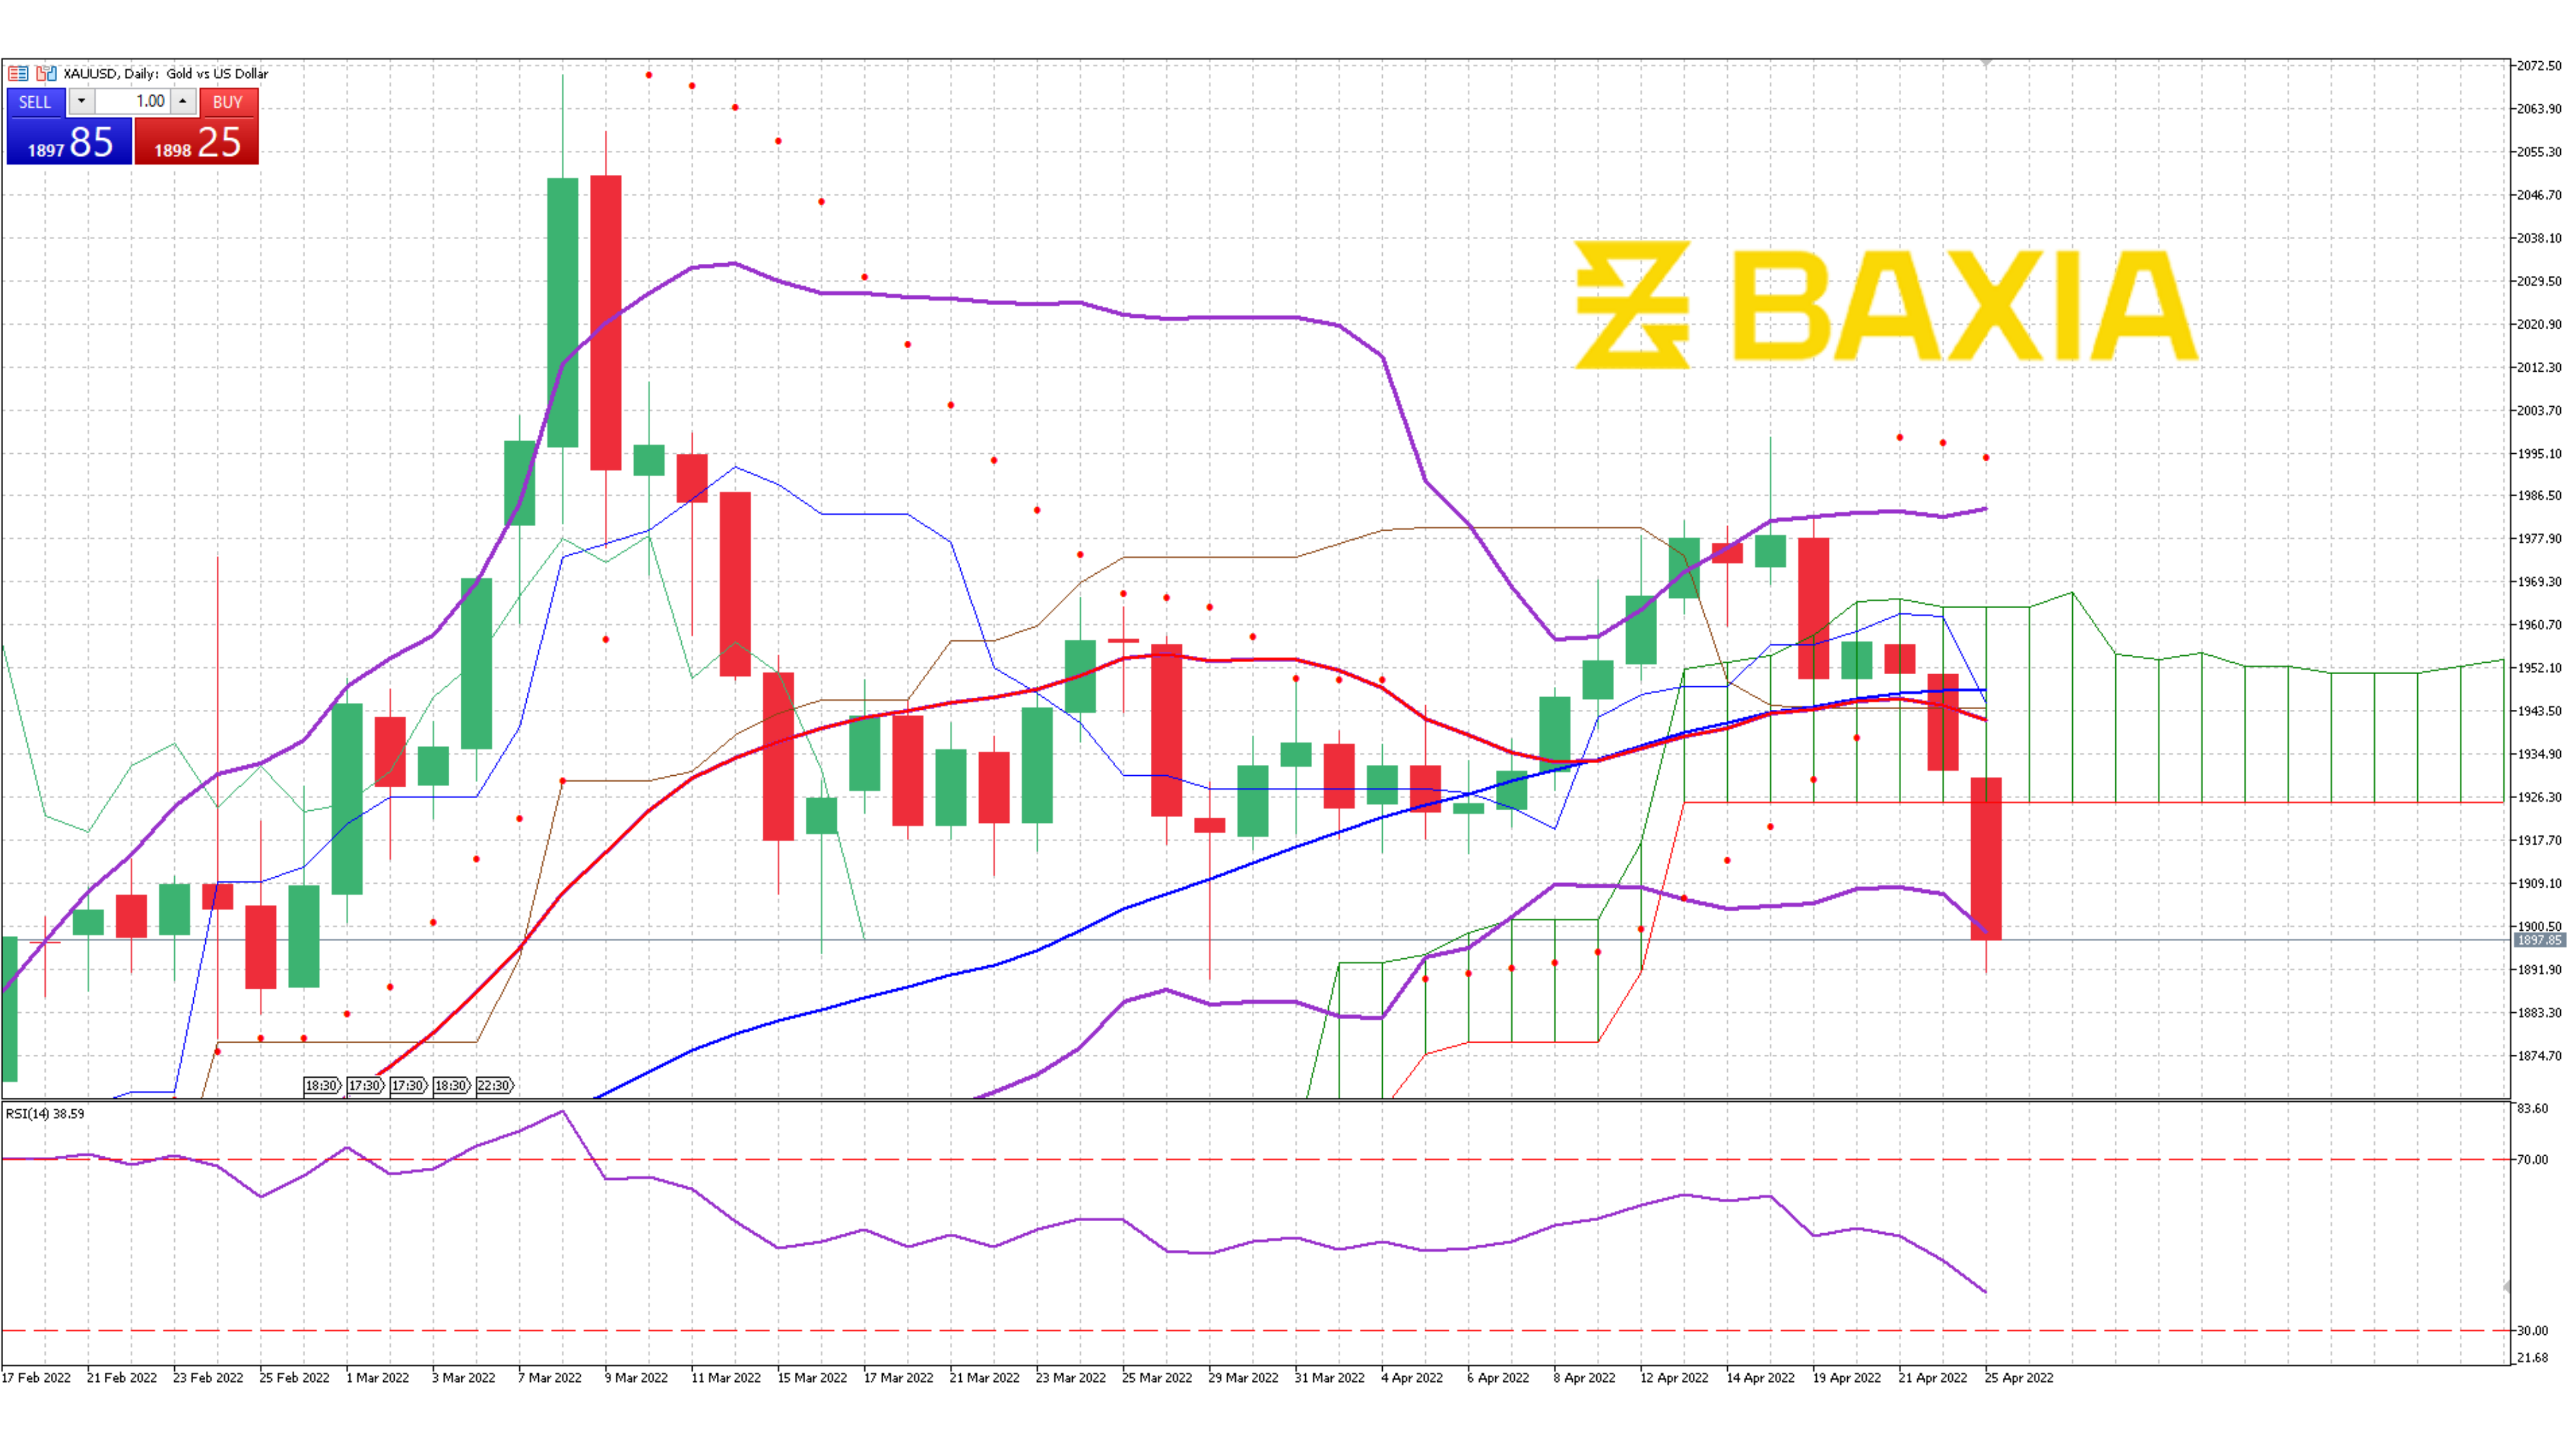
The relative strength index fell to 38% which would allow the pair to continue moving downwards, but if the support holds the fall it will allow gold to aggressively climb in the upcoming trading sessions. Our parabolic SAR indicator suggests that the price will continue to move downwards in the short term.
We love to hear new ideas from traders and want to know what you think!
If you like this topic and want to suggest future topics that you find helpful, let us know by clicking the ‘submit your feedback’ button below.

Trading foreign exchange on margin carries a high level of risk, and may not be suitable for all investors. Before deciding to trade foreign exchange you should carefully consider your investment objectives, level of experience, and risk appetite.
Nothing contained in this website should be construed as investment advice. Any reference to an investment's past or potential performance is not, and should not be construed as, a recommendation or as a guarantee of any specific outcome or profit.