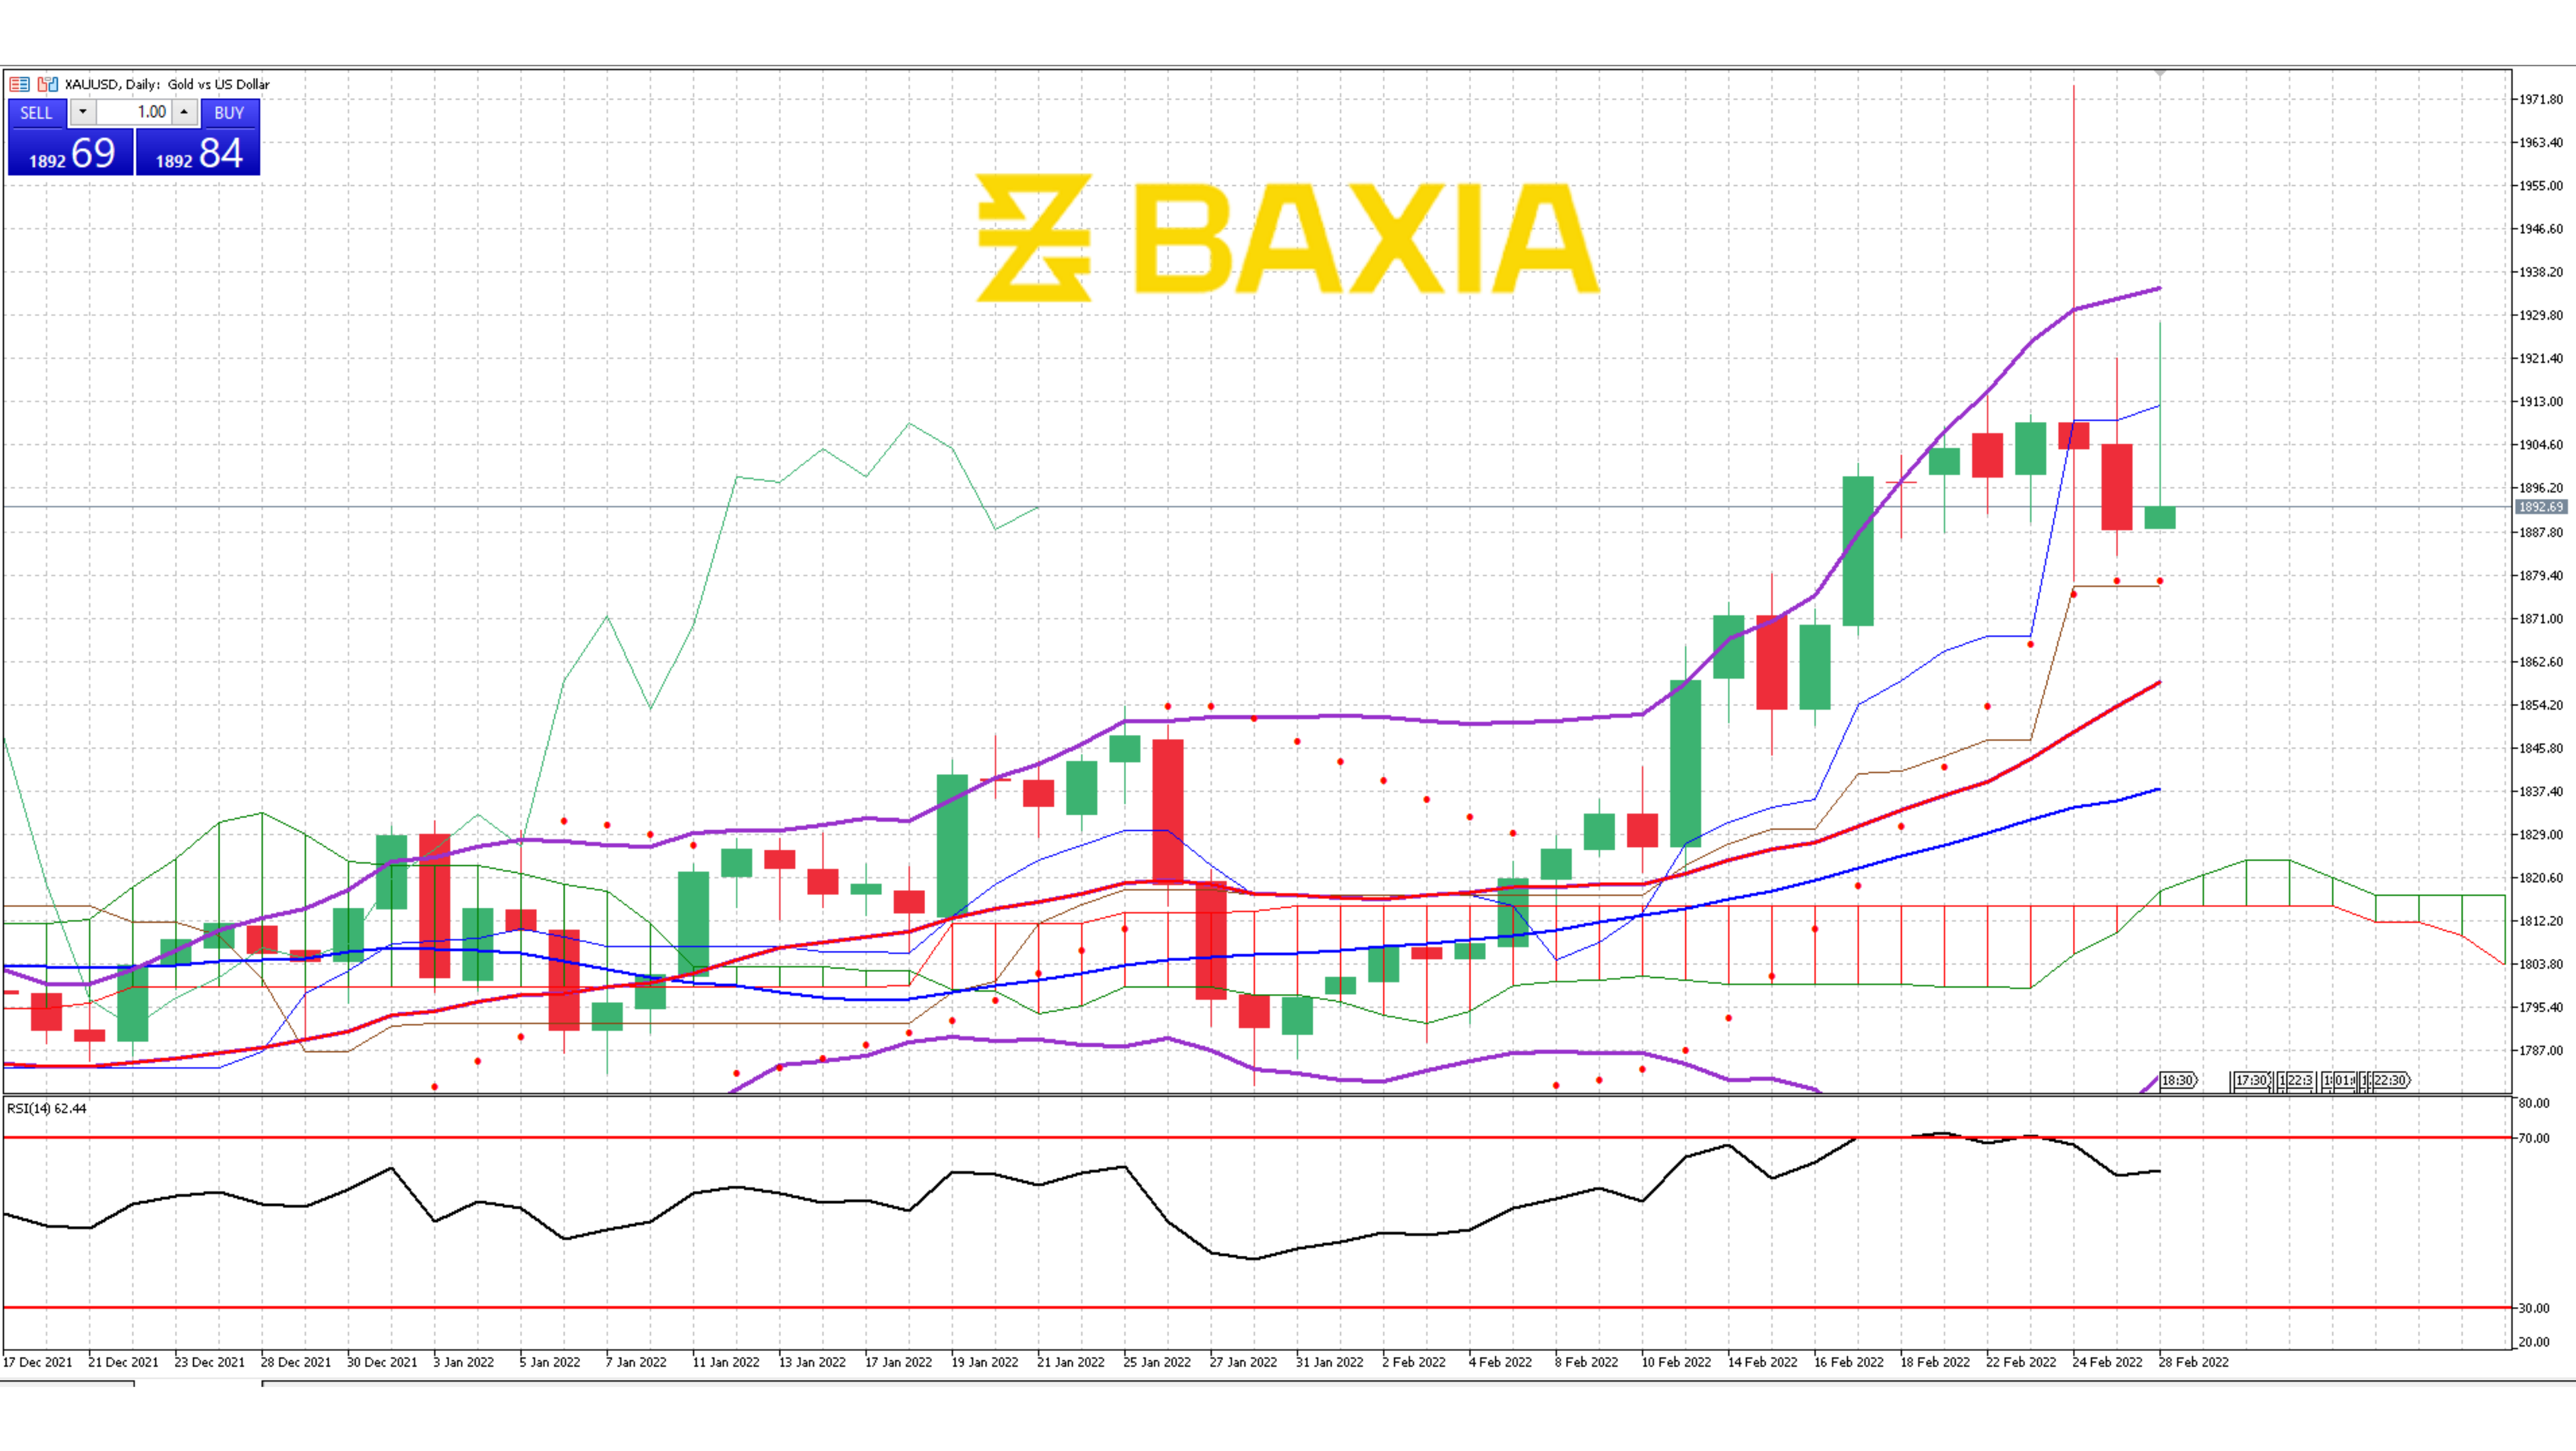

The precious metal broke the support level on our 38.2% Fibonacci retracement at $1,949 and is getting closer to the next support level at $1,911. The price is trading below the short-term moving average, indicating that the price could drop more in the short term.
The Bollinger bands are closing up but they are still wide enough to expect high volatility, the pair trades in between the bands, suggesting that the metal is at a fair price, it looks like Gold could start a consolidation period at current price levels but we would need to wait for confirmation in the upcoming trading sessions.
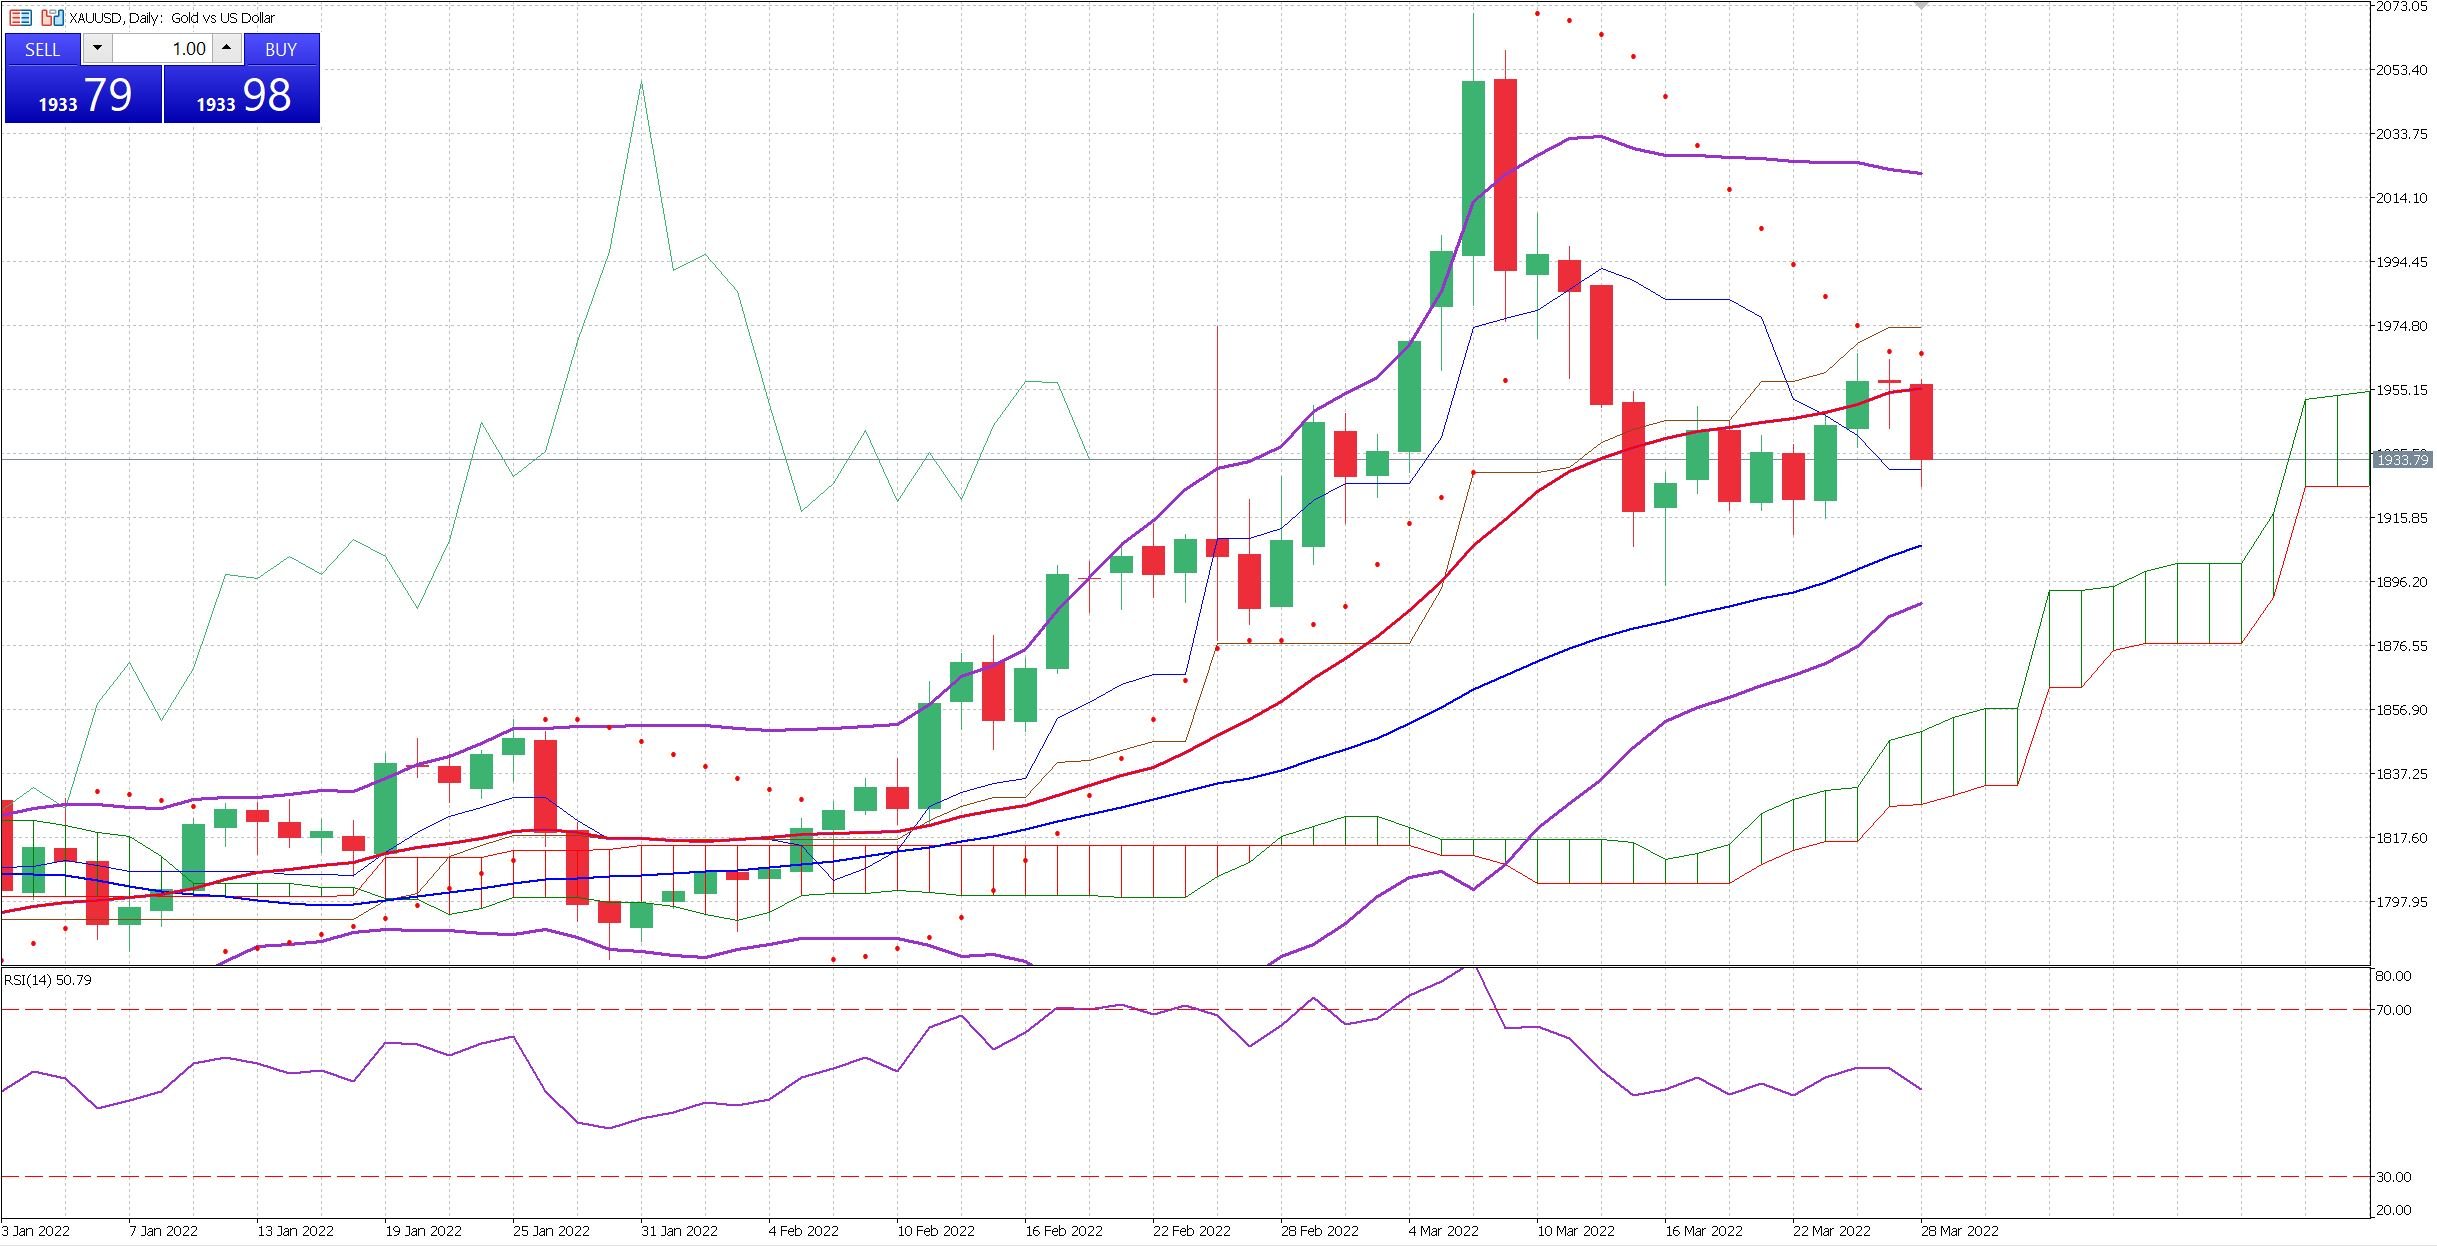
The relative strength index is at 51% which would allow the pair to move in either direction for the time being. Our parabolic SAR indicator suggests that the price will continue the downtrend it started in March 9th.
We love to hear new ideas from traders and want to know what you think!
If you like this topic and want to suggest future topics that you find helpful, let us know by clicking the ‘submit your feedback’ button below.

Trading foreign exchange on margin carries a high level of risk, and may not be suitable for all investors. Before deciding to trade foreign exchange you should carefully consider your investment objectives, level of experience, and risk appetite.
Nothing contained in this website should be construed as investment advice. Any reference to an investment's past or potential performance is not, and should not be construed as, a recommendation or as a guarantee of any specific outcome or profit.