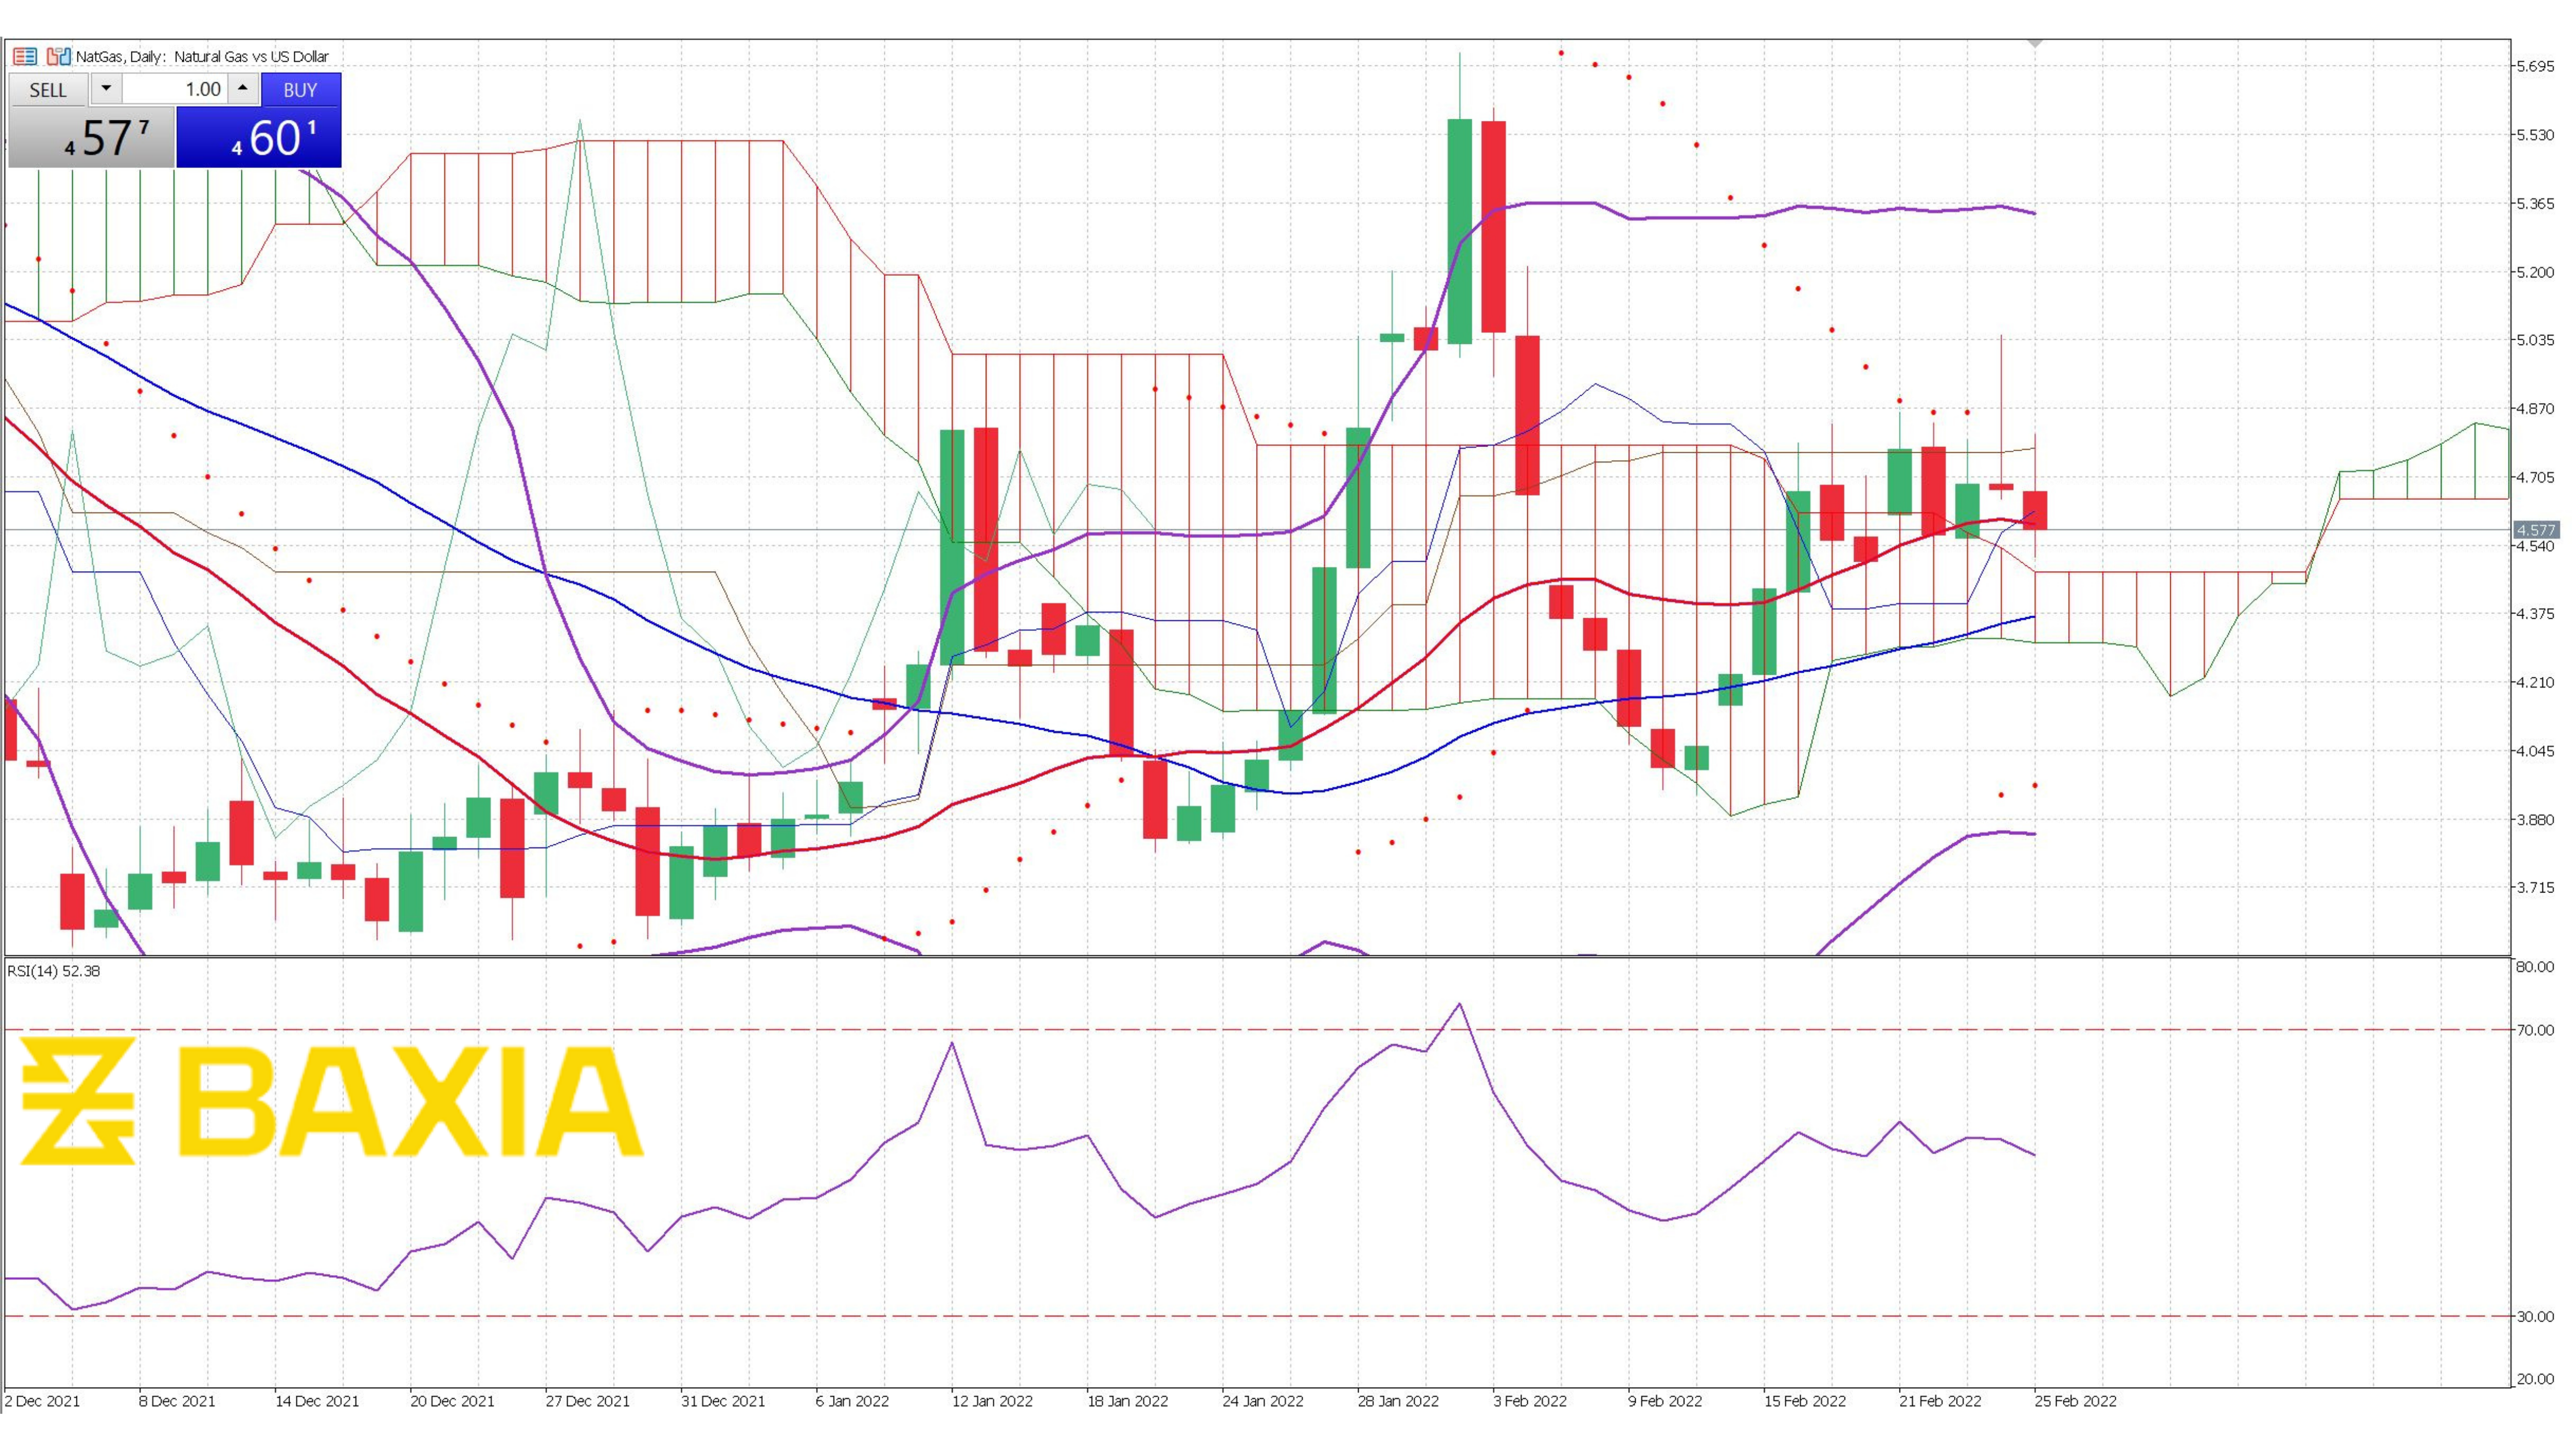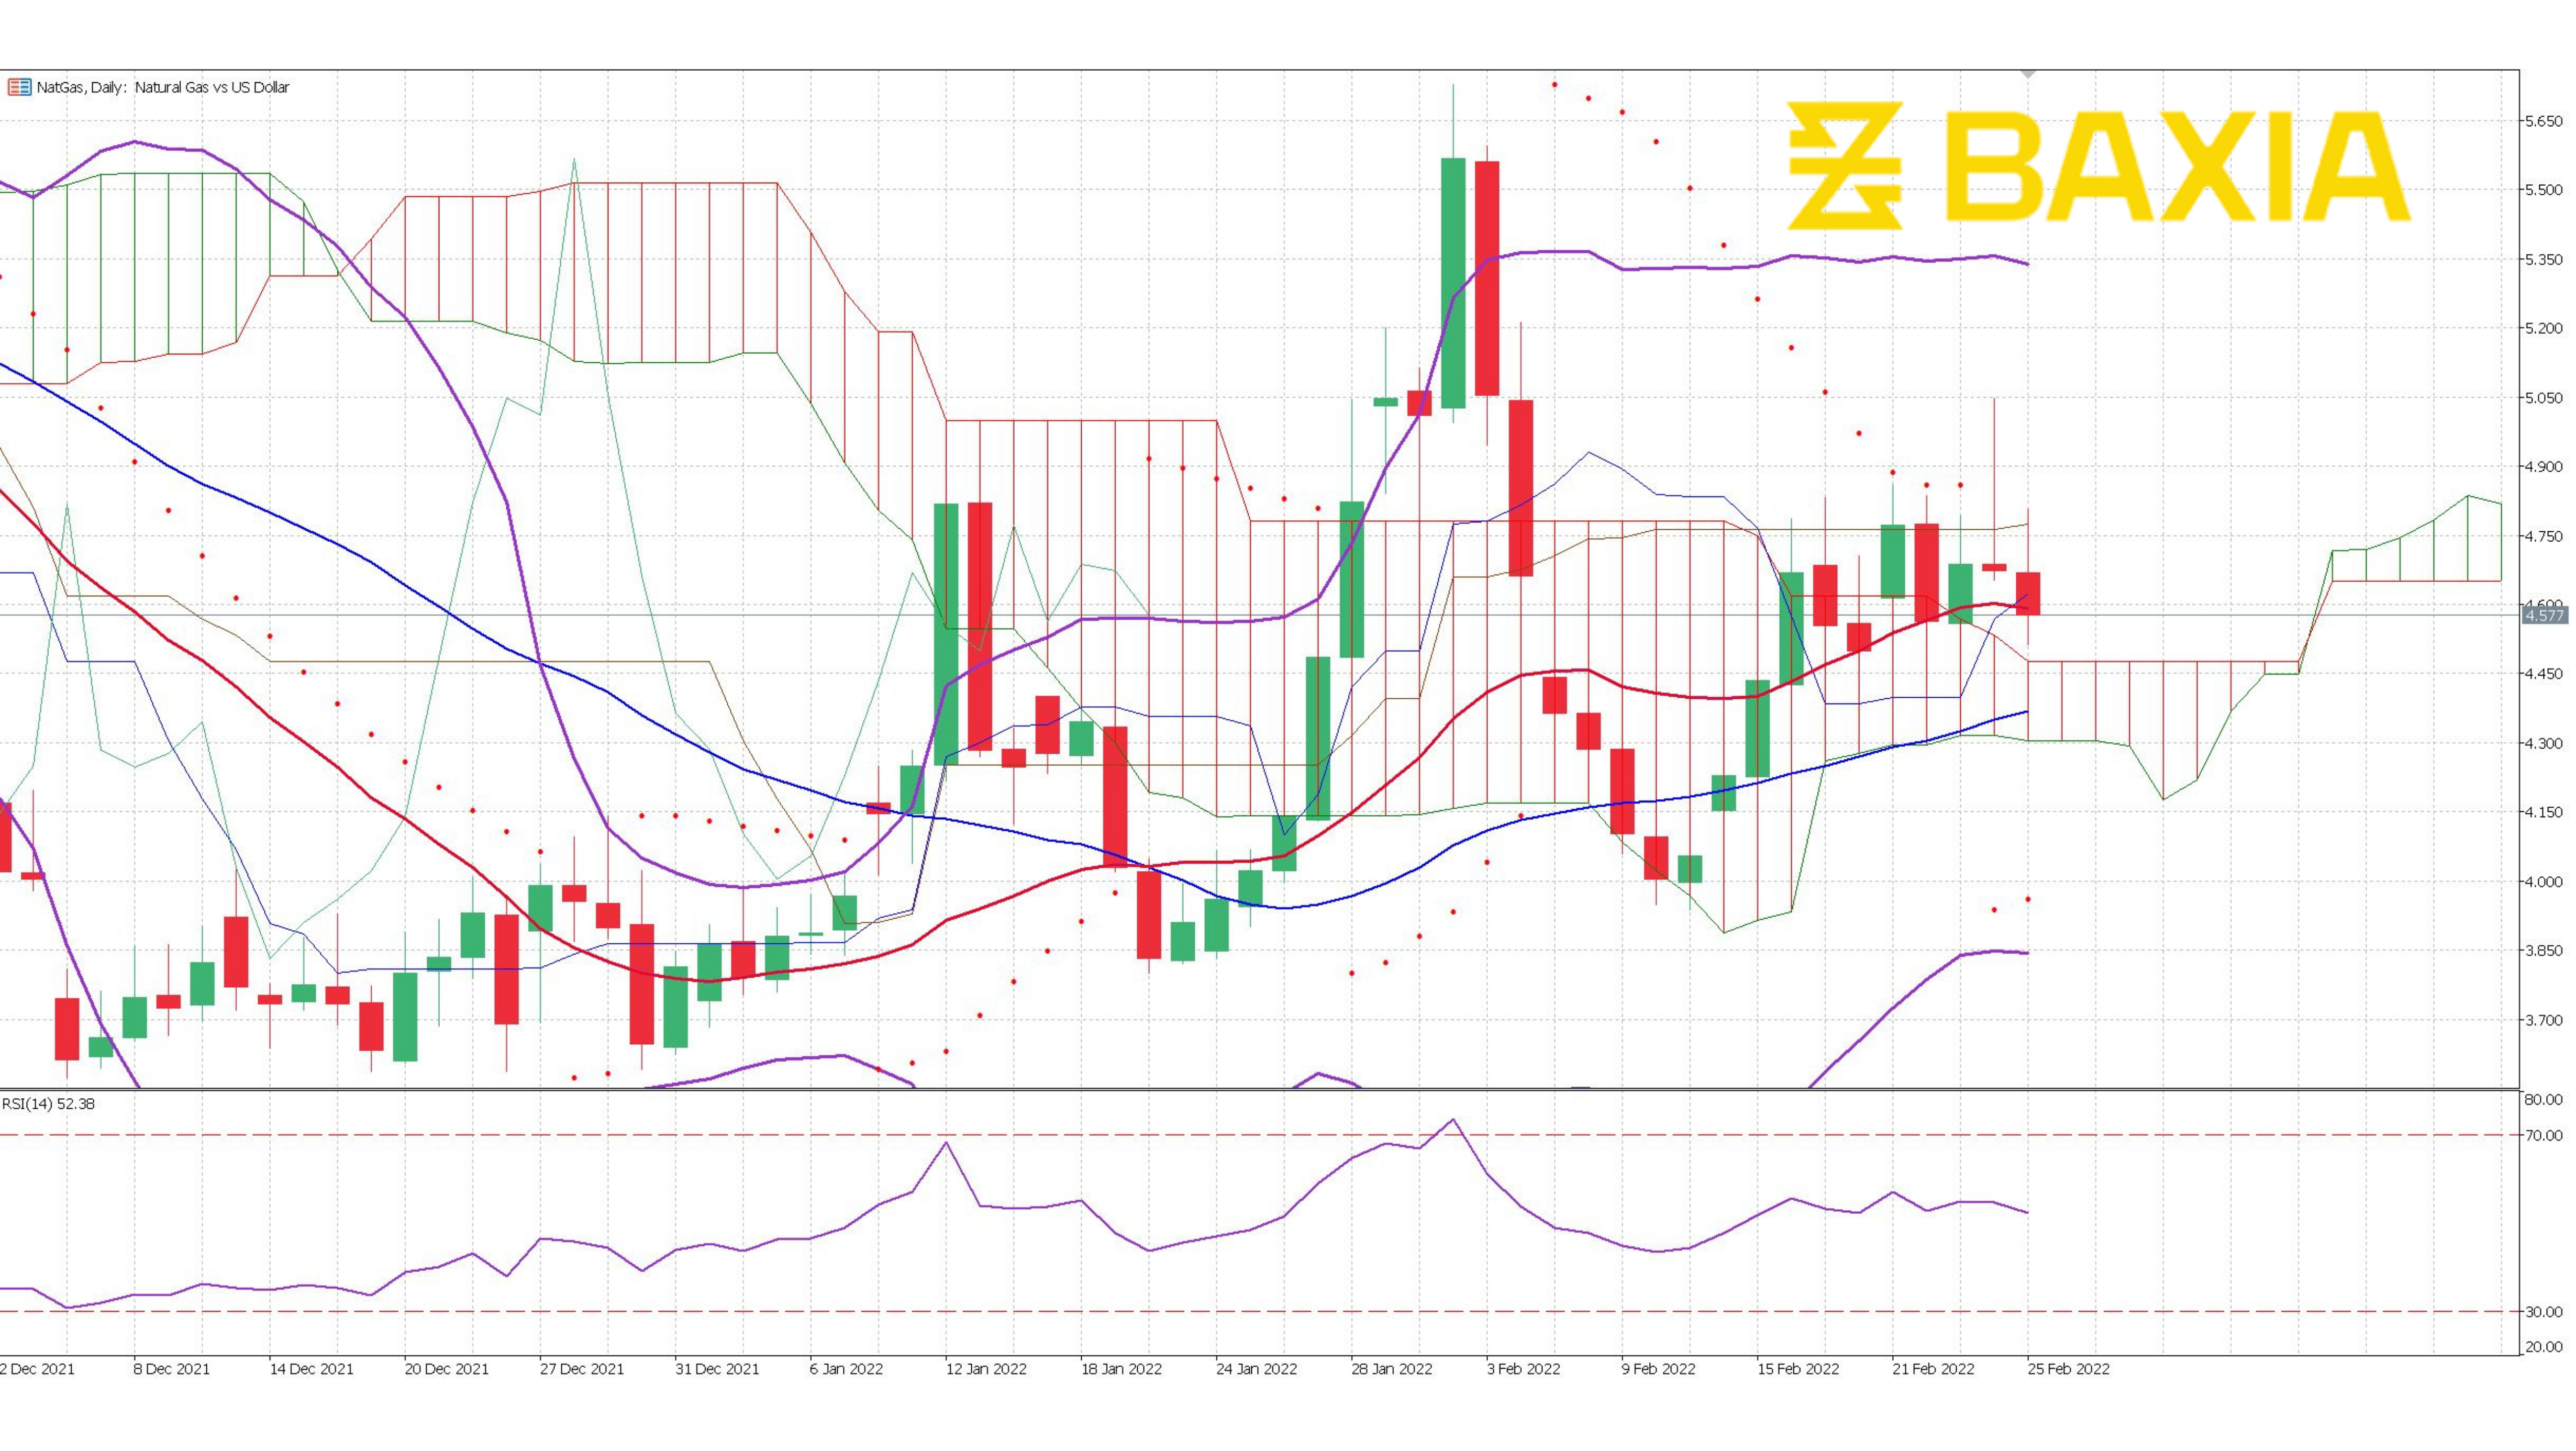

The energy commodity could continue trading within a 9% range, between the 23.6% and 50% Fibonacci retracements at $4.914 and $4.470 respectively. There could be a good opportunity here before a breakout happens.
The Bollinger bands are closing up symmetrically which often indicates lower volatility in the markets for the short term, the pair trades in between the bands, and the price is considered relatively fair. The price can find support at the 4.668 level which would indicate an upward trend that could take the price back to the $4.91 level. In the event that the support is not strong then we would expect a downward trend that could take the price close to the $4.47 levels
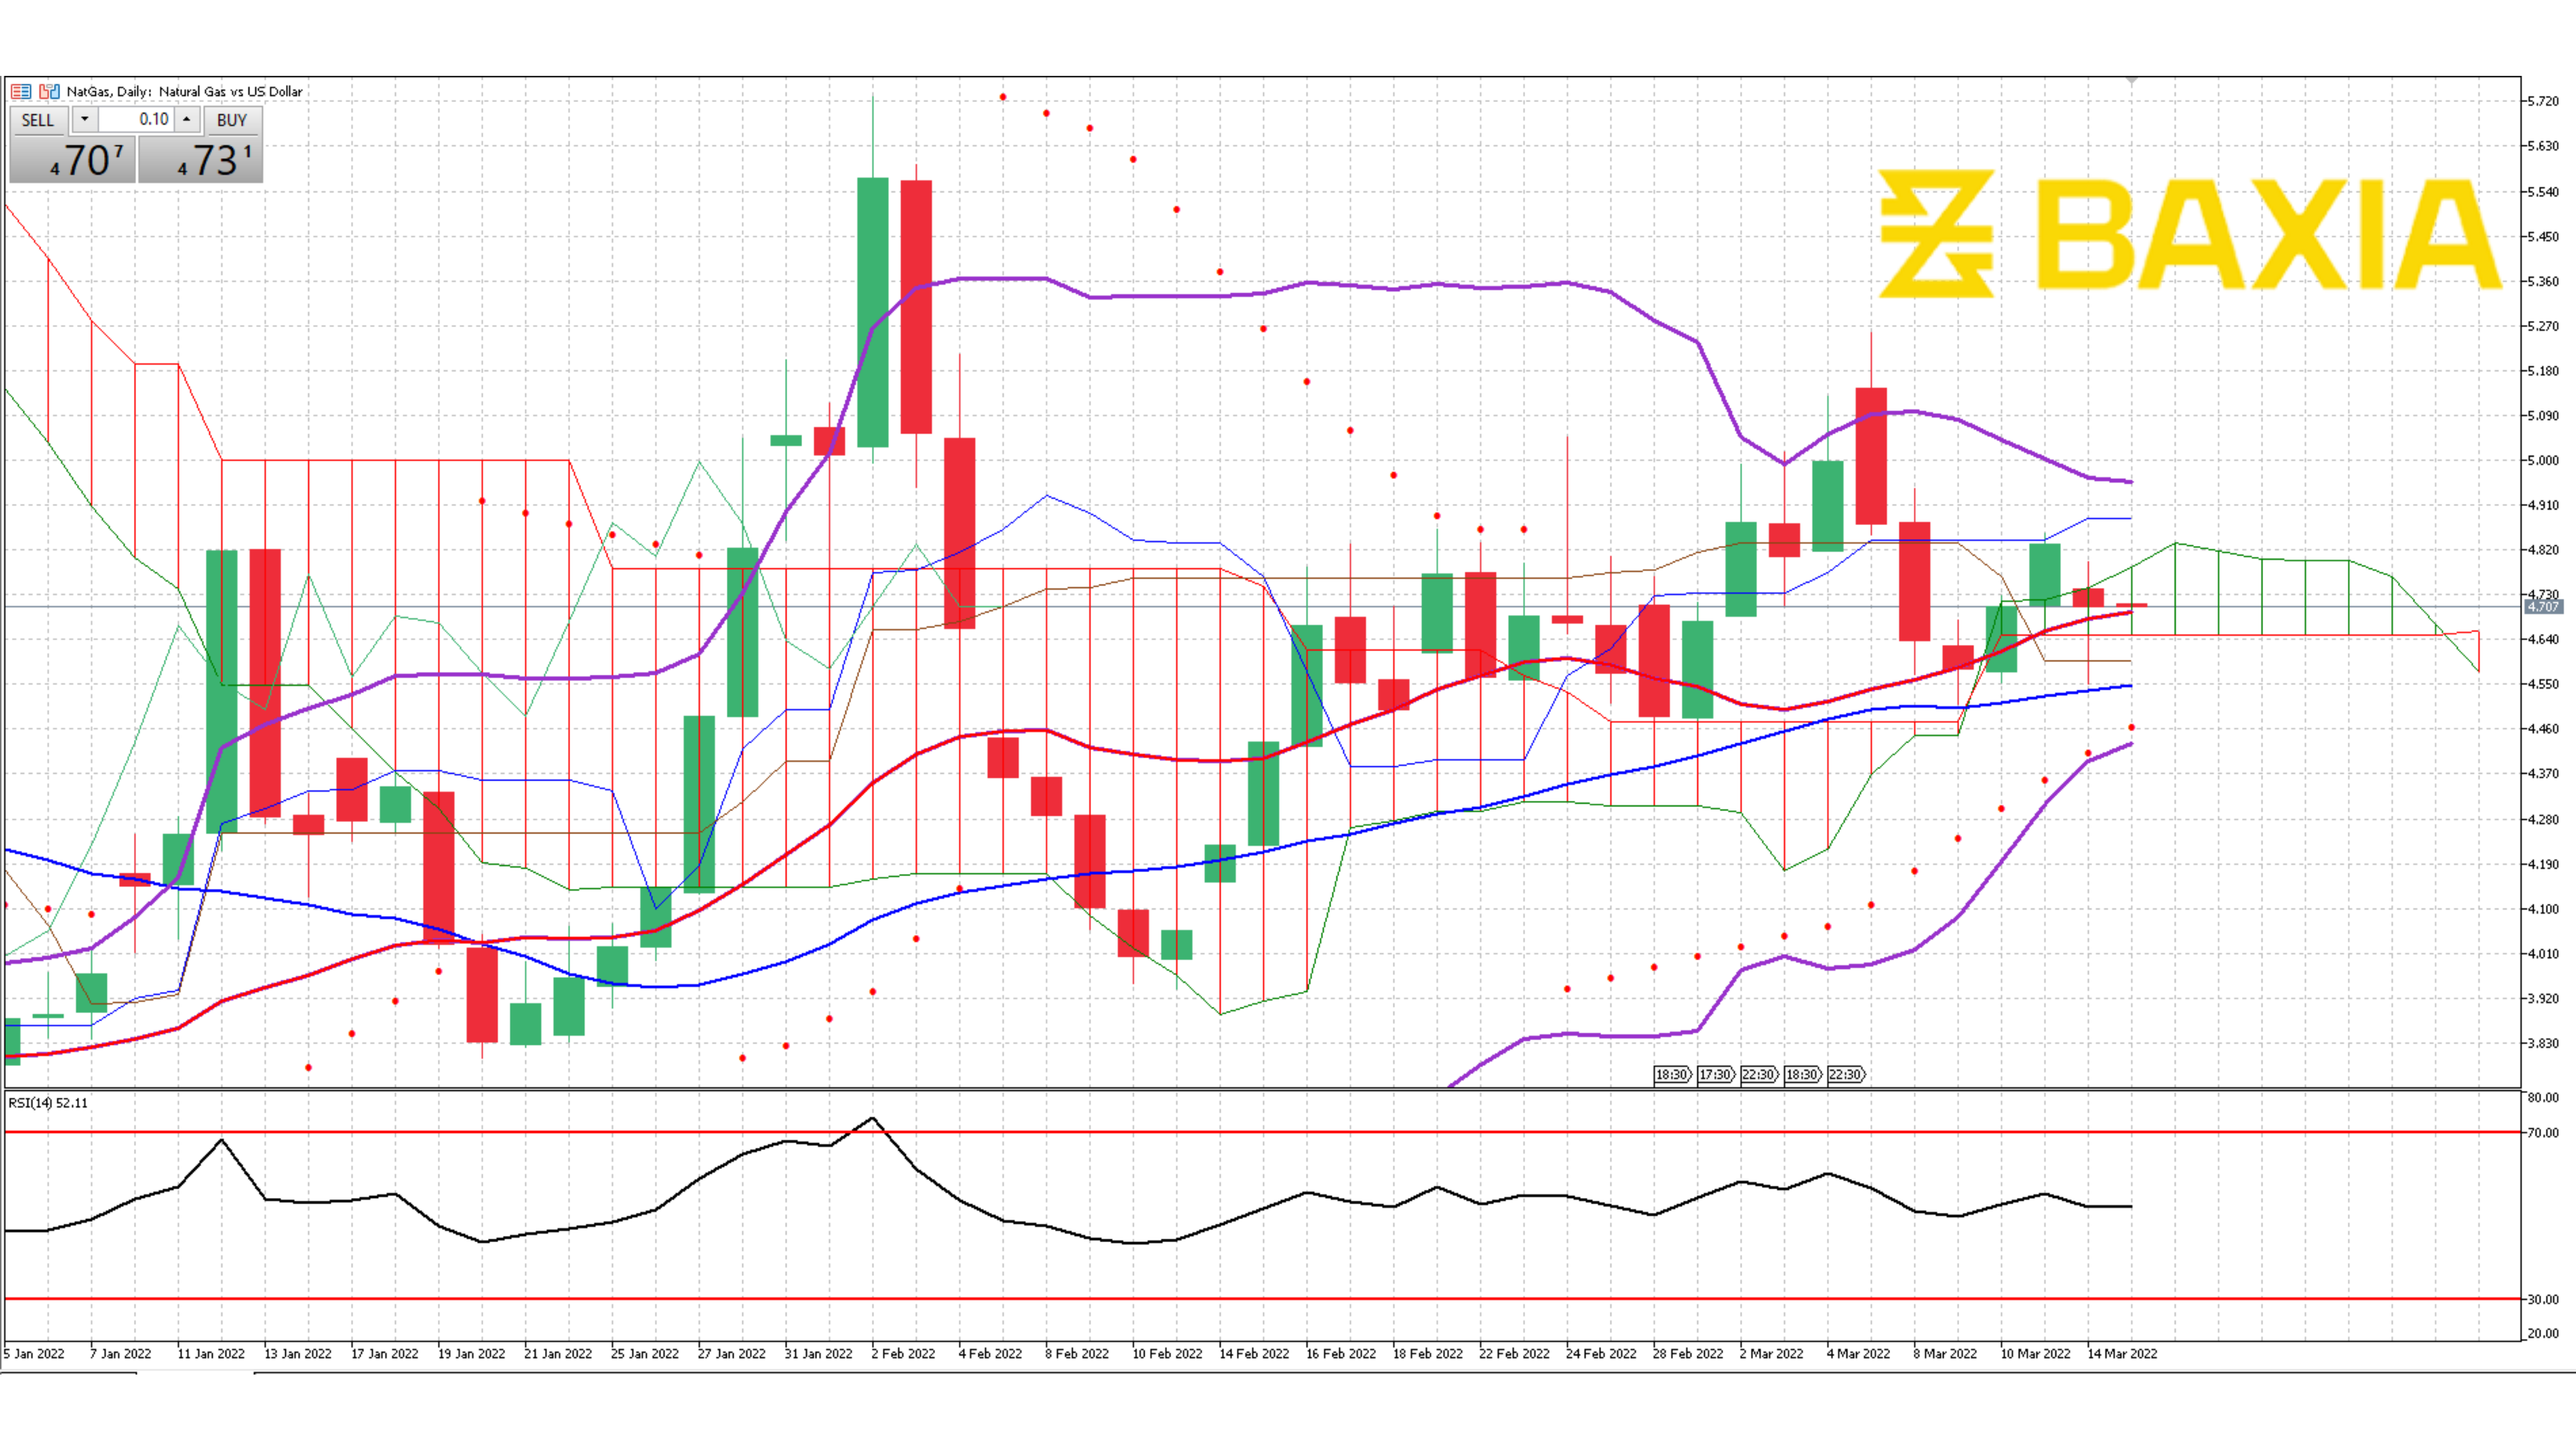
The relative strength index is at 55% which has been very stable for the last few sessions, this will could allow the pair to break in either direction in the upcoming sessions. The price is still trading above the short and long-term moving averages which indicates that the upwards trend could continue. But the pair is on a two-day losing streak.
We love to hear new ideas from traders and want to know what you think!
If you like this topic and want to suggest future topics that you find helpful, let us know by clicking the ‘submit your feedback’ button below.

Trading foreign exchange on margin carries a high level of risk, and may not be suitable for all investors. Before deciding to trade foreign exchange you should carefully consider your investment objectives, level of experience, and risk appetite.
Nothing contained in this website should be construed as investment advice. Any reference to an investment's past or potential performance is not, and should not be construed as, a recommendation or as a guarantee of any specific outcome or profit.