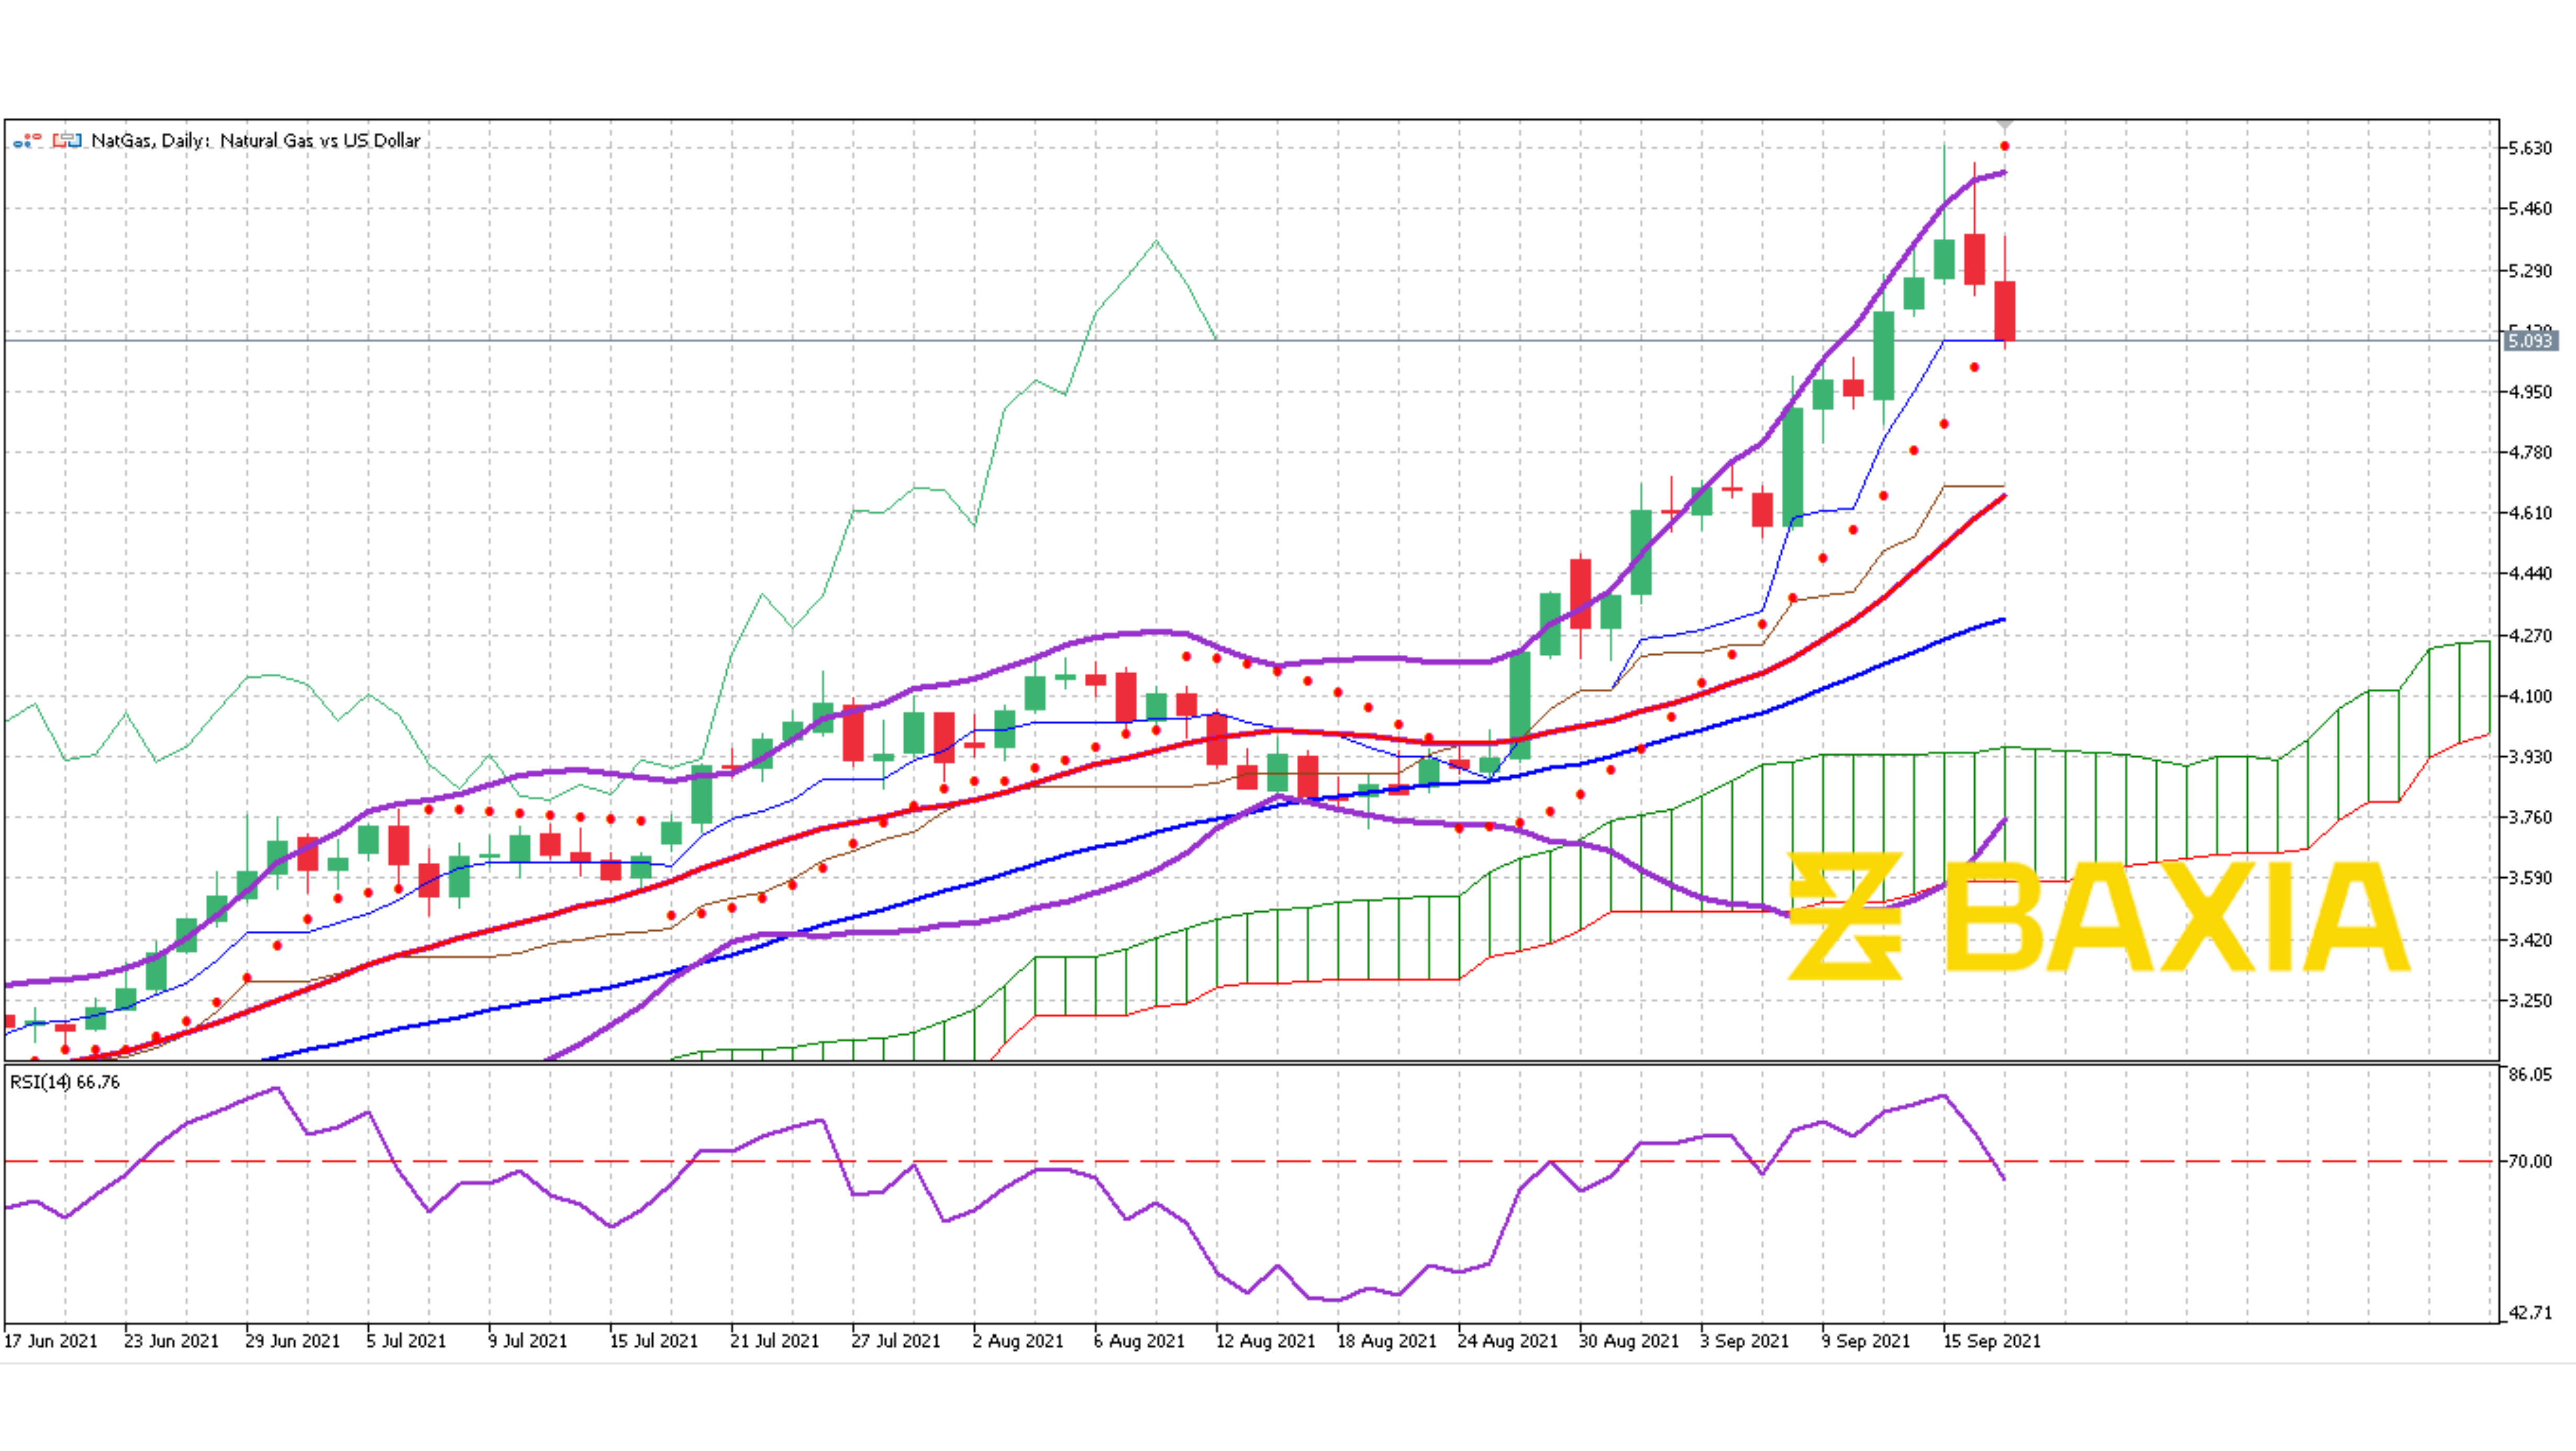

The energy commodity reached a new high since November of 2021, the price trades above our short and long-term moving average, suggesting that the price will continue to move upwards; however, it might be too high and we could see a pullback soon.
The Bollinger bands are wide and continue to open up, particularly the upper band, which often indicates that the uptrend would continue; however, the pair trades above this band, suggesting that the price is relatively high. Investors might see this as an opportunity to place a short trade.
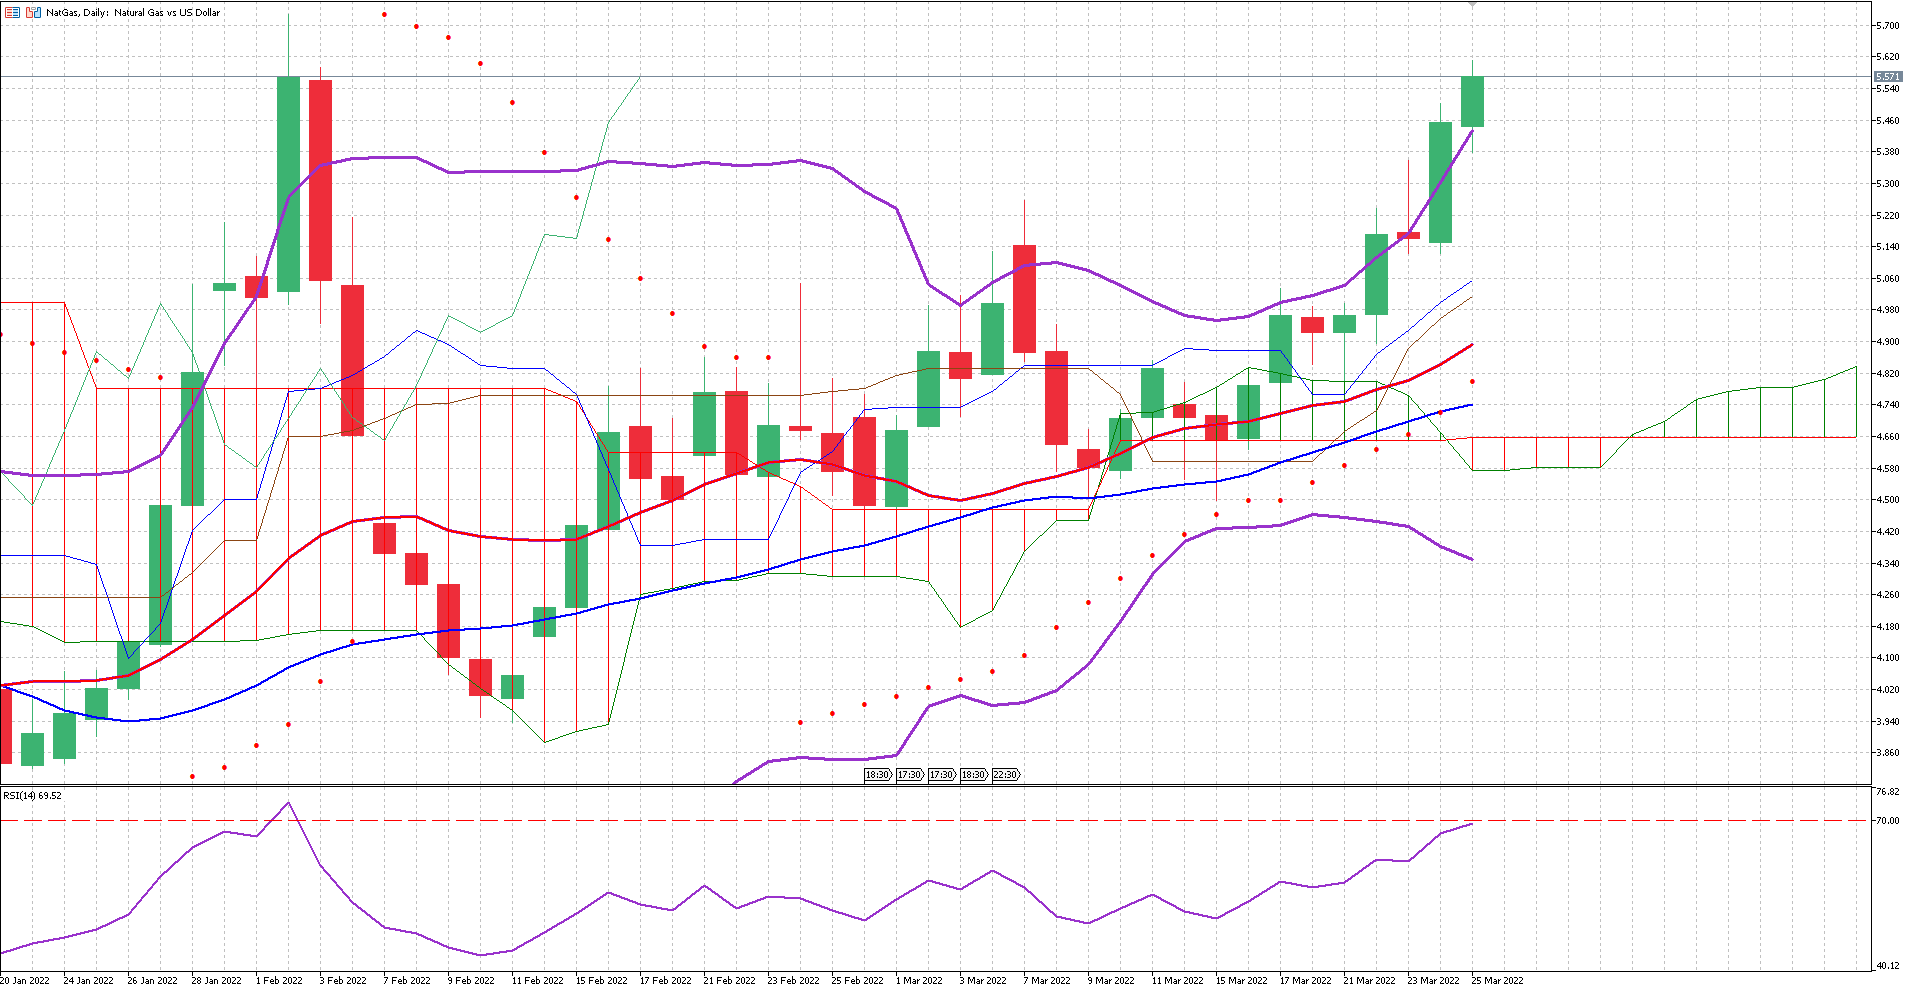
The relative strength index is overbought at 72% which could push traders to close their long positions with a profit, which would potentially cause the price to retrace, the pair has support at $5.150 on our 23.6% Fibonacci retracement. Our parabolic SAR indicator suggests that the price will continue to move up, however, this is a lagging indicator.
We love to hear new ideas from traders and want to know what you think!
If you like this topic and want to suggest future topics that you find helpful, let us know by clicking the ‘submit your feedback’ button below.

Trading foreign exchange on margin carries a high level of risk, and may not be suitable for all investors. Before deciding to trade foreign exchange you should carefully consider your investment objectives, level of experience, and risk appetite.
Nothing contained in this website should be construed as investment advice. Any reference to an investment's past or potential performance is not, and should not be construed as, a recommendation or as a guarantee of any specific outcome or profit.