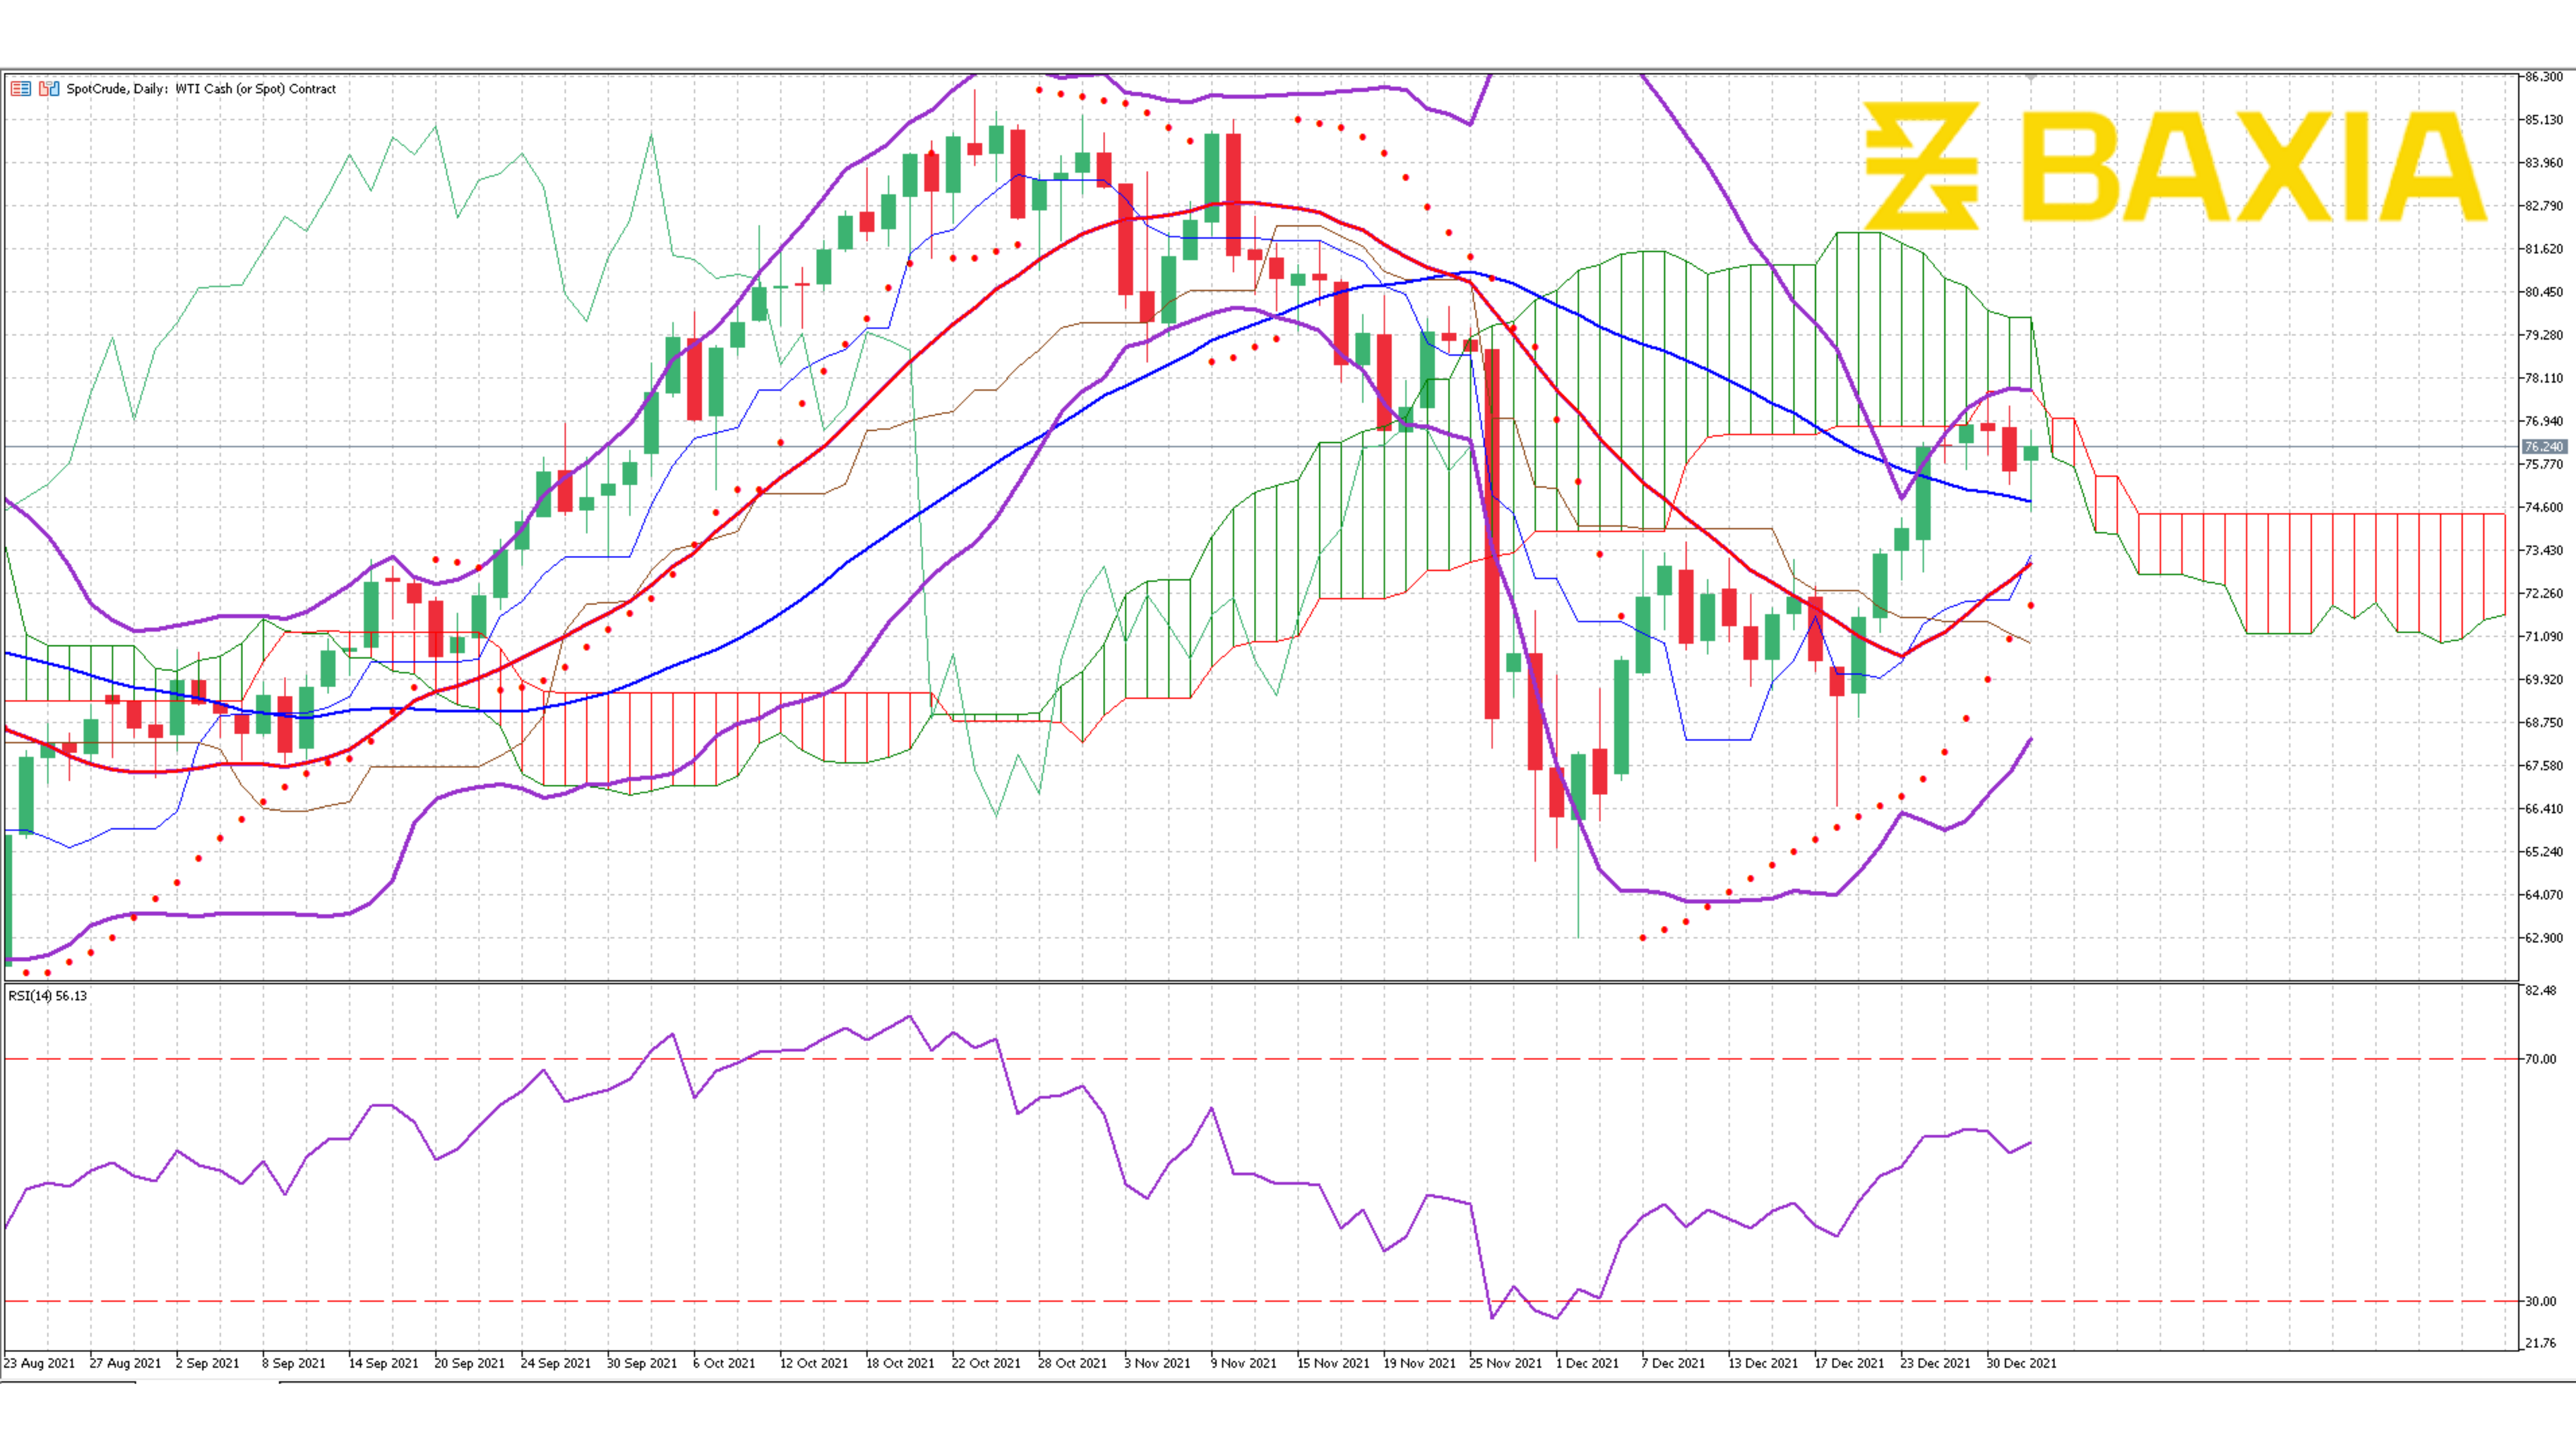

The energy commodity continues rallying in general terms, the pair suffered a 2.5% loss in the two previous sessions but we see this just as a short-term correction. The short and long-term moving averages are below the price line, strengthening the long signals.
The Bollinger bands are wide and moving up almost symmetrically with the price, this would allow the pair to continue rising before finding strong resistance at the upper band, the pair, however, trades close to that band, suggesting that the price is relatively high.
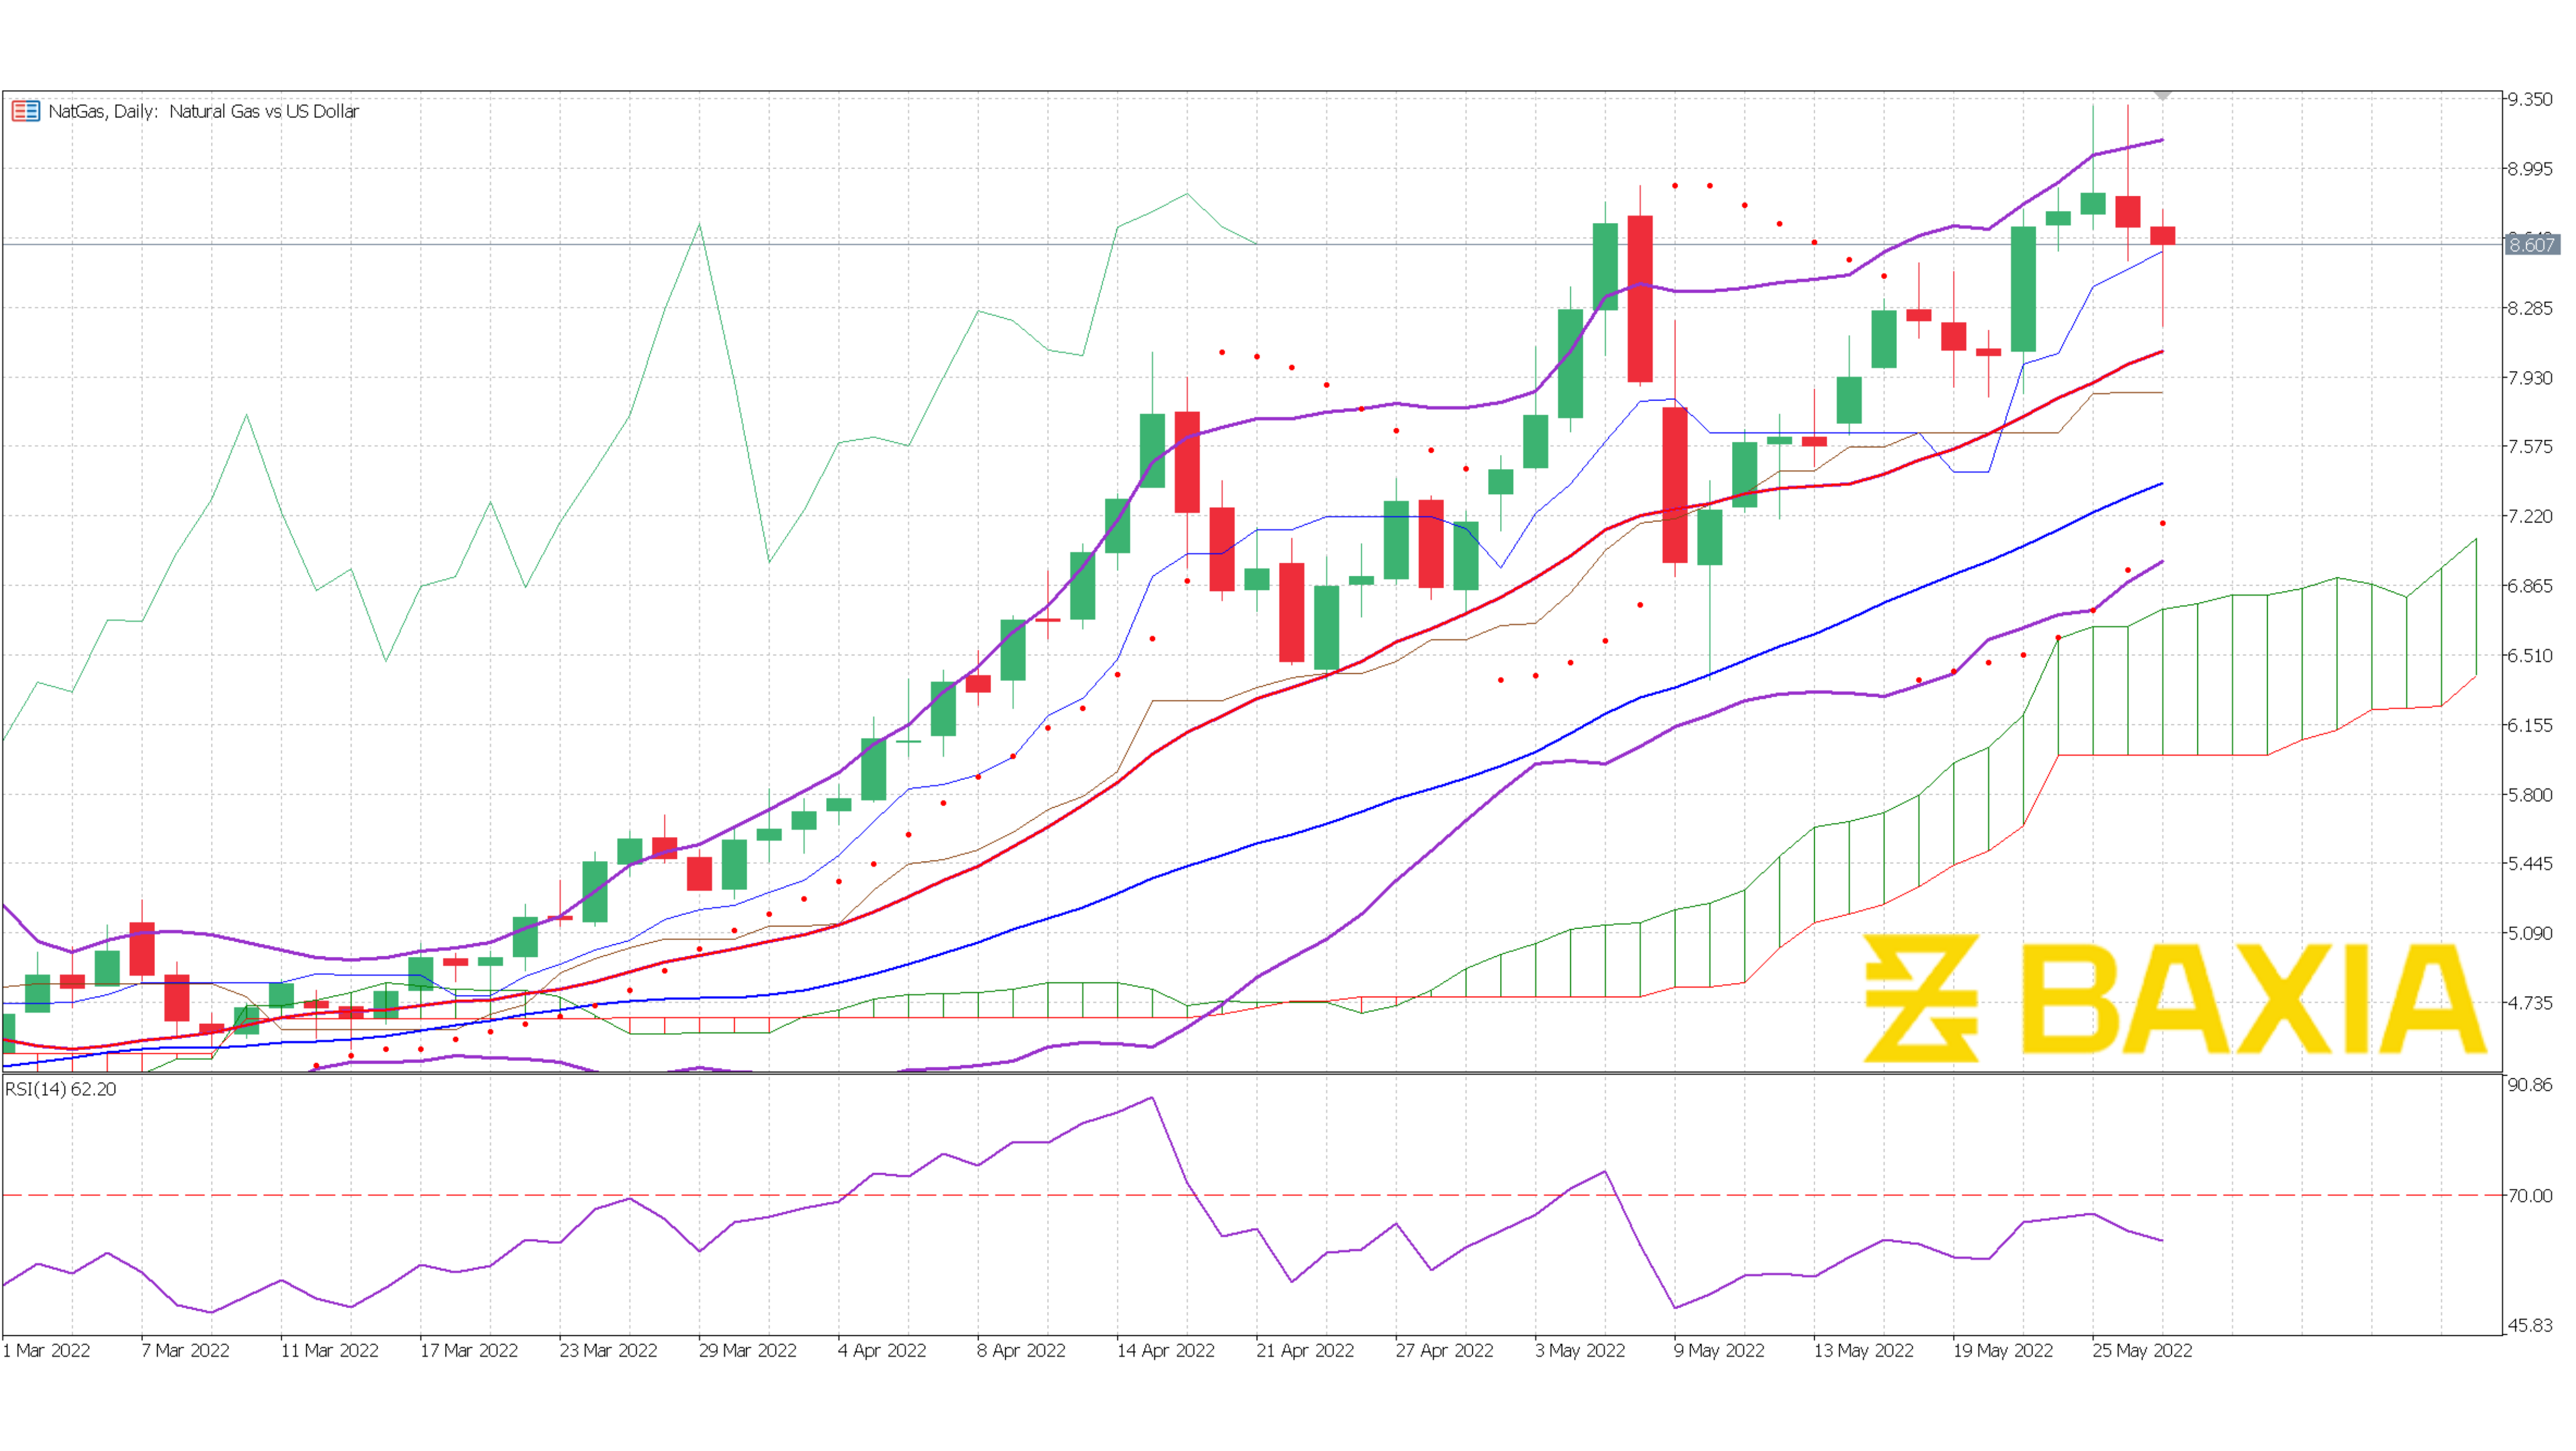
The relative strength index is at 62% which will allow the price to continue climbing before entering an overbought status, once it gets closer to or above 70% we could potentially see another correction. Our parabolic SAR indicator suggests that the price is likely to continue moving upwards in the short term.
We love to hear new ideas from traders and want to know what you think!
If you like this topic and want to suggest future topics that you find helpful, let us know by clicking the ‘submit your feedback’ button below.

Trading foreign exchange on margin carries a high level of risk, and may not be suitable for all investors. Before deciding to trade foreign exchange you should carefully consider your investment objectives, level of experience, and risk appetite.
Nothing contained in this website should be construed as investment advice. Any reference to an investment's past or potential performance is not, and should not be construed as, a recommendation or as a guarantee of any specific outcome or profit.