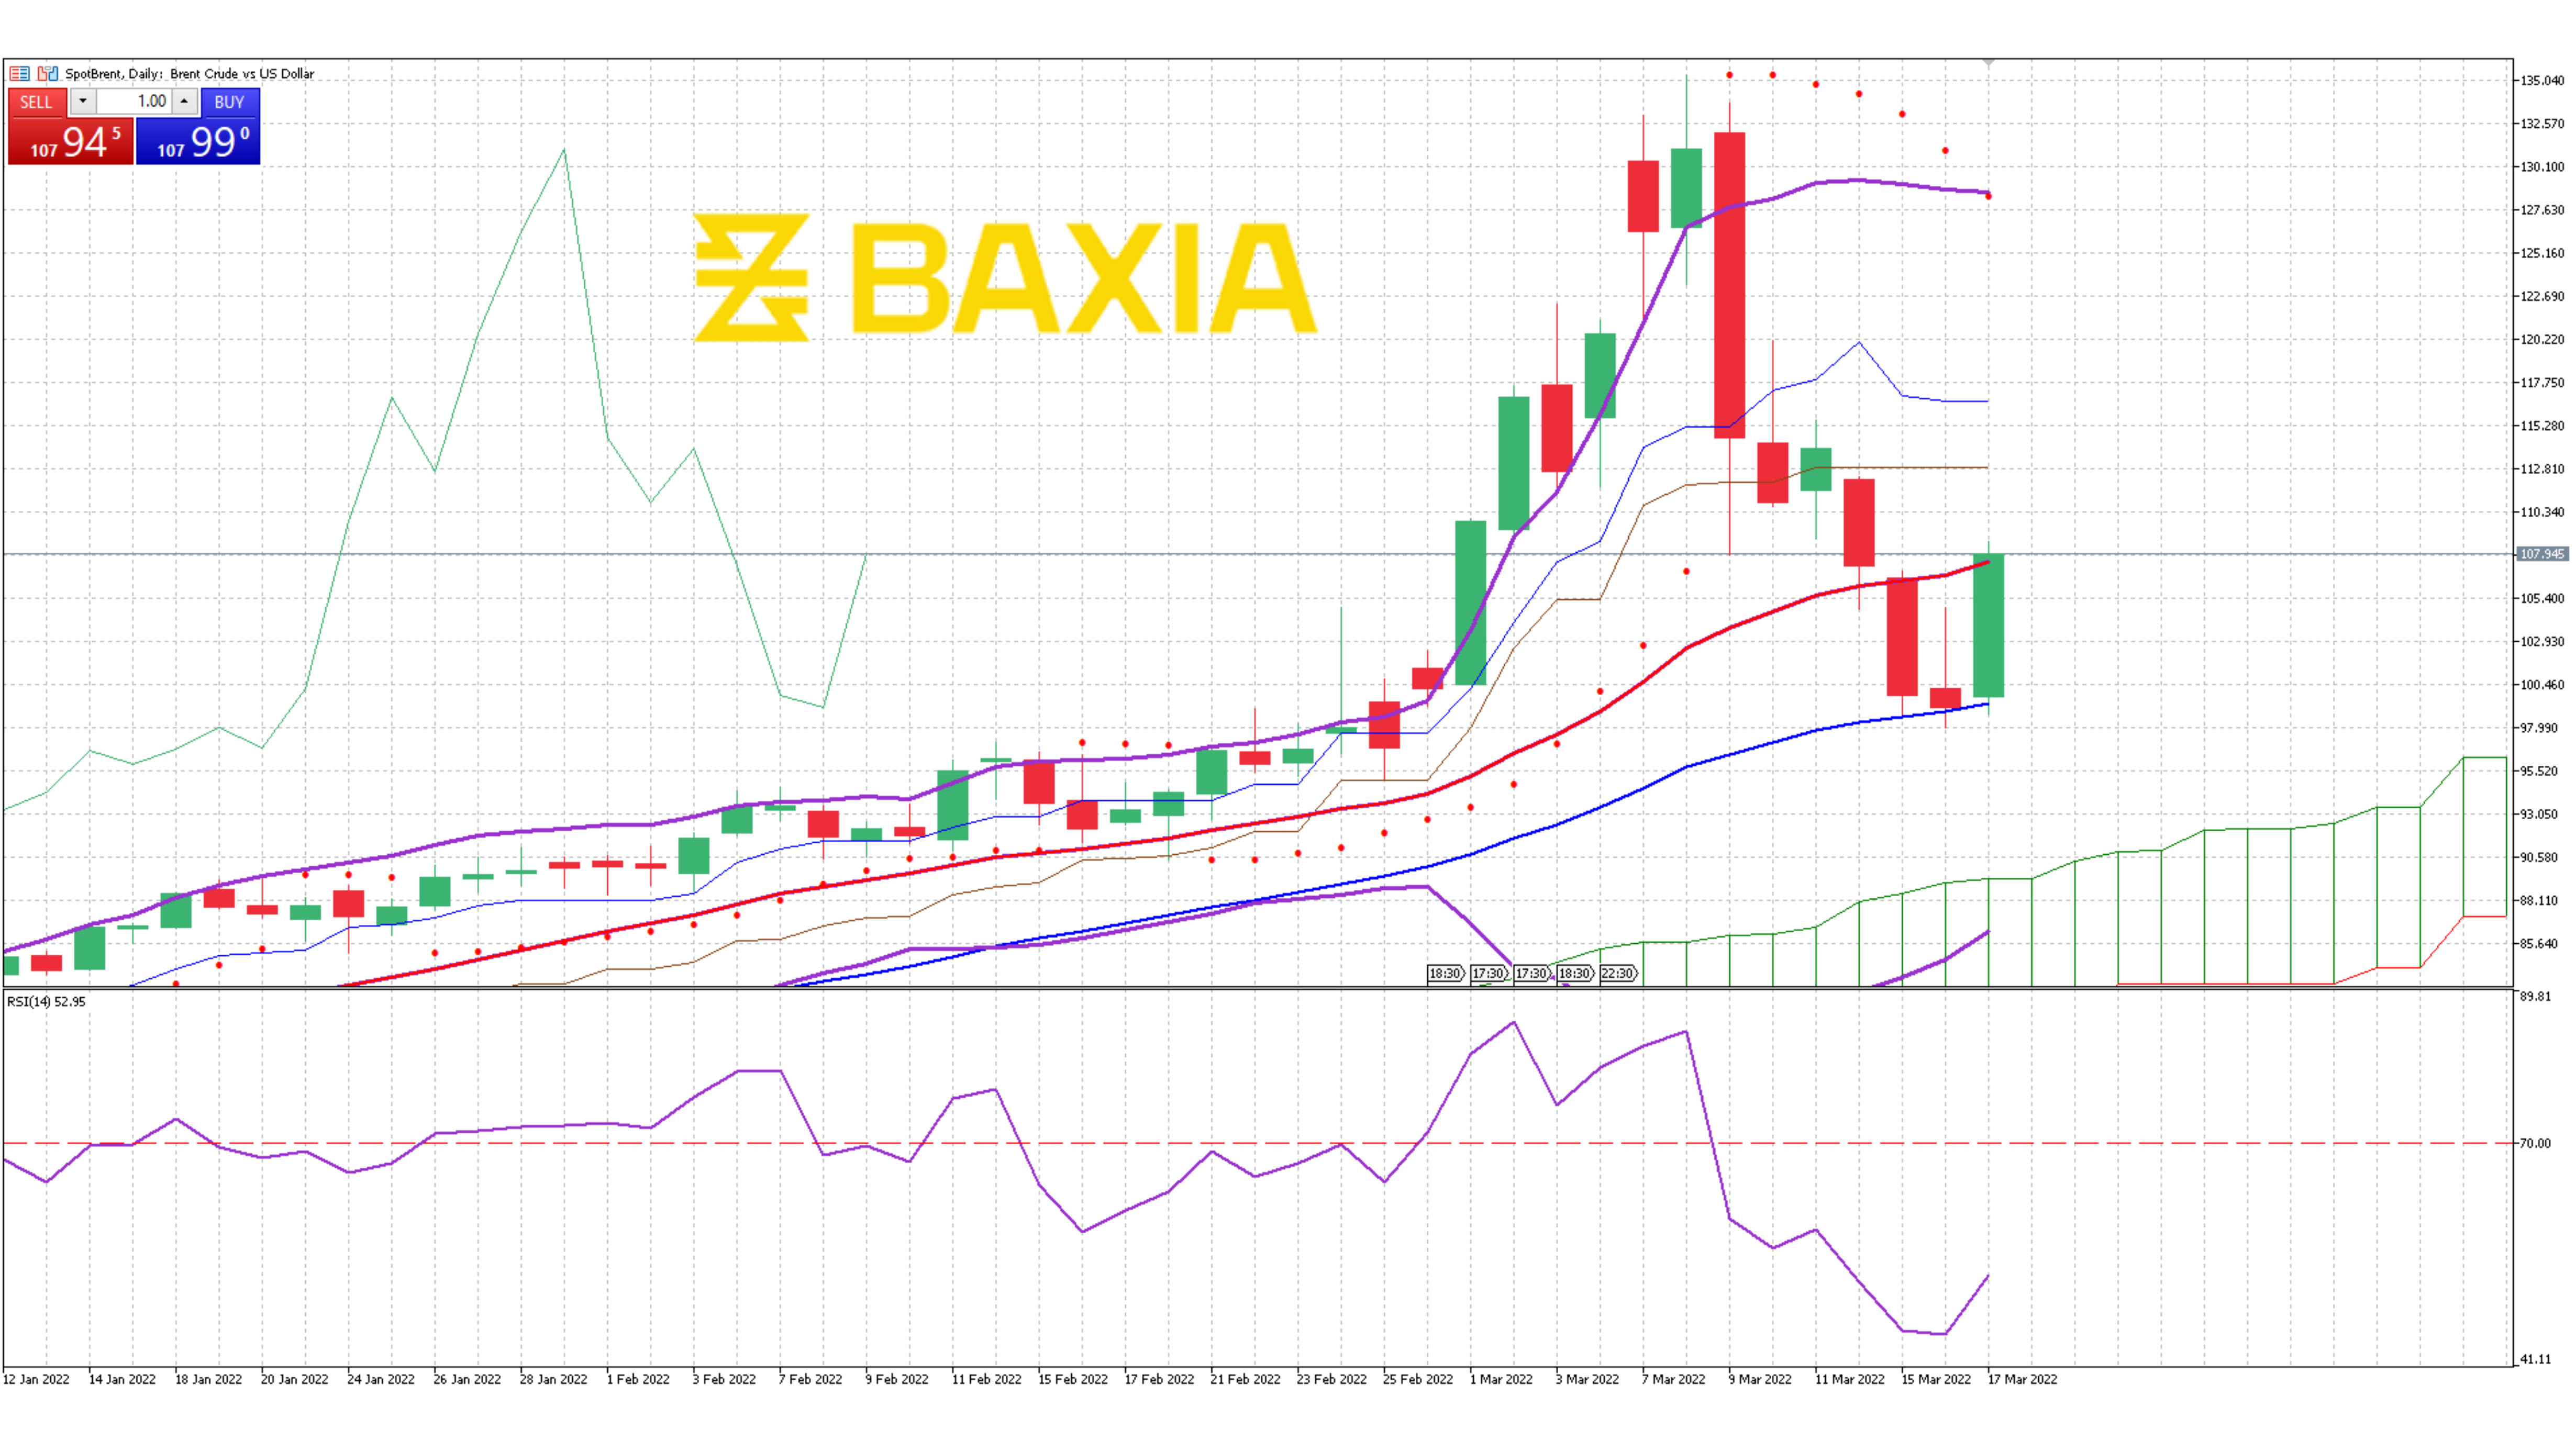

The energy commodity took a big hit on Friday’s trading session after reaching $9.021, the highest level since August 2008, the gap between the short and long-term moving average continues expanding, and the upwards trend continues in general terms.
The Bollinger bands are wide and continue moving upwards; this will allow high volatility in the upcoming trading sessions and the upwards trend to resume after the recent price correction. The pair traded way above the upper band, suggesting that the price was relatively high.
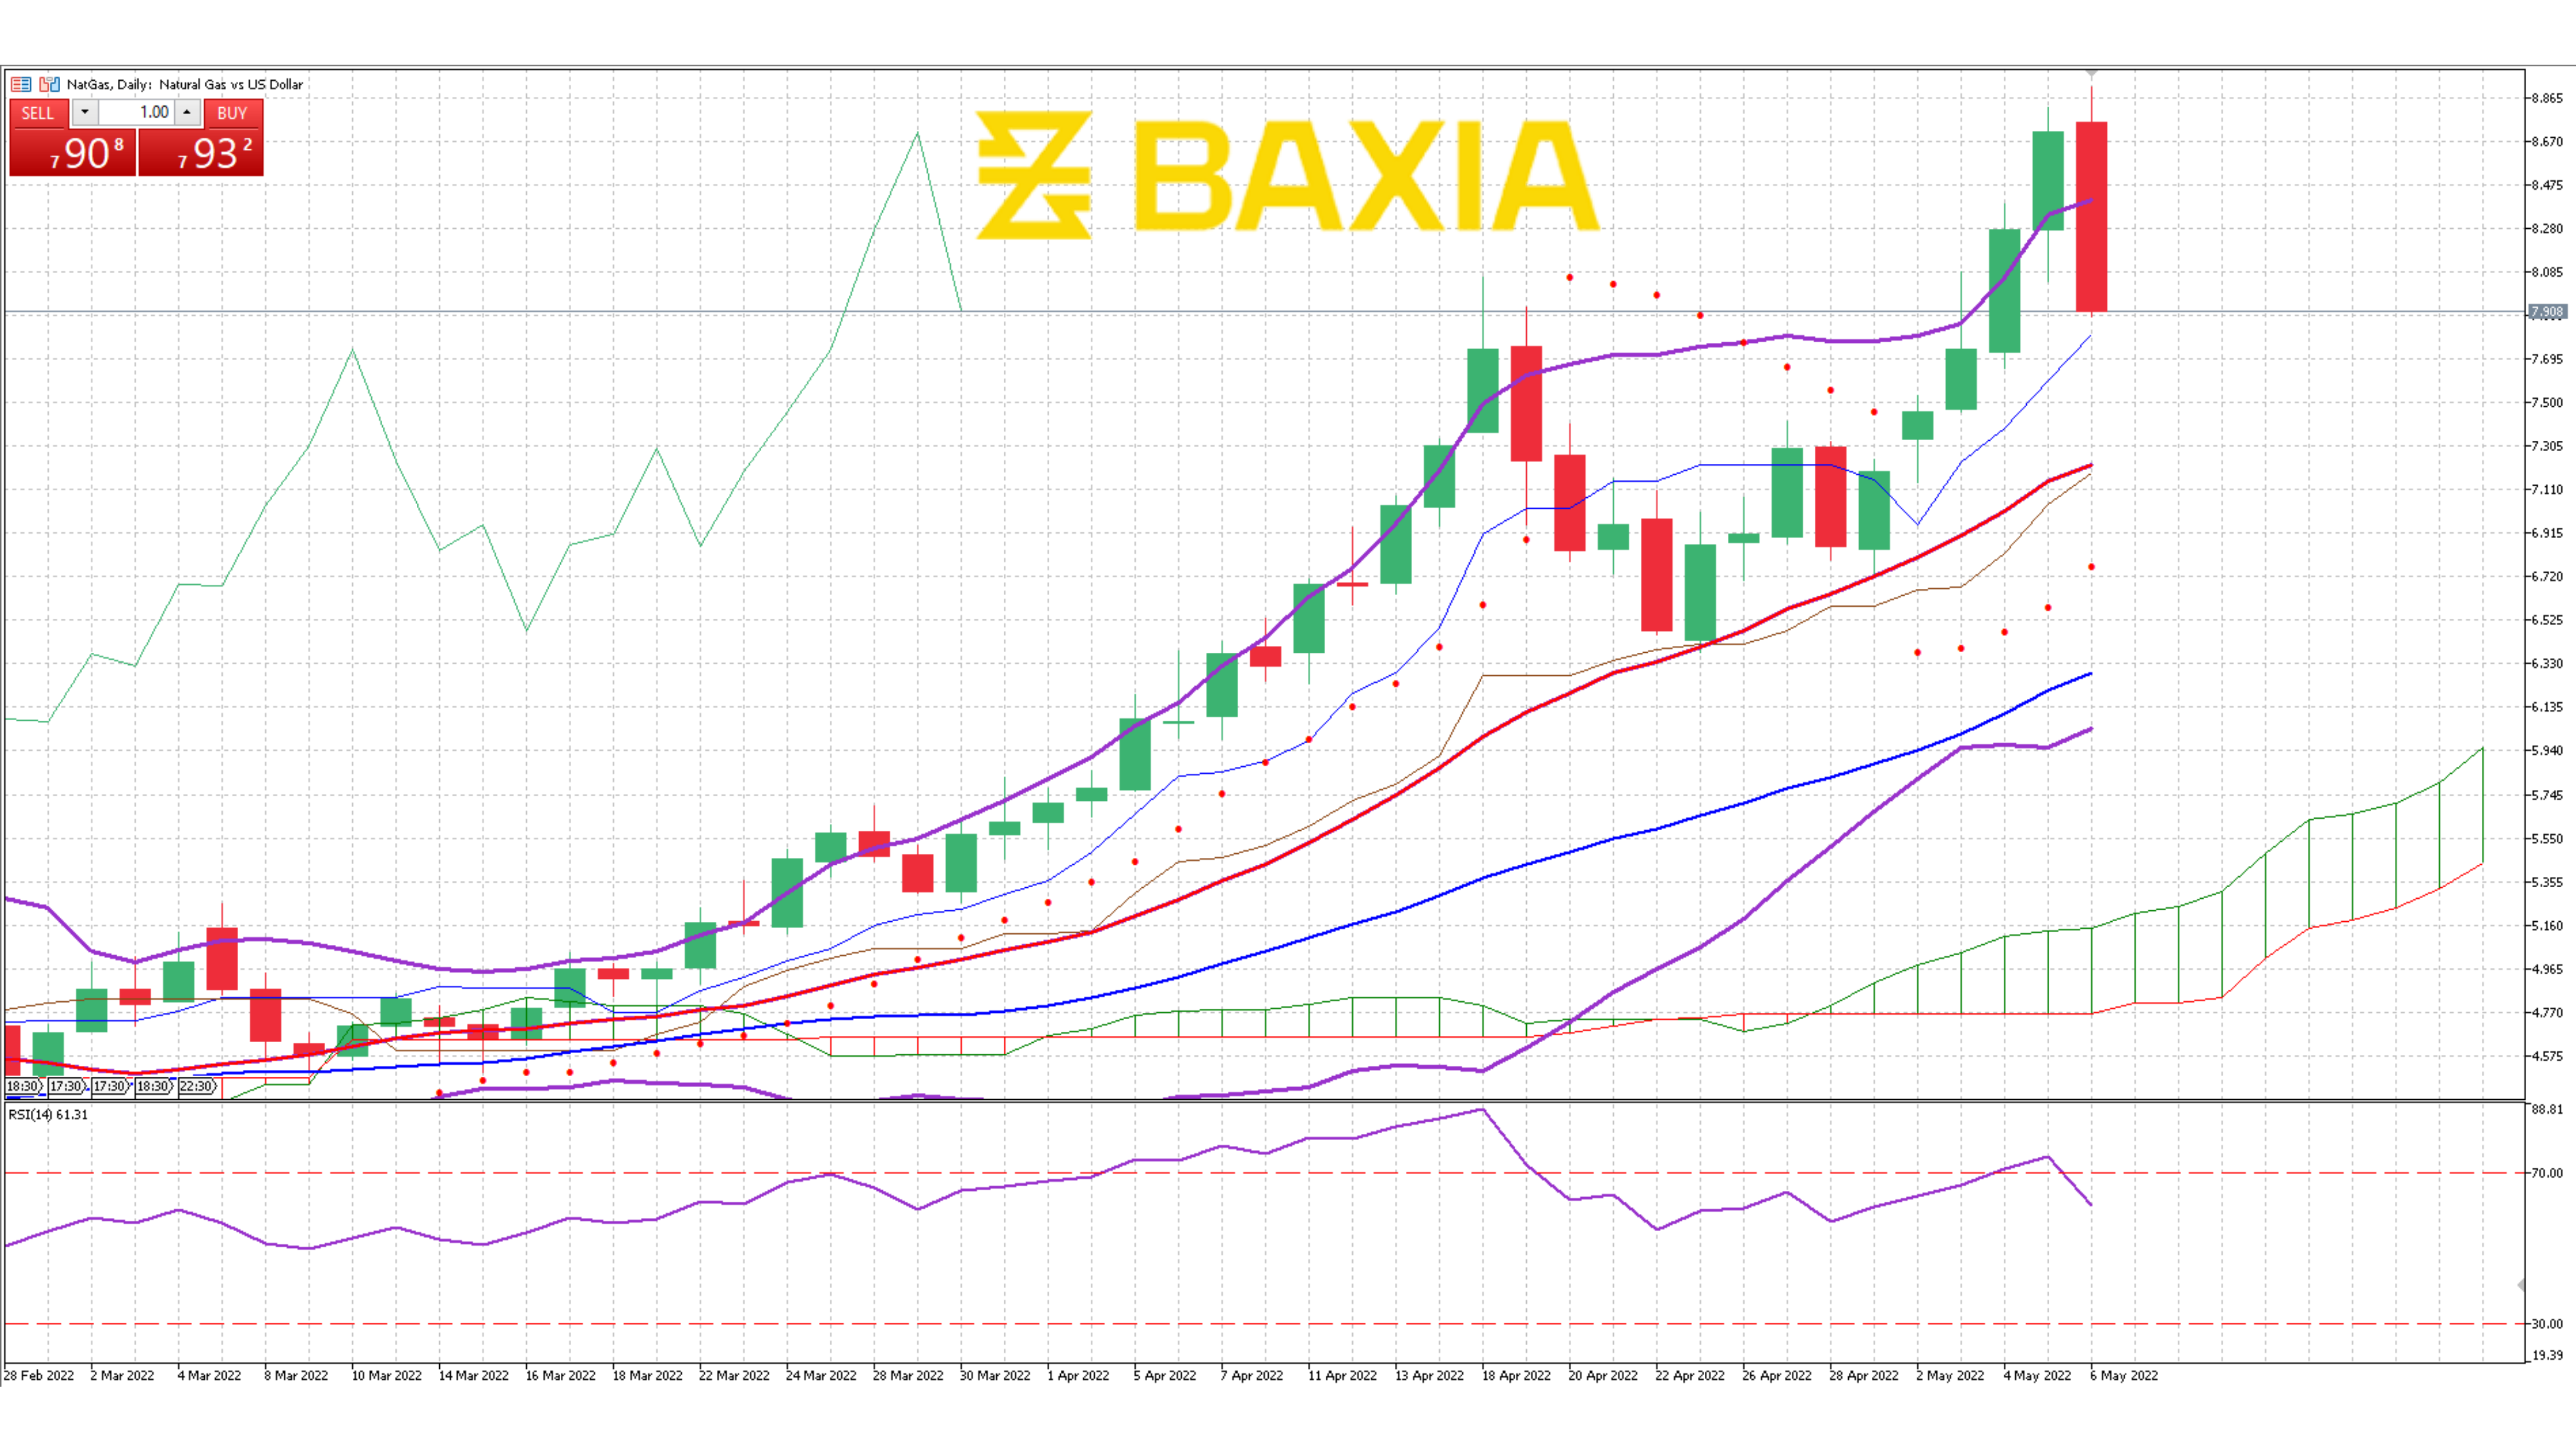
The relative strength index is currently at 61%, recovering after entering an overbought status, which in conjunction with the price passing, the upper Bollinger band caused the strong pullback on Friday’s session. Our parabolic SAR indicator suggests that the price is likely to move upwards in the short term.
We love to hear new ideas from traders and want to know what you think!
If you like this topic and want to suggest future topics that you find helpful, let us know by clicking the ‘submit your feedback’ button below.

Trading foreign exchange on margin carries a high level of risk, and may not be suitable for all investors. Before deciding to trade foreign exchange you should carefully consider your investment objectives, level of experience, and risk appetite.
Nothing contained in this website should be construed as investment advice. Any reference to an investment's past or potential performance is not, and should not be construed as, a recommendation or as a guarantee of any specific outcome or profit.