
XNGUSD continues its uptrend with a new high in more than two and a half years.
The Bollinger bands are wide and moving upwards, which indicates high volatility and an uptrend continuity. However, the price is very close to the upper band, which suggests that the price is relatively high.
The relative strength index is close to entering an overbought status; it's currently at 69%; this has not stopped the energy commodity from continuing the uptrend in the past, which could be the case again. From a technical analysis point of view, the price should start retracing soon, but there might still be some room for it to continue climbing, possibly to the $4.30 levels.
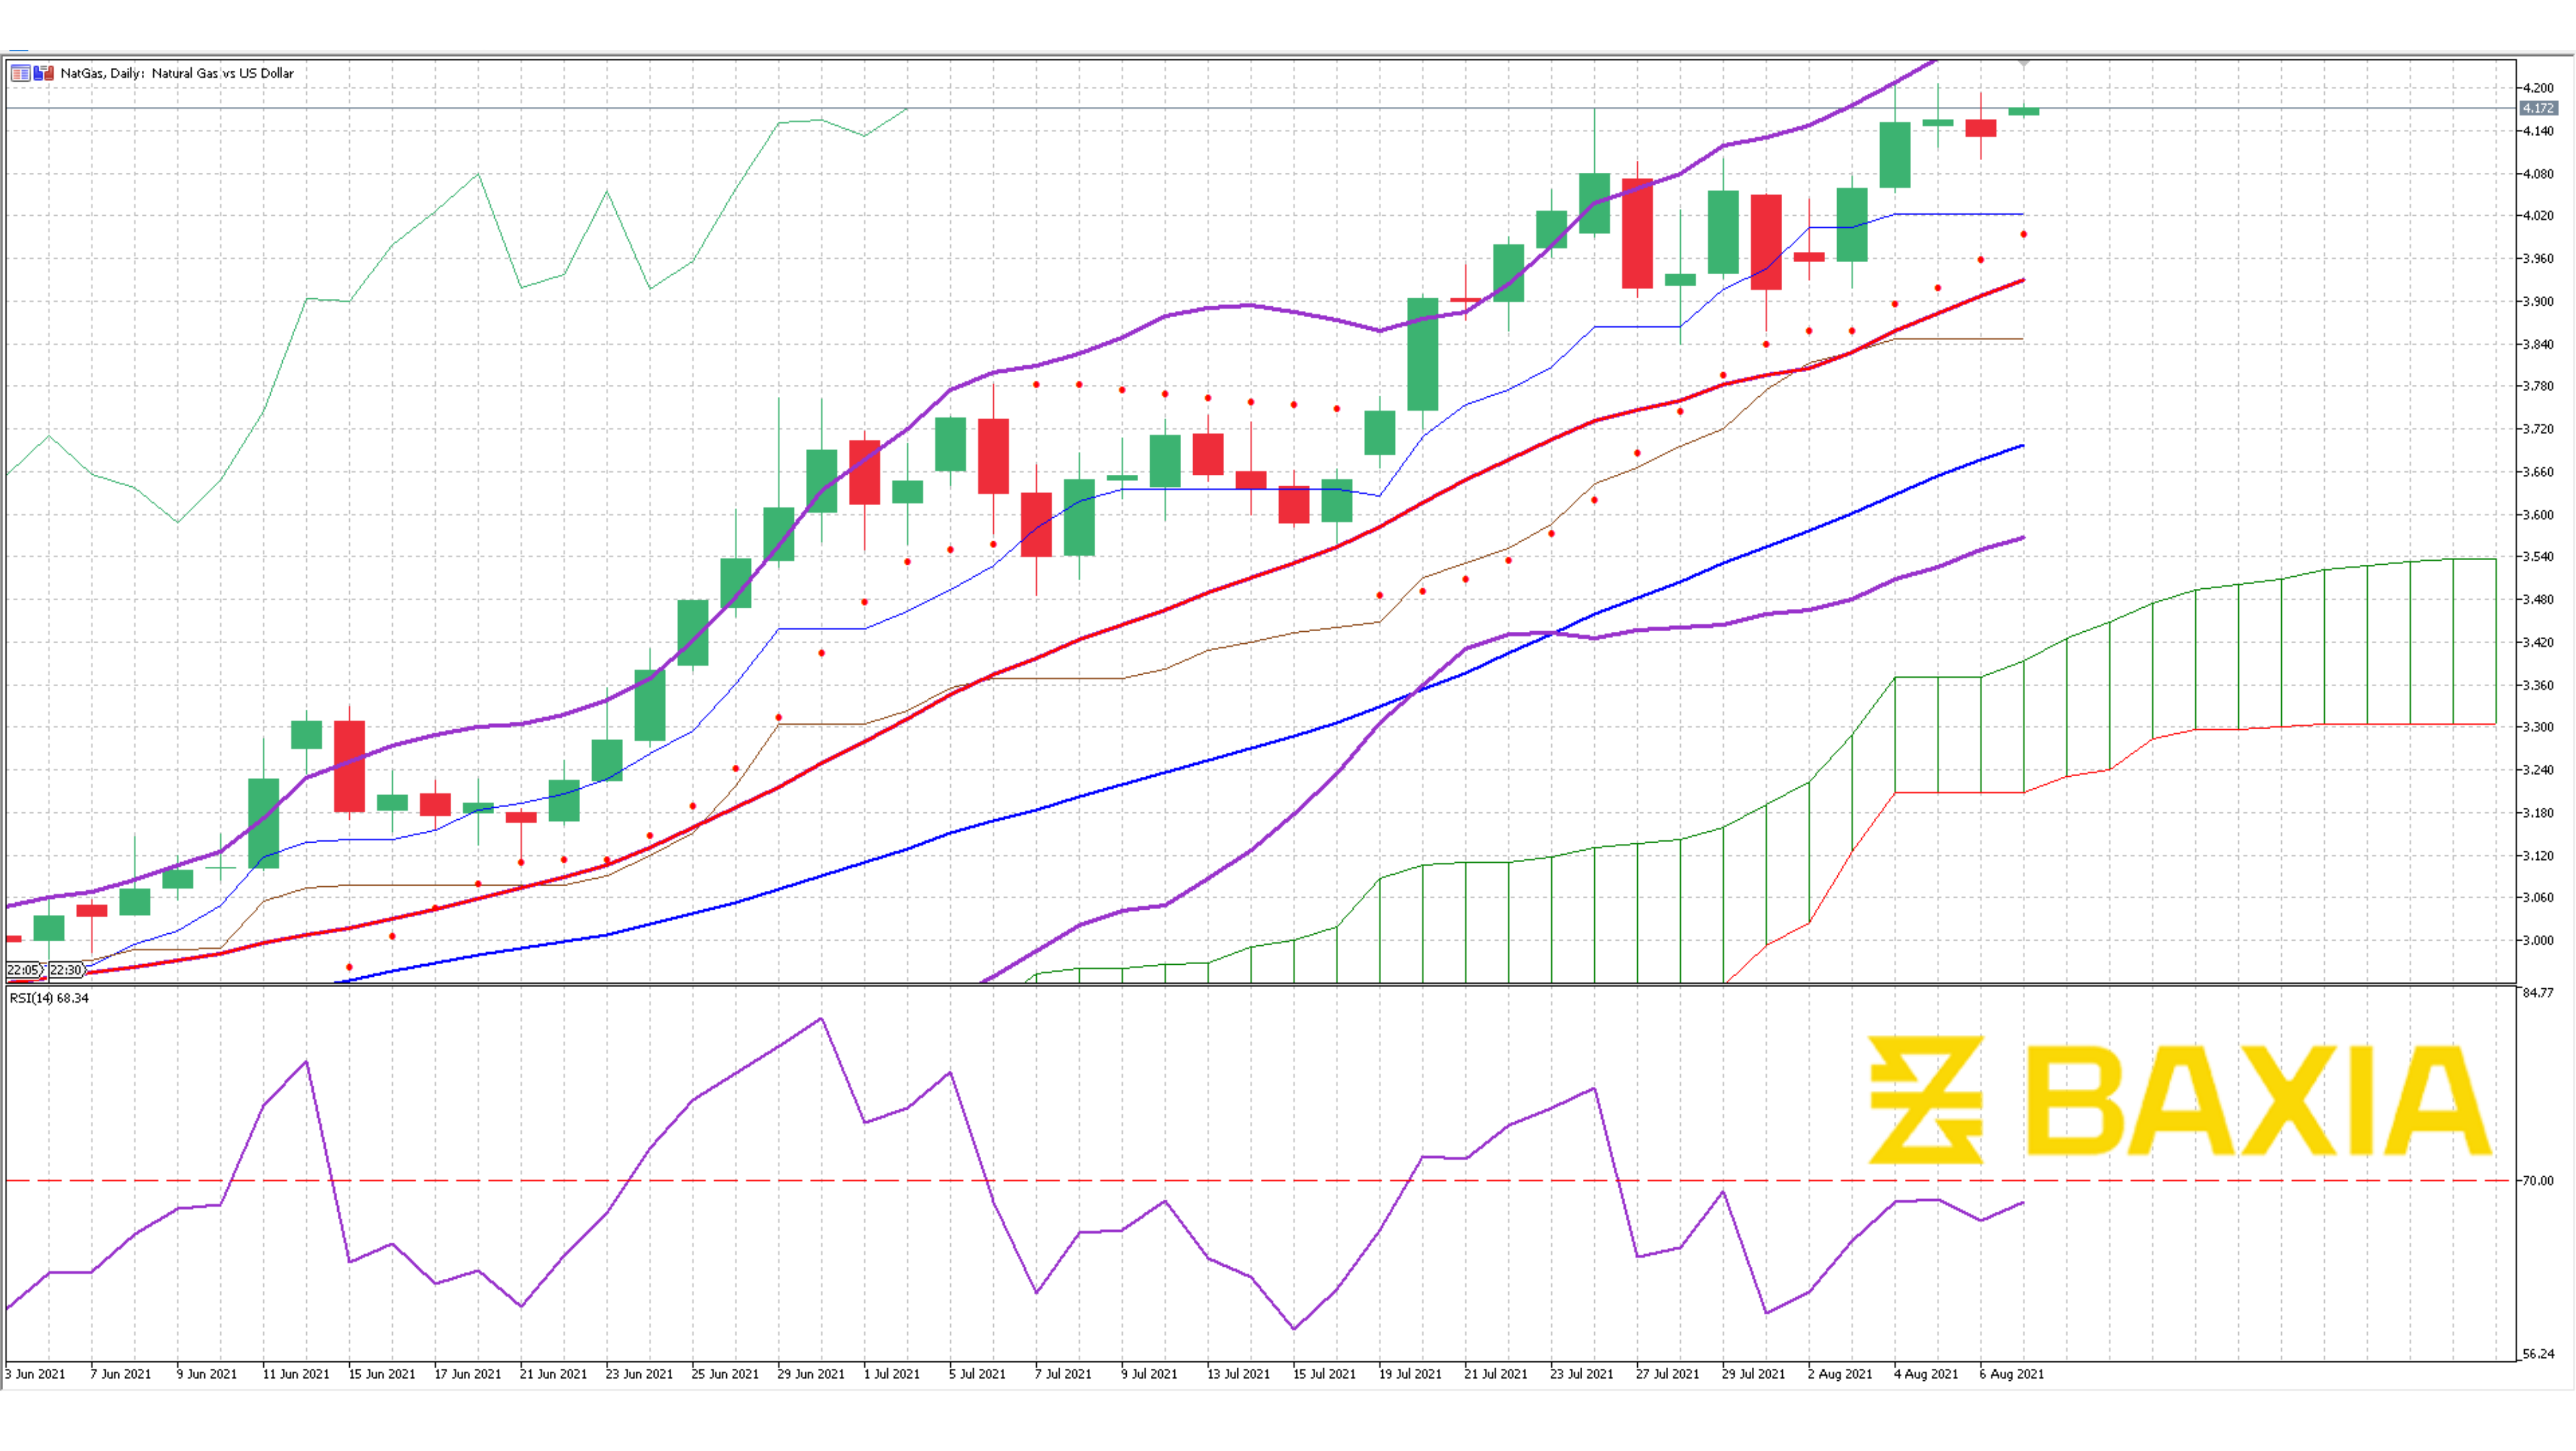
The short and long-term moving averages are naturally climbing with the price. The gap between these lines continues expanding, and the general trend is, of course, upwards. Our parabolic SAR and other indicators support this.
The next step for the price will be to break the previous high at 4.202; if it manages to complete this breakout, the price can reach 4.35 in the short term.
We love to hear new ideas from traders and want to know what you think!
If you like this topic and want to suggest future topics that you find helpful, let us know by clicking the ‘submit your feedback’ button below.

Trading foreign exchange on margin carries a high level of risk, and may not be suitable for all investors. Before deciding to trade foreign exchange you should carefully consider your investment objectives, level of experience, and risk appetite.
Nothing contained in this website should be construed as investment advice. Any reference to an investment's past or potential performance is not, and should not be construed as, a recommendation or as a guarantee of any specific outcome or profit.