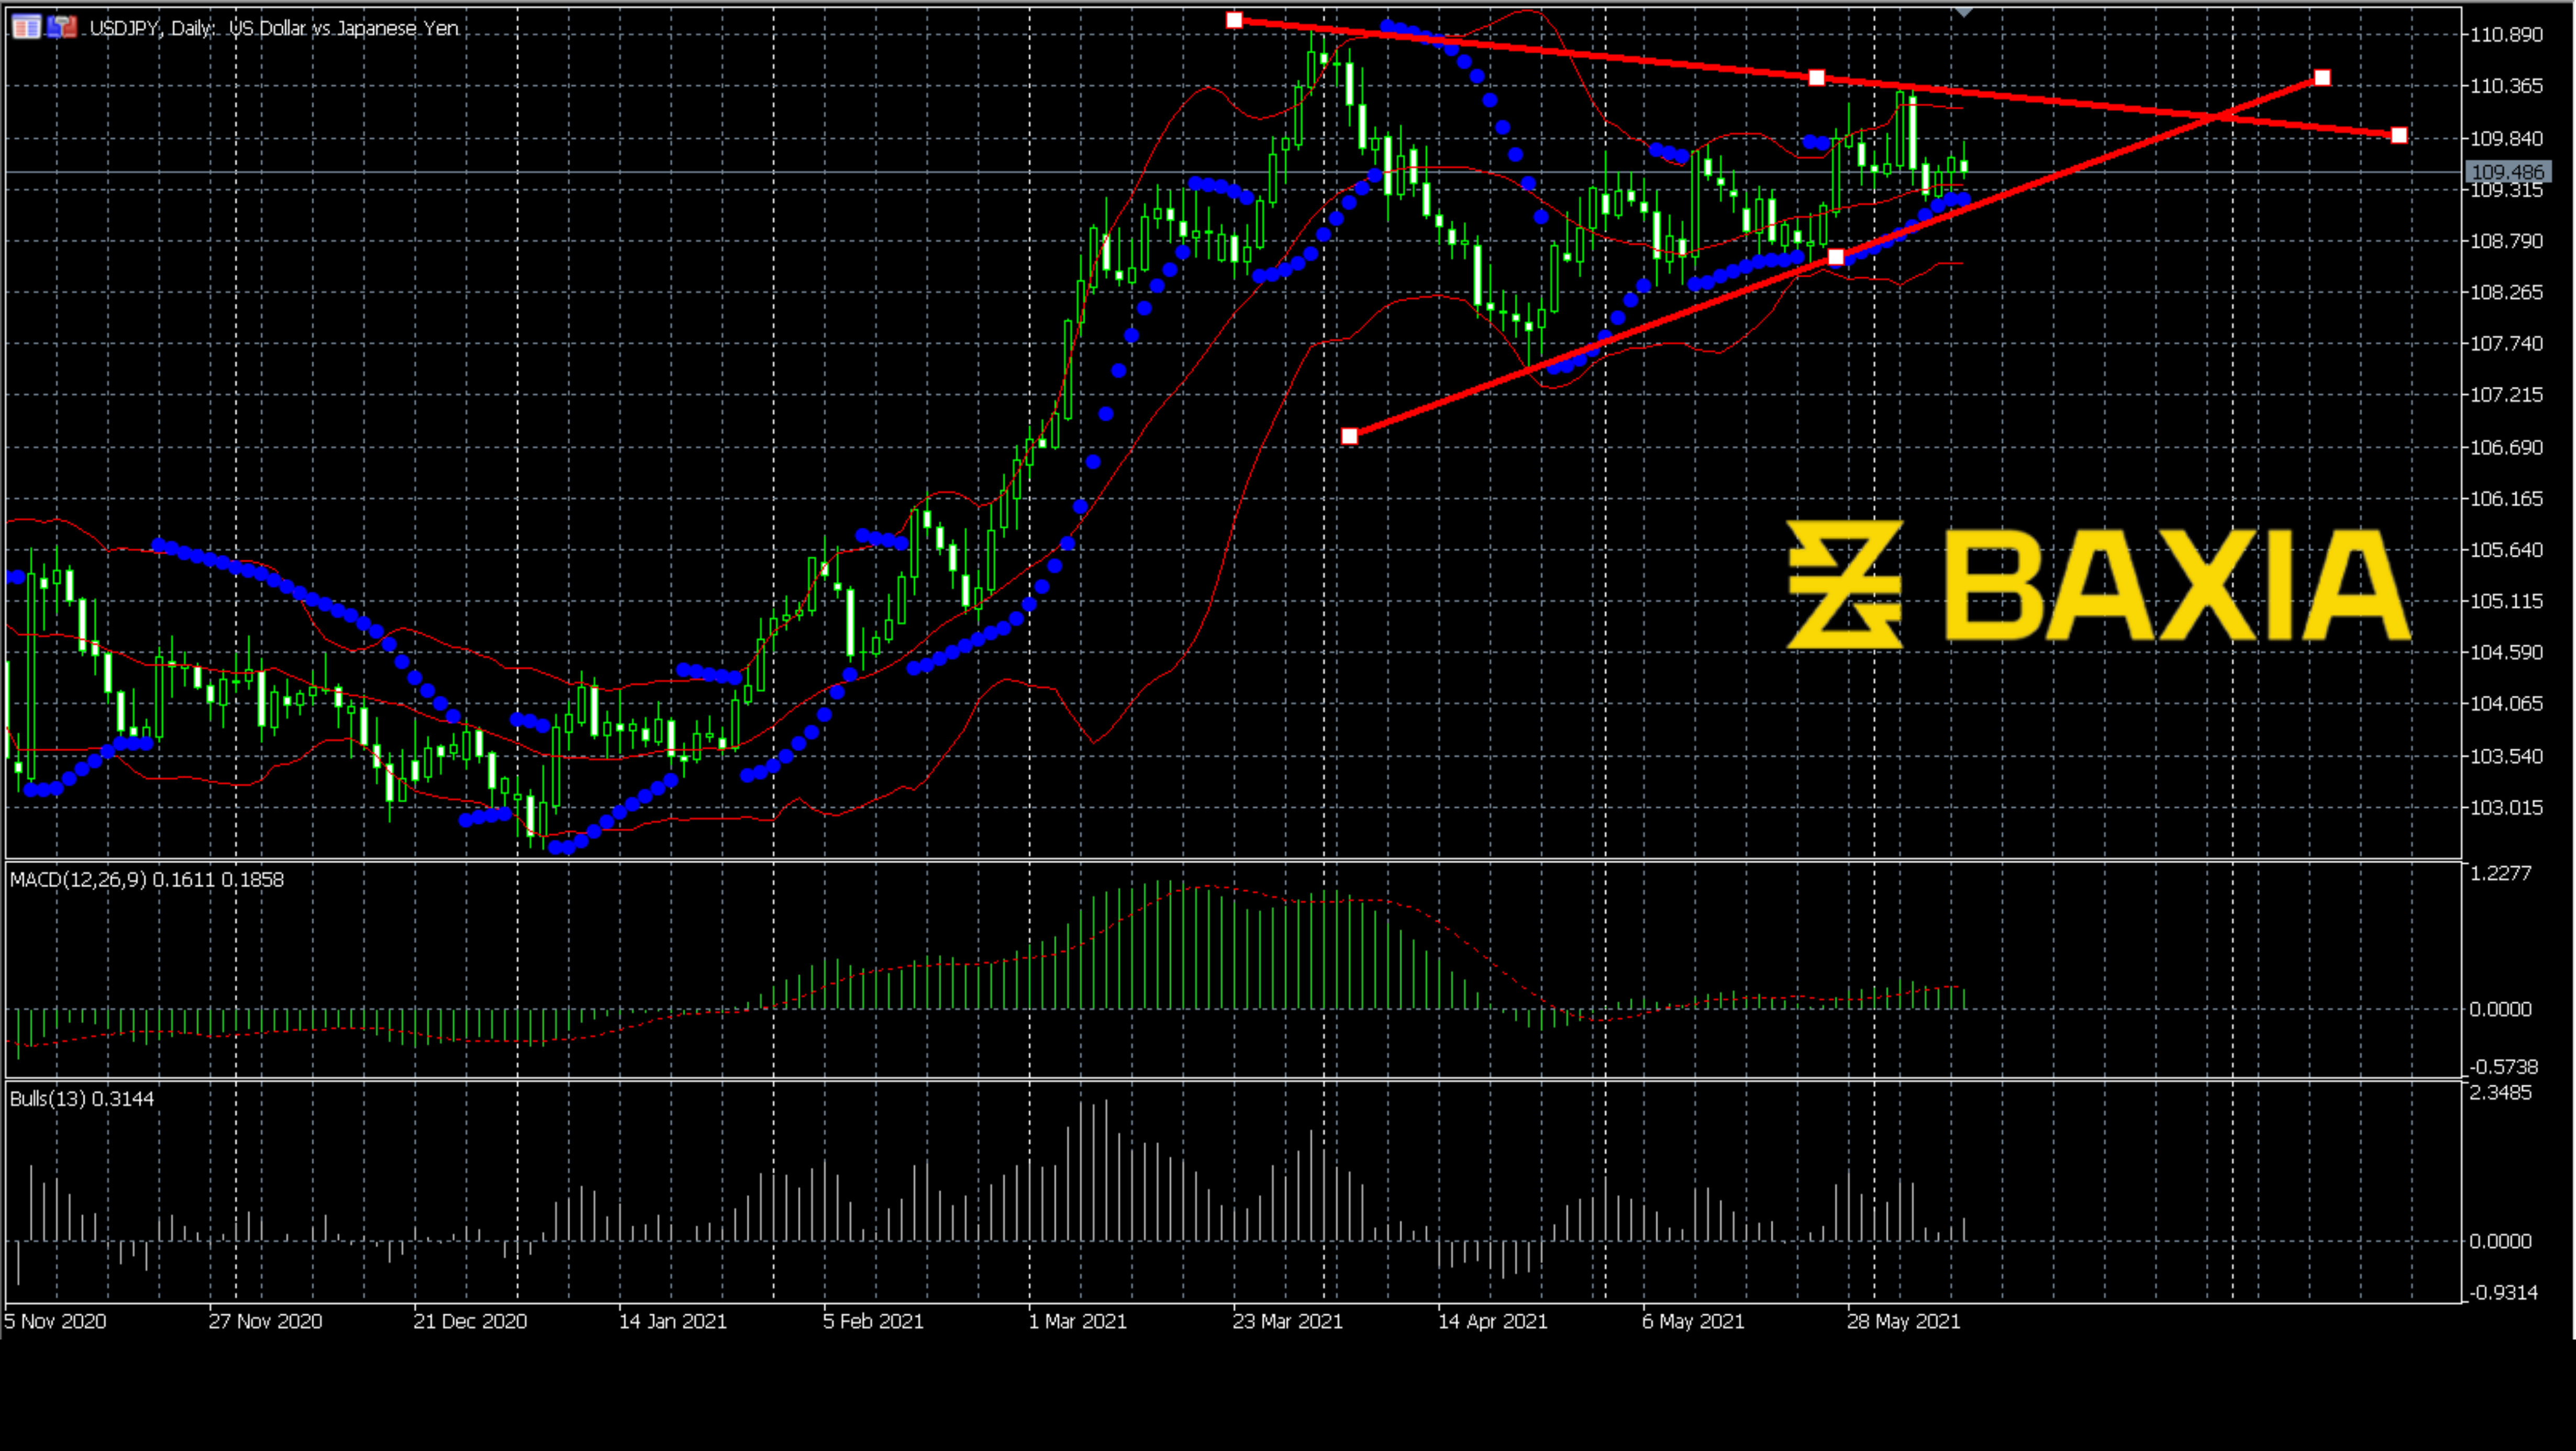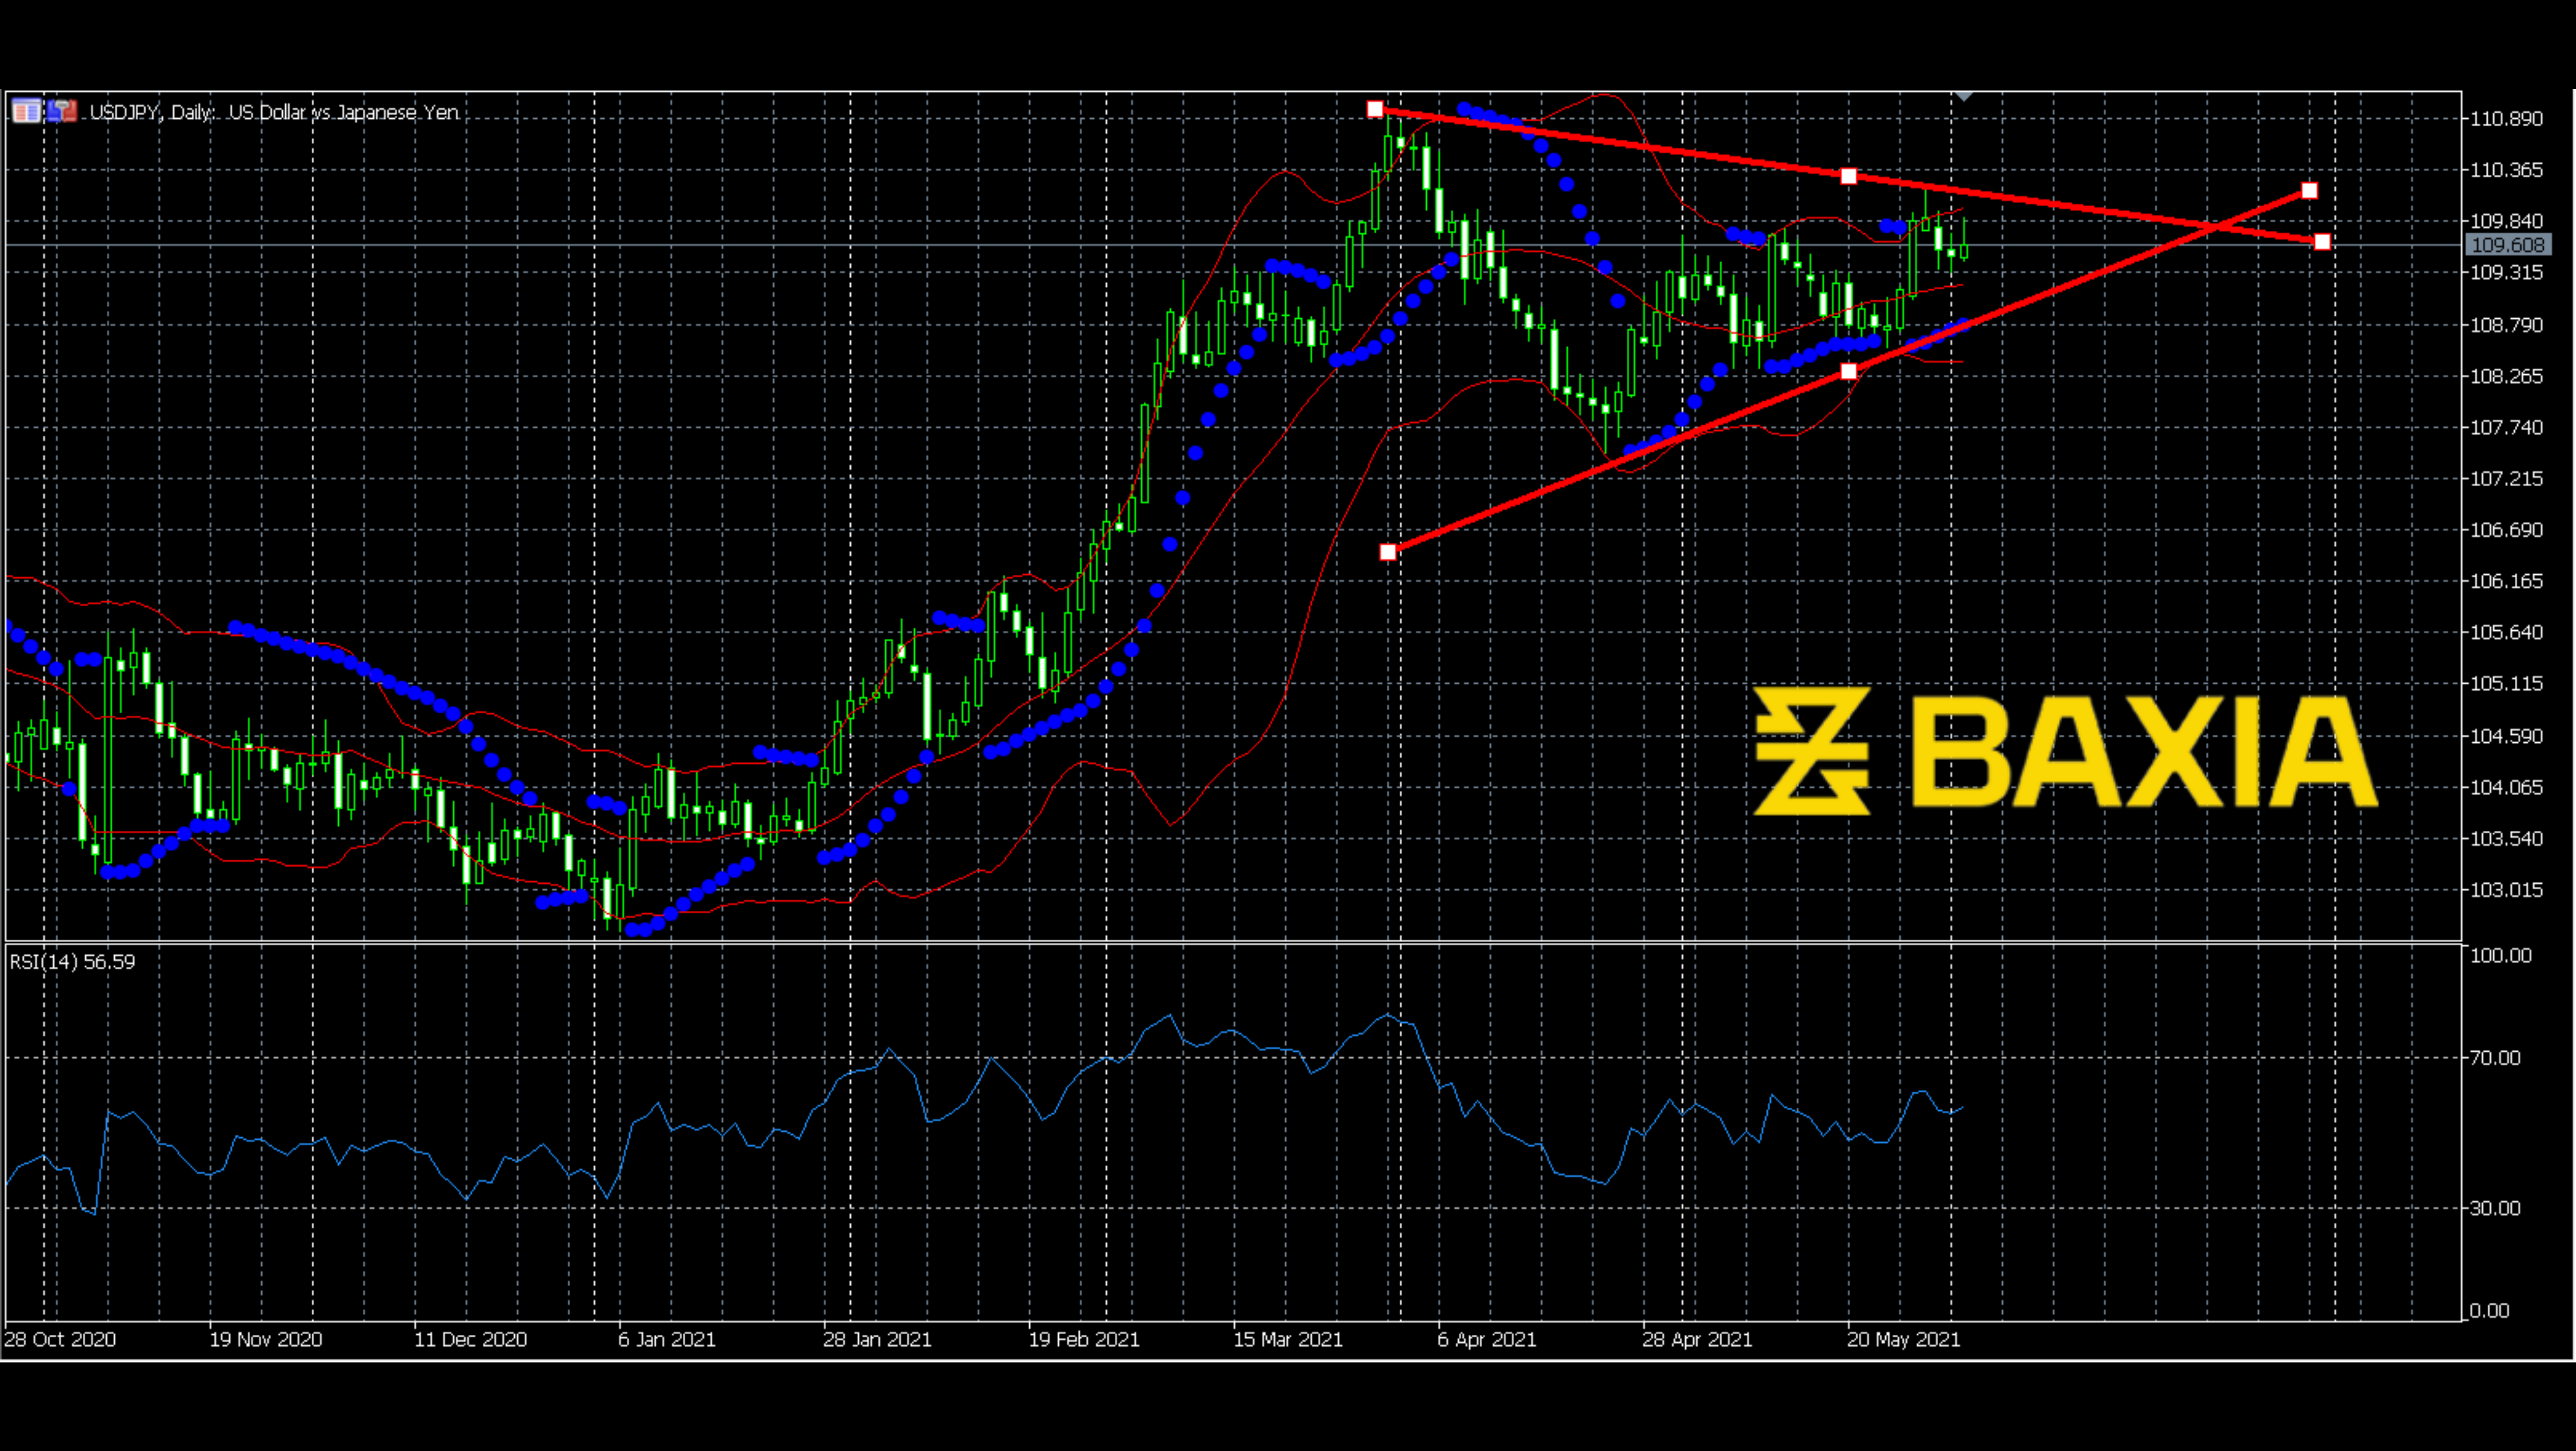

As can be seen from the daily chart of USDJPY, the price has been making this pennant since Aug 4th. The pennant only broke out the Bollinger bands once, and the breakout was at the beginning, which was the biggest wave. After that, the fluctuation started to shrink, which was supposed to be a perfect pennant.
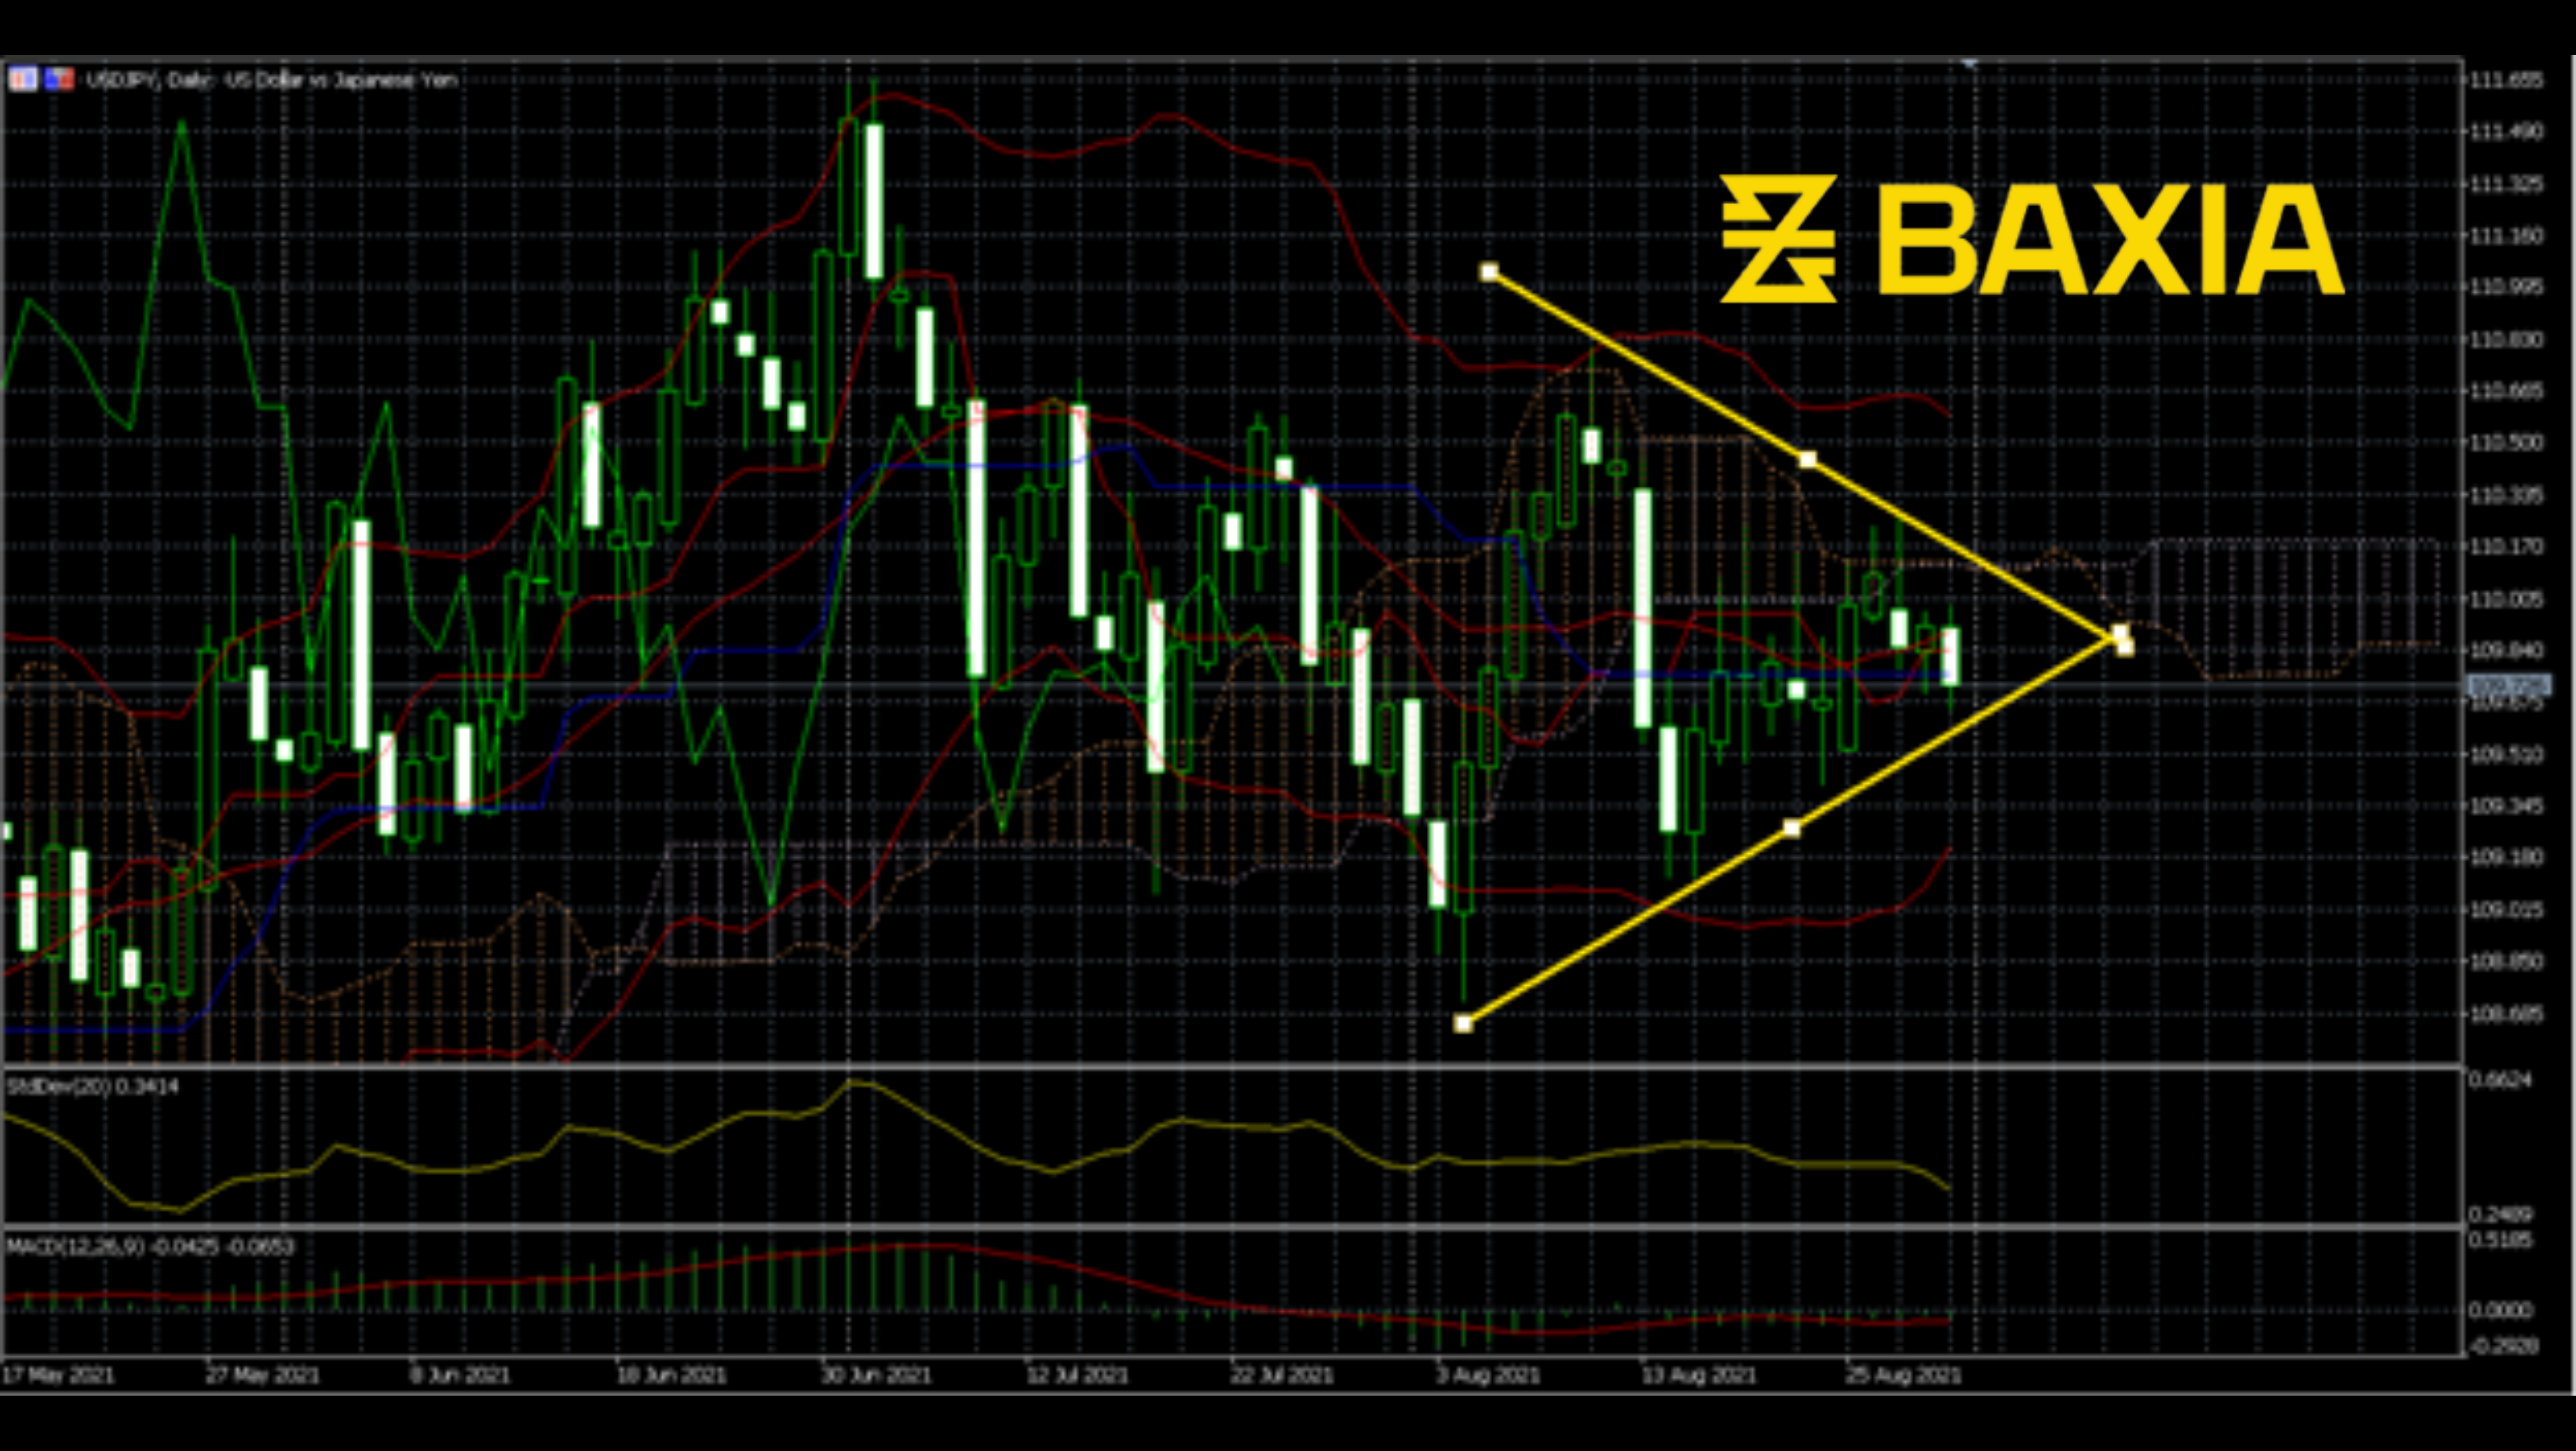
The pennant is always considered a breakout signal. The breakout direction depends on the previous trend. According to the daily chart, the price was in a downward trend. So, will the price go down after this pennant pattern? We cannot see anything from the Bollinger Bands; the price just moves around the middle line. Ichimoku is not clear either. So now, the only signal we have is the pennant pattern. Then, we should pay more attention to the signals and price line.
We love to hear new ideas from traders and want to know what you think!
If you like this topic and want to suggest future topics that you find helpful, let us know by clicking the ‘submit your feedback’ button below.

Trading foreign exchange on margin carries a high level of risk, and may not be suitable for all investors. Before deciding to trade foreign exchange you should carefully consider your investment objectives, level of experience, and risk appetite.
Nothing contained in this website should be construed as investment advice. Any reference to an investment's past or potential performance is not, and should not be construed as, a recommendation or as a guarantee of any specific outcome or profit.