
The cryptocurrency has been on a four-day losing streak; it managed to break a support level at $1.23284, which is the 50% Fibonacci retracement.
The Bollinger bands are opening up and starting to move down, which is often a downtrend sign. The price trades closer to the lower band but not close enough to consider it oversold.
The relative strength index is at 46%, which will allow the pair to move in either direction. The price seems to be finding support at the 36.2% retracement; this will be a key level as it will dictate whether or not the downtrend continues.
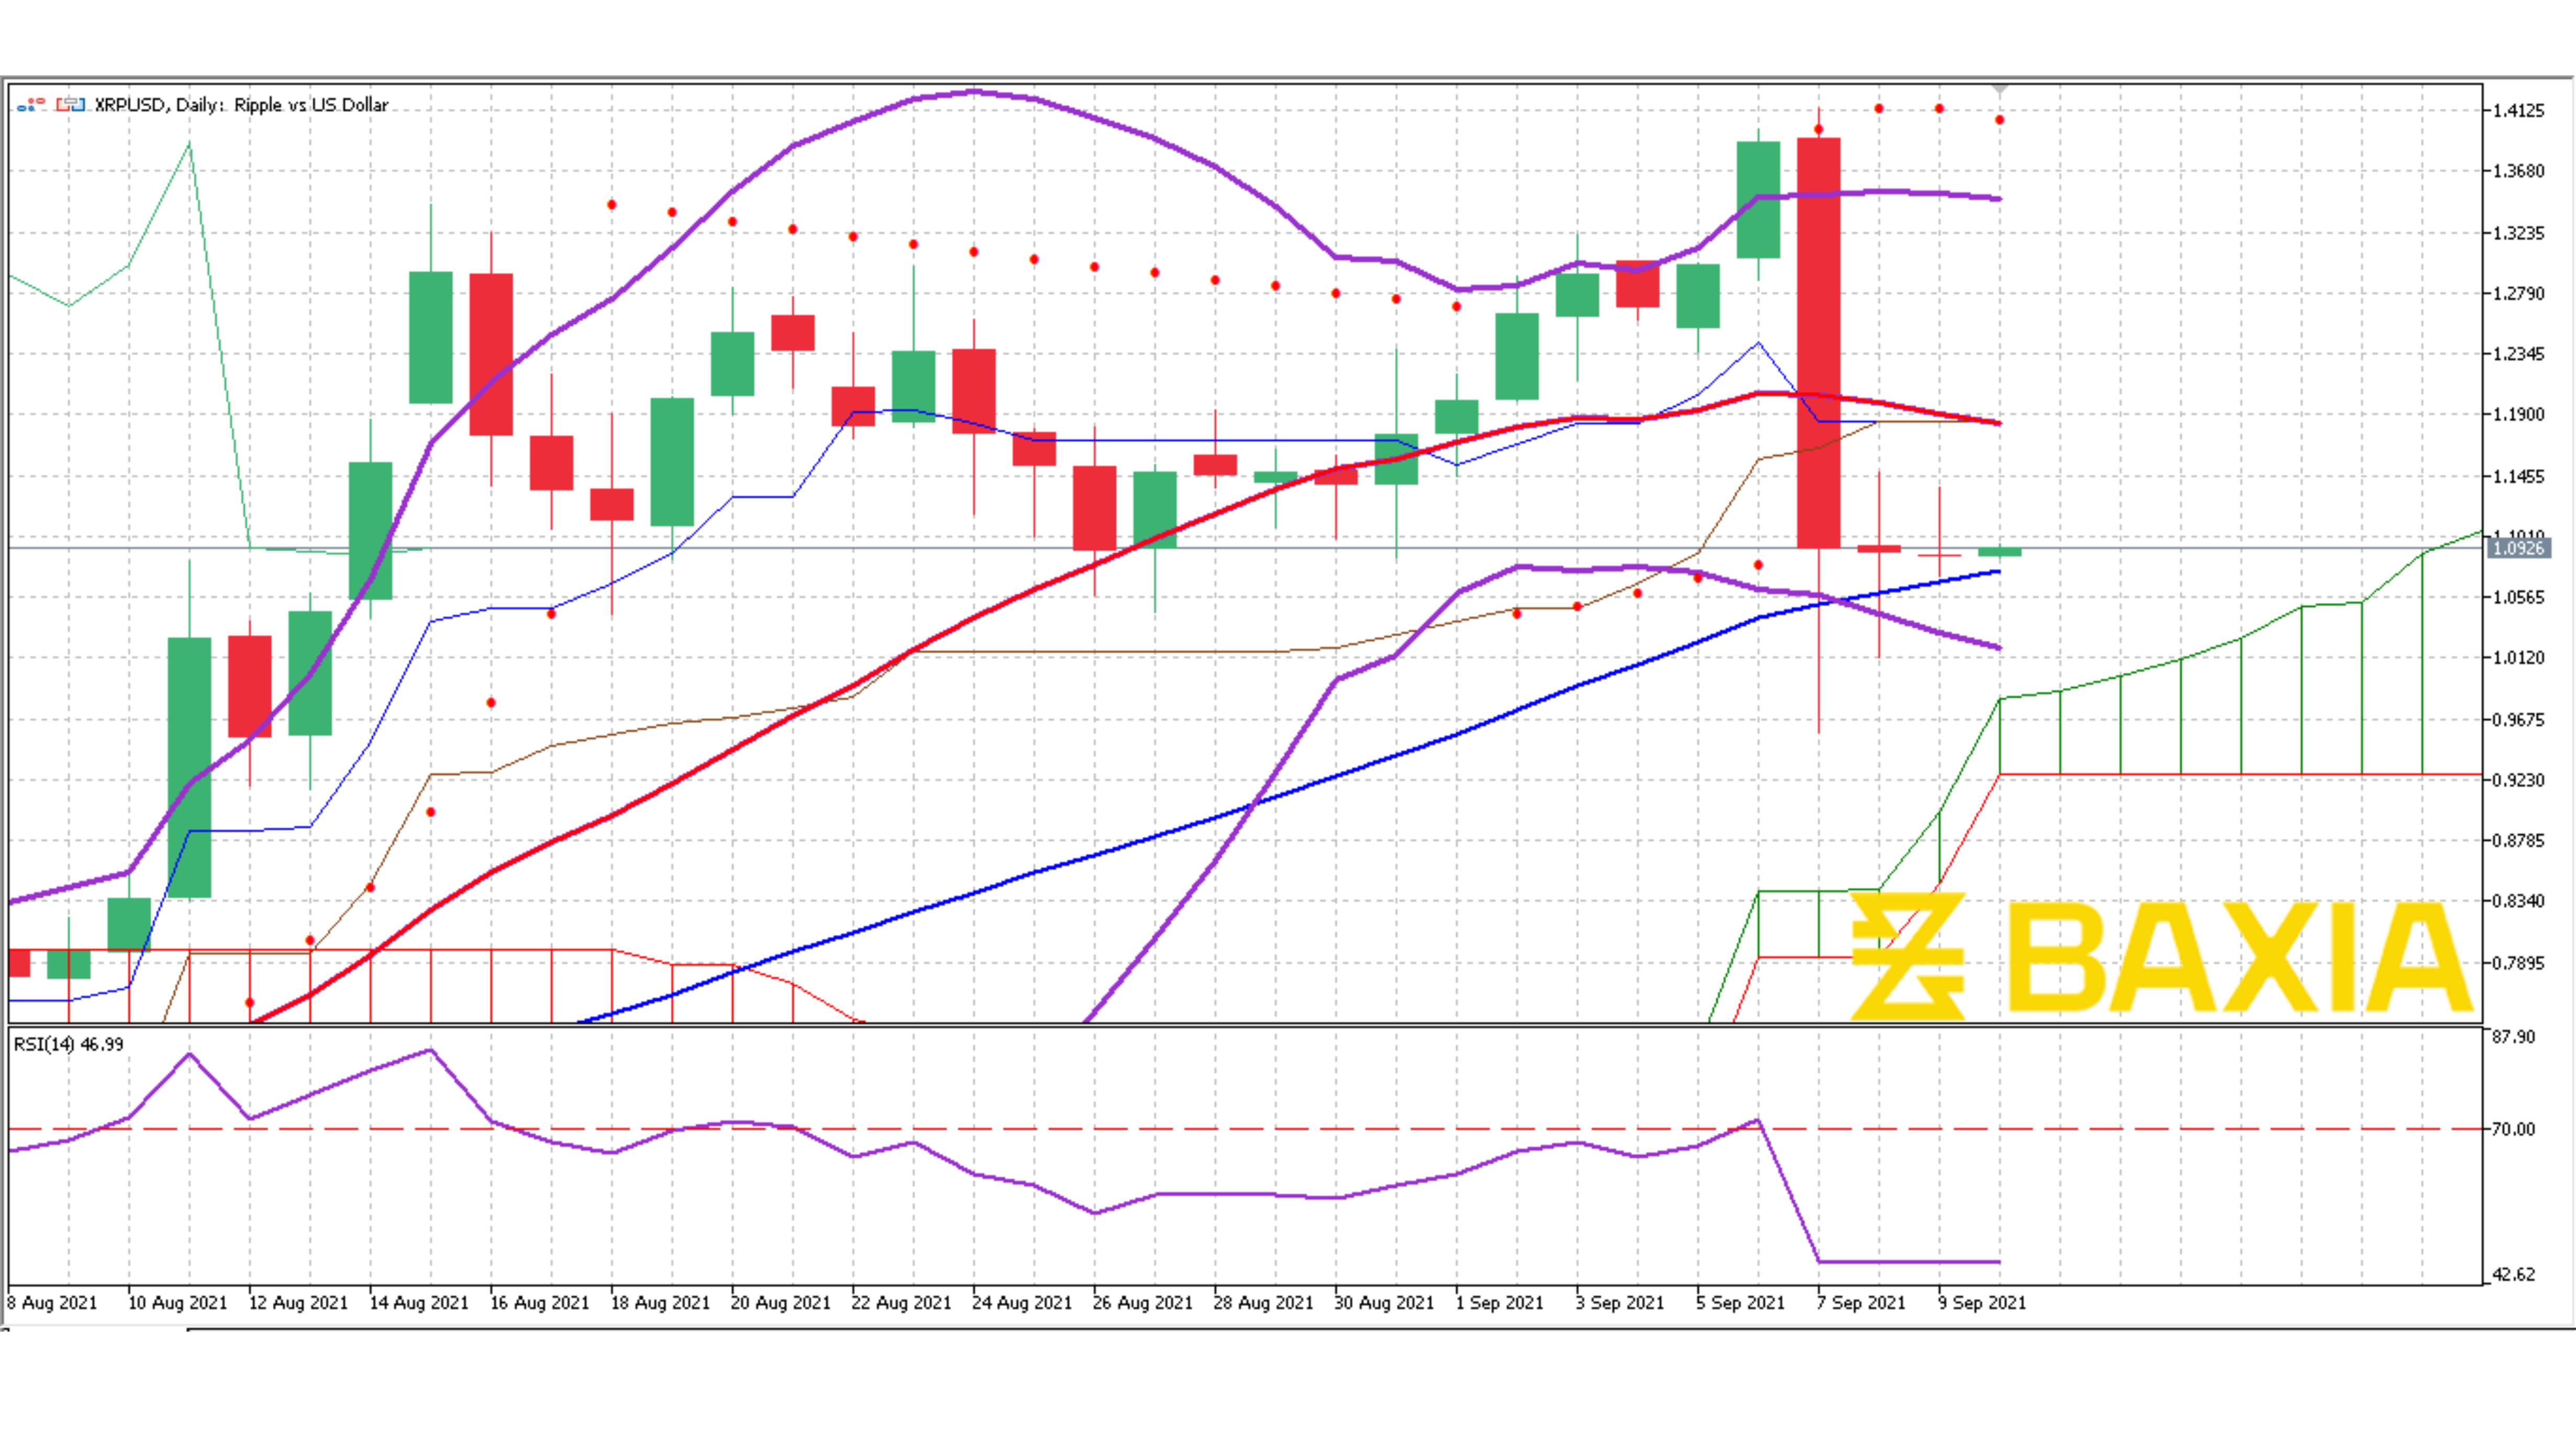
Our Parabolic SAR indicator suggests that the downtrend will continue in the short term; however, this is a lagging indicator. The gap between the short and long-term moving averages is decreasing, but they have not crossed yet; hence we cannot consider this downtrend as a reversal, only as a temporary pullback.
We love to hear new ideas from traders and want to know what you think!
If you like this topic and want to suggest future topics that you find helpful, let us know by clicking the ‘submit your feedback’ button below.

Trading foreign exchange on margin carries a high level of risk, and may not be suitable for all investors. Before deciding to trade foreign exchange you should carefully consider your investment objectives, level of experience, and risk appetite.
Nothing contained in this website should be construed as investment advice. Any reference to an investment's past or potential performance is not, and should not be construed as, a recommendation or as a guarantee of any specific outcome or profit.