
Ripple had three good sessions earlier this week where it made more than 18.5%; however, in the last two sessions, it has lost 7%, diminishing the previously gained ground.
It looked like the pair was going to reach the resistance level at $0.85378, which is at our 23.6% Fibonacci retracement, but it found another pullback. The pair has not been above this level in more than 16 days.
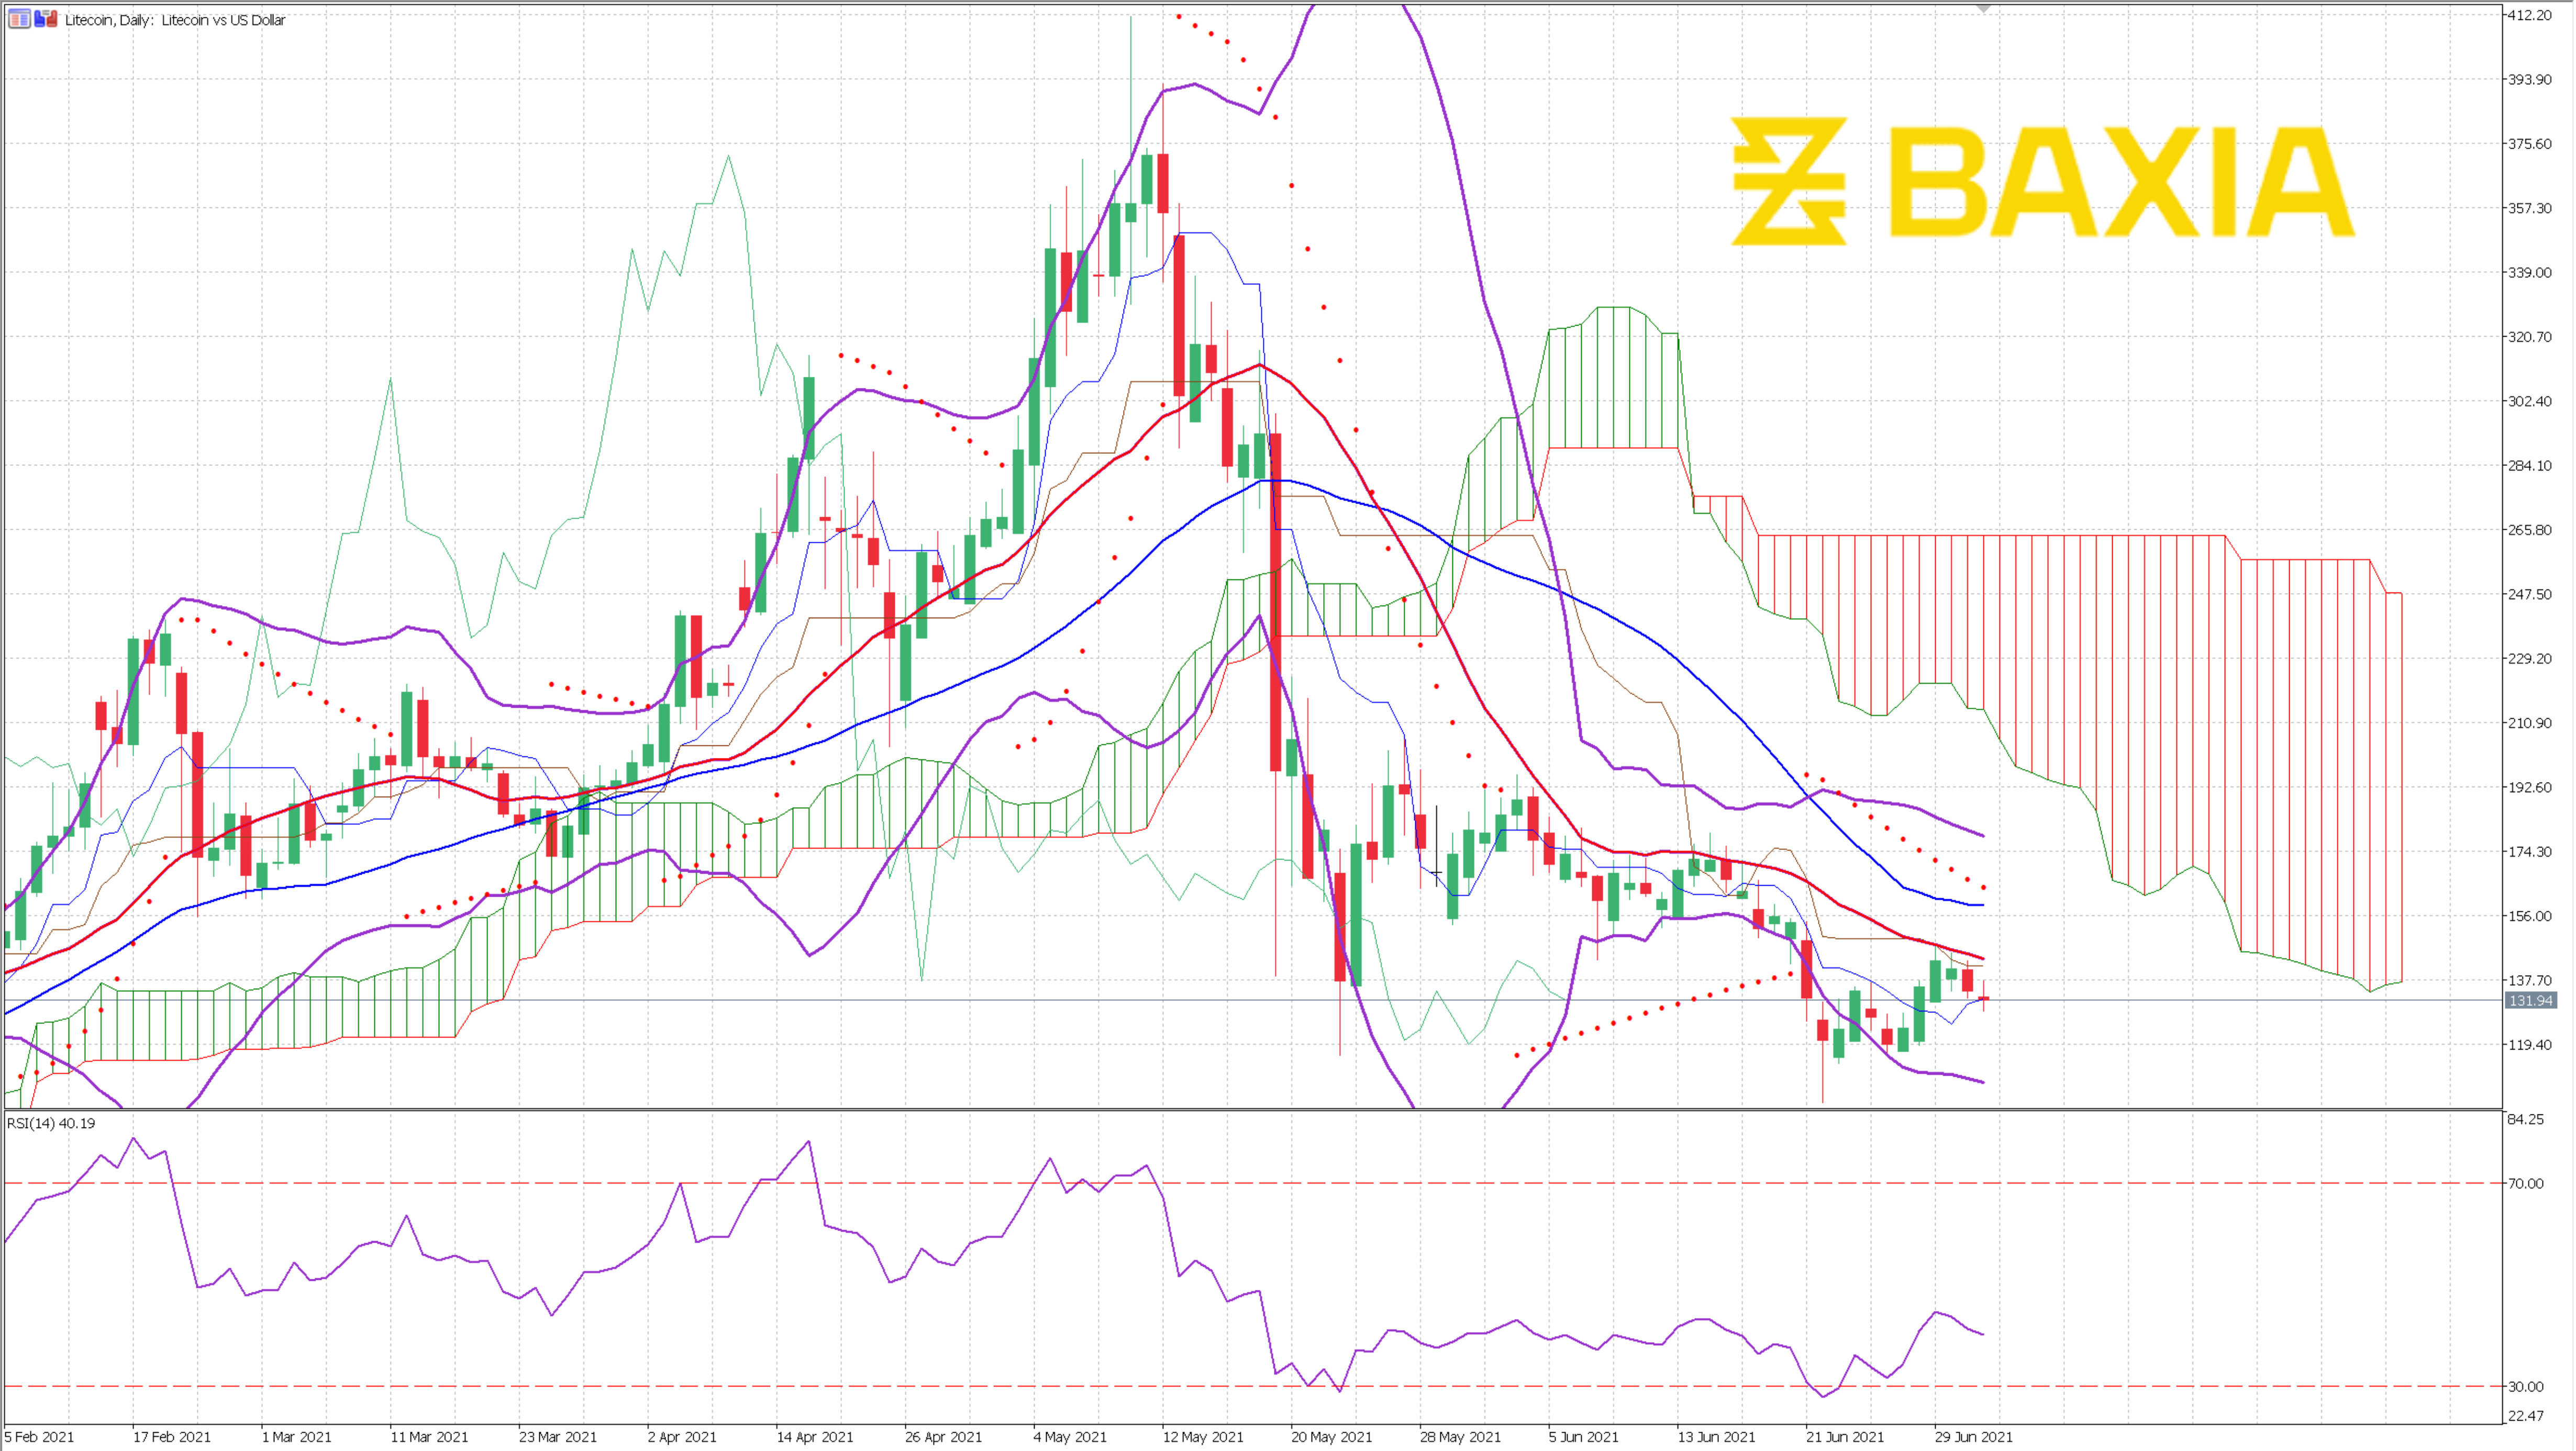
The Bollinger bands are open and moving downwards, indicating that the downtrend could continue. The price trades in between the bands suggesting that it is at an acceptable level.
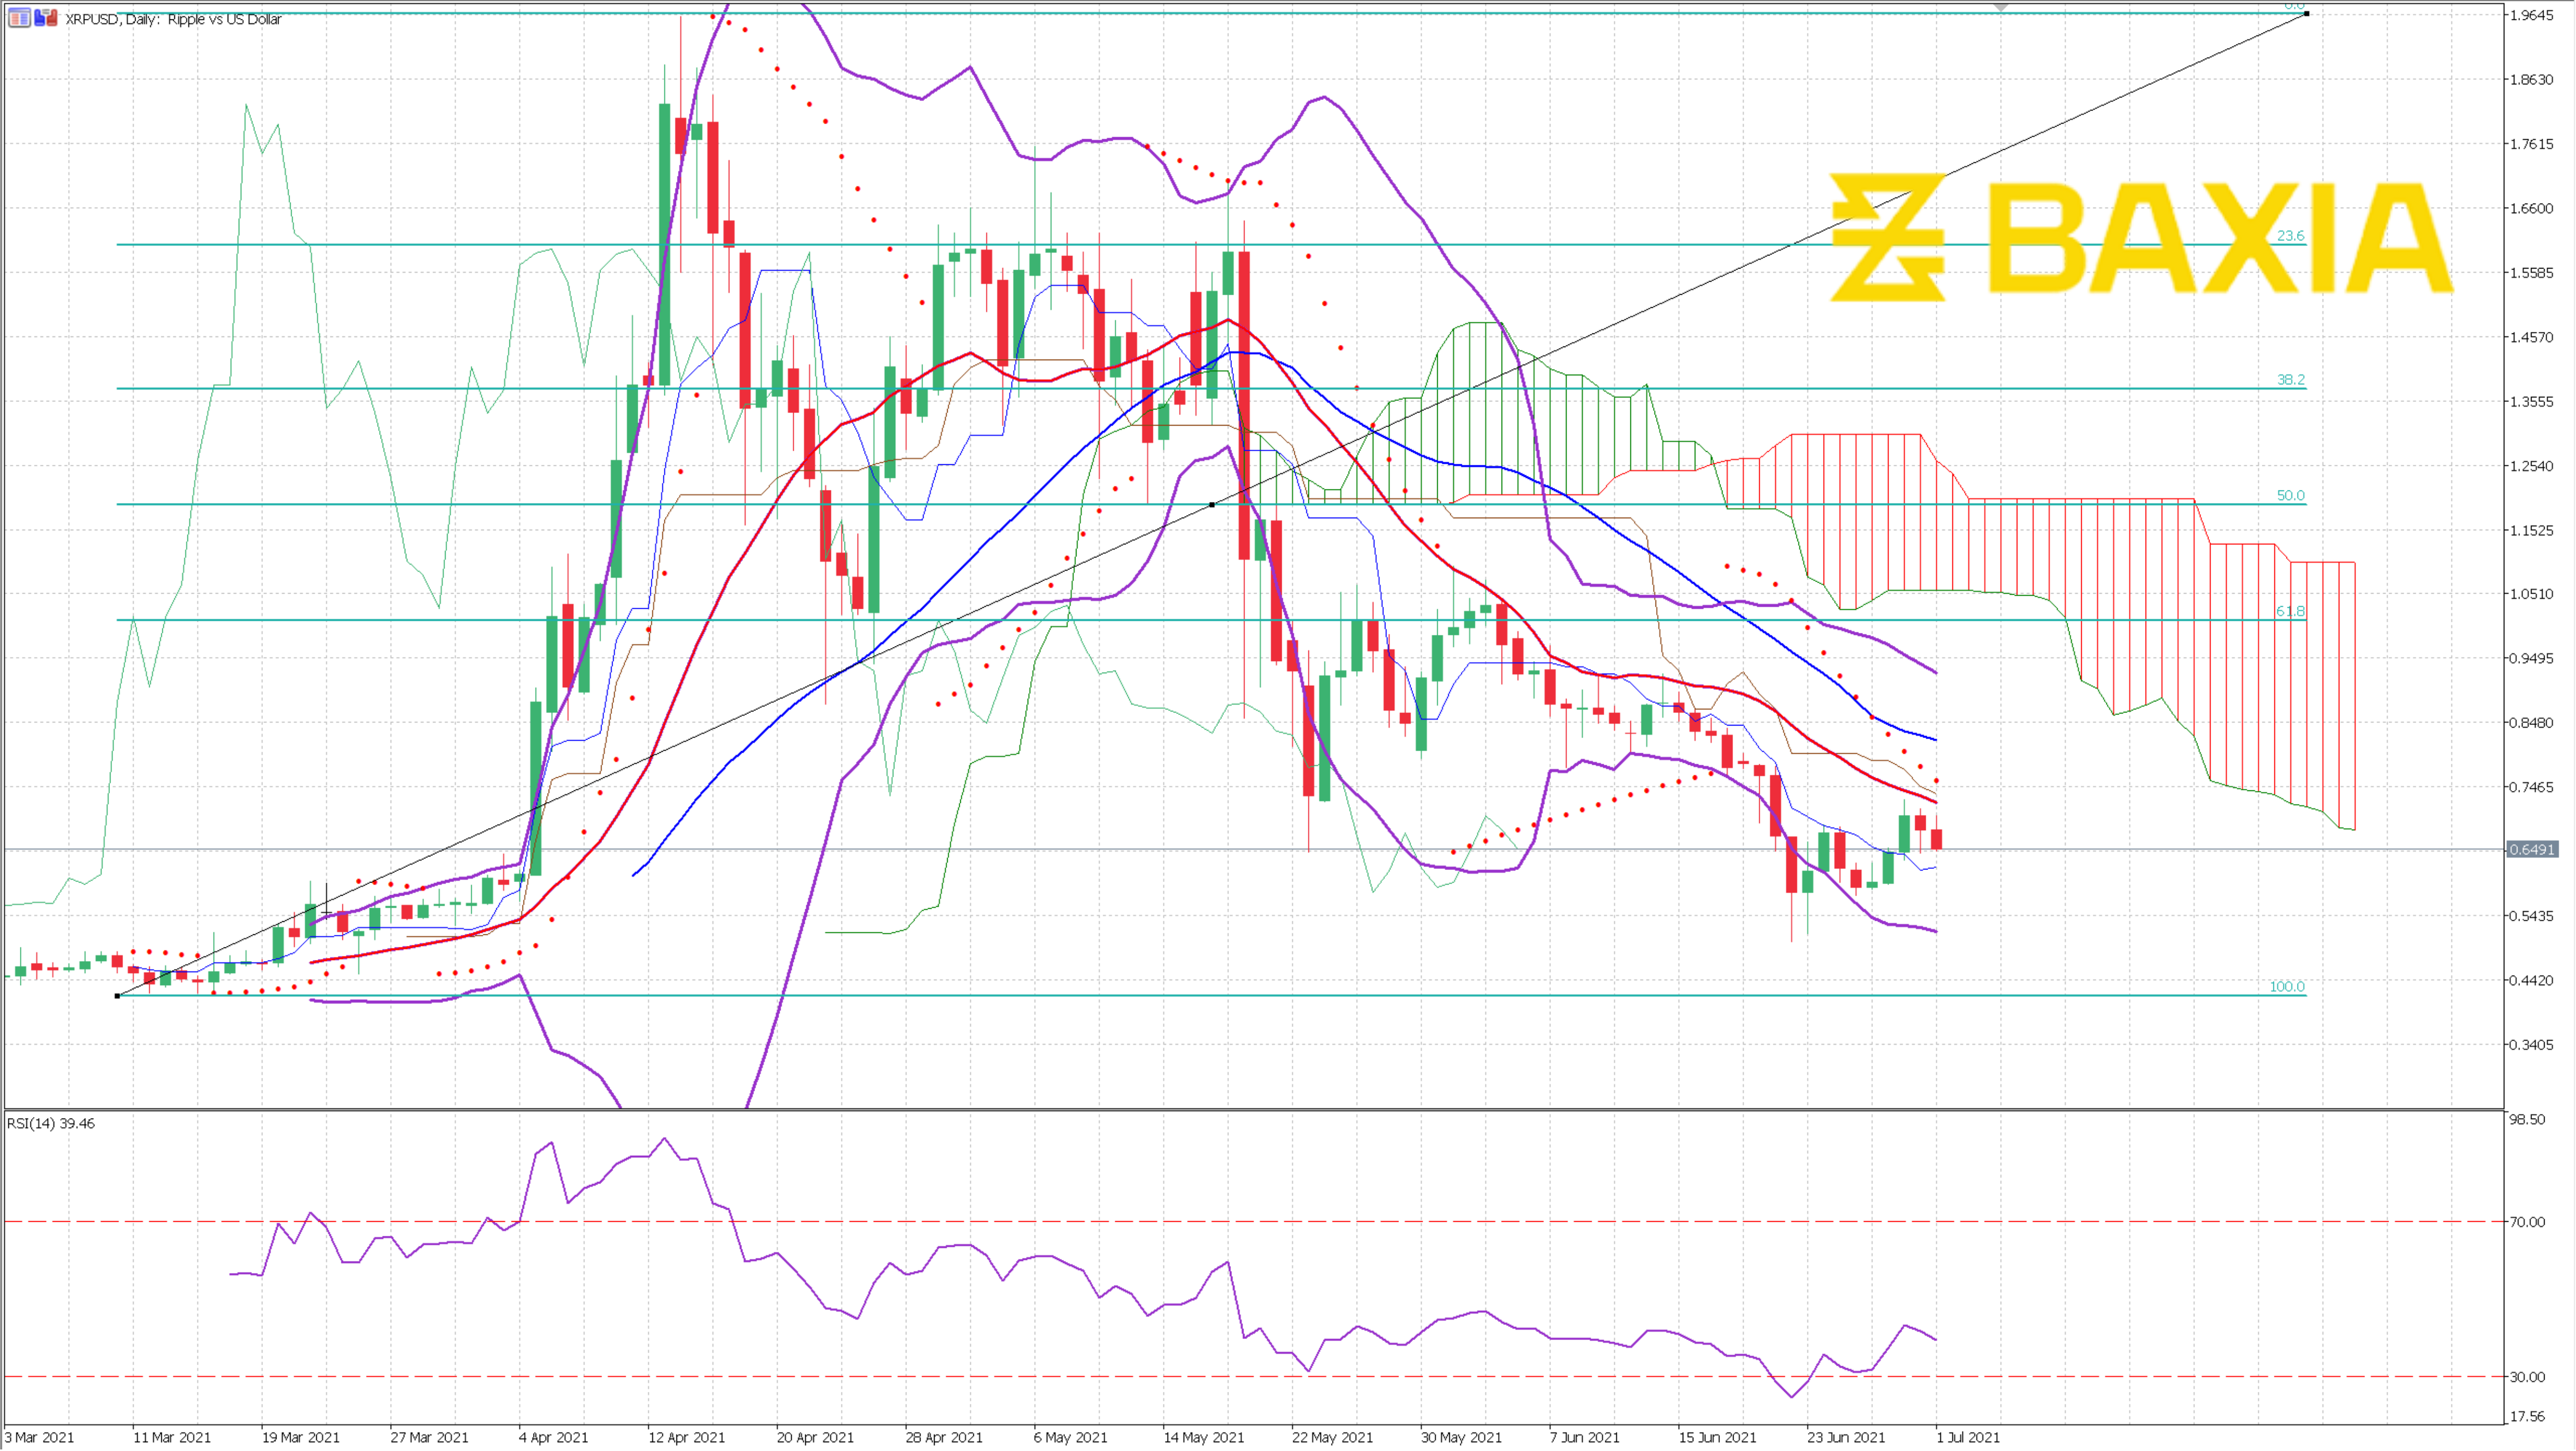
The relative strength index is currently at 41%. At this point, the pair could move in either direction. We have not seen the RSI above 43% in almost a month. Our parabolic SAR indicator suggests that the downtrend will continue.
The short and long-term moving averages continue moving downwards, and the spread within the lines keeps increasing; current price trades below both MA’s, which is a downtrend signal.
We love to hear new ideas from traders and want to know what you think!
If you like this topic and want to suggest future topics that you find helpful, let us know by clicking the ‘submit your feedback’ button below.

Trading foreign exchange on margin carries a high level of risk, and may not be suitable for all investors. Before deciding to trade foreign exchange you should carefully consider your investment objectives, level of experience, and risk appetite.
Nothing contained in this website should be construed as investment advice. Any reference to an investment's past or potential performance is not, and should not be construed as, a recommendation or as a guarantee of any specific outcome or profit.