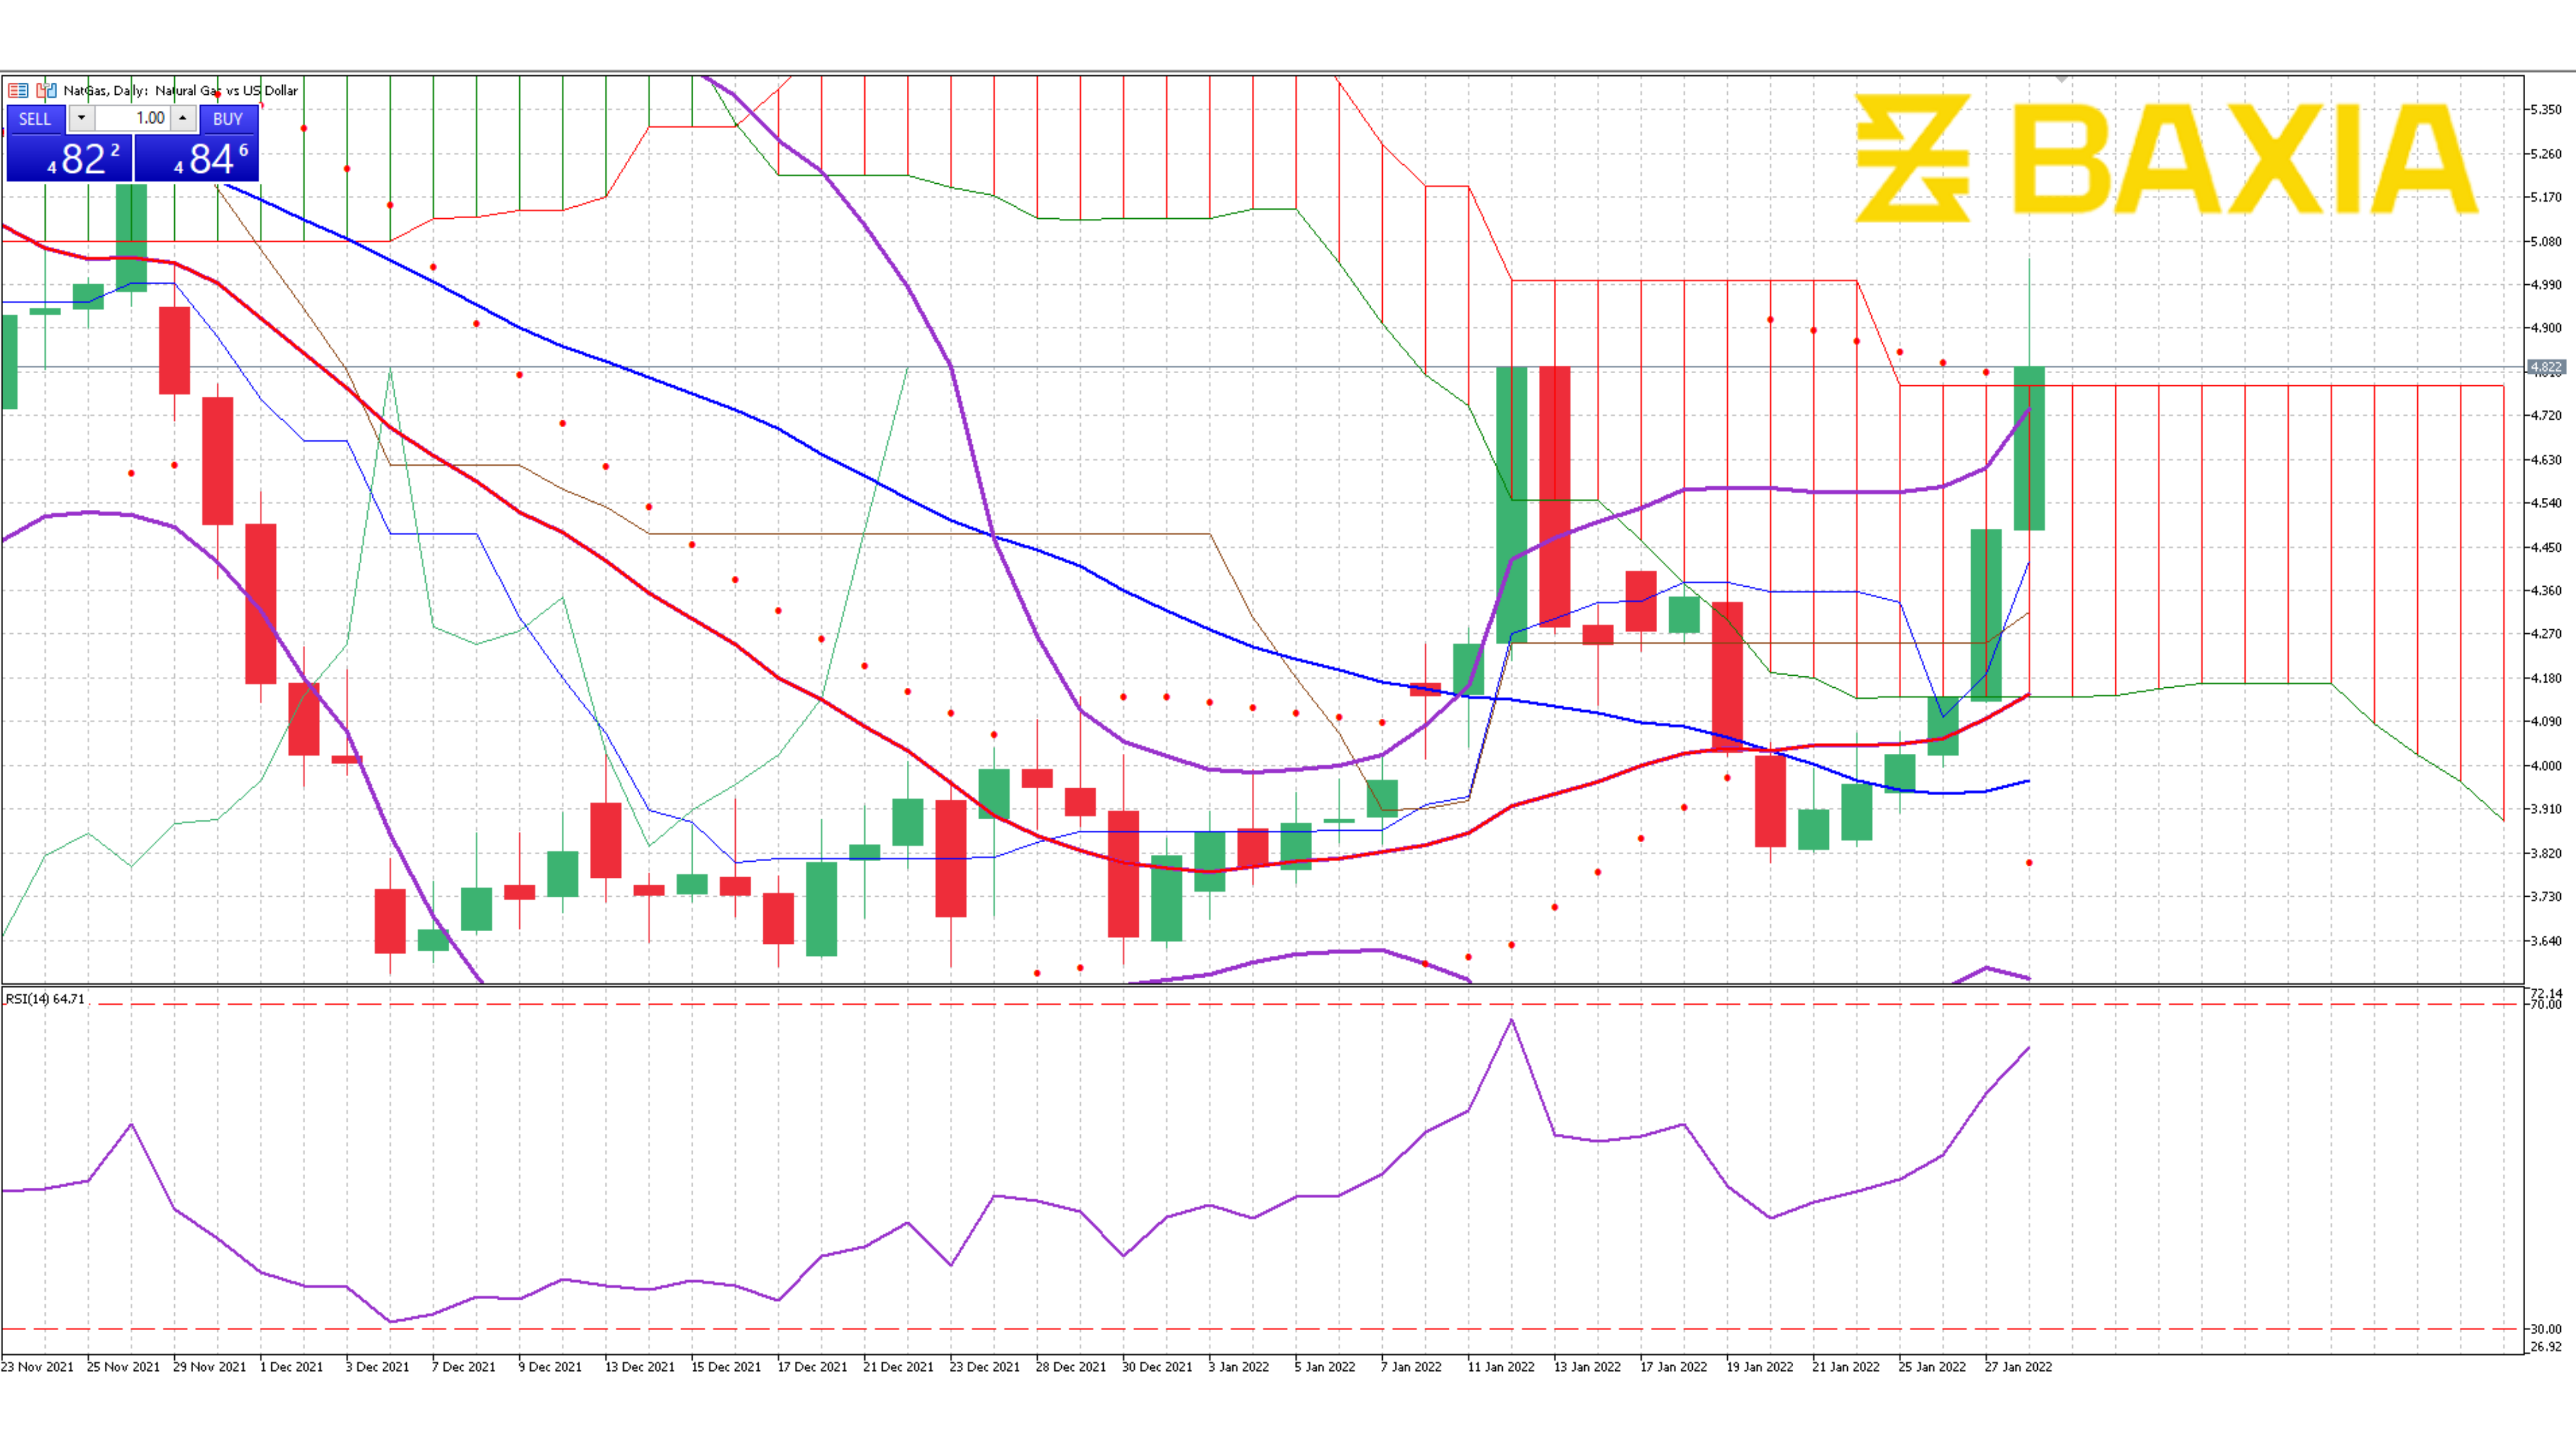

After reaching its highest level in more than seven years, the energy commodity lost 2.63% in one trading session. The pair reached $85.39, and it could break that level in the short to mid-term.
The Bollinger bands are closing up after the most recent loss; this indicates lower volatility and a potential price consolidation in the low 80's before we can see a breakout. The price traded very close to the upper band, considering it relatively high.
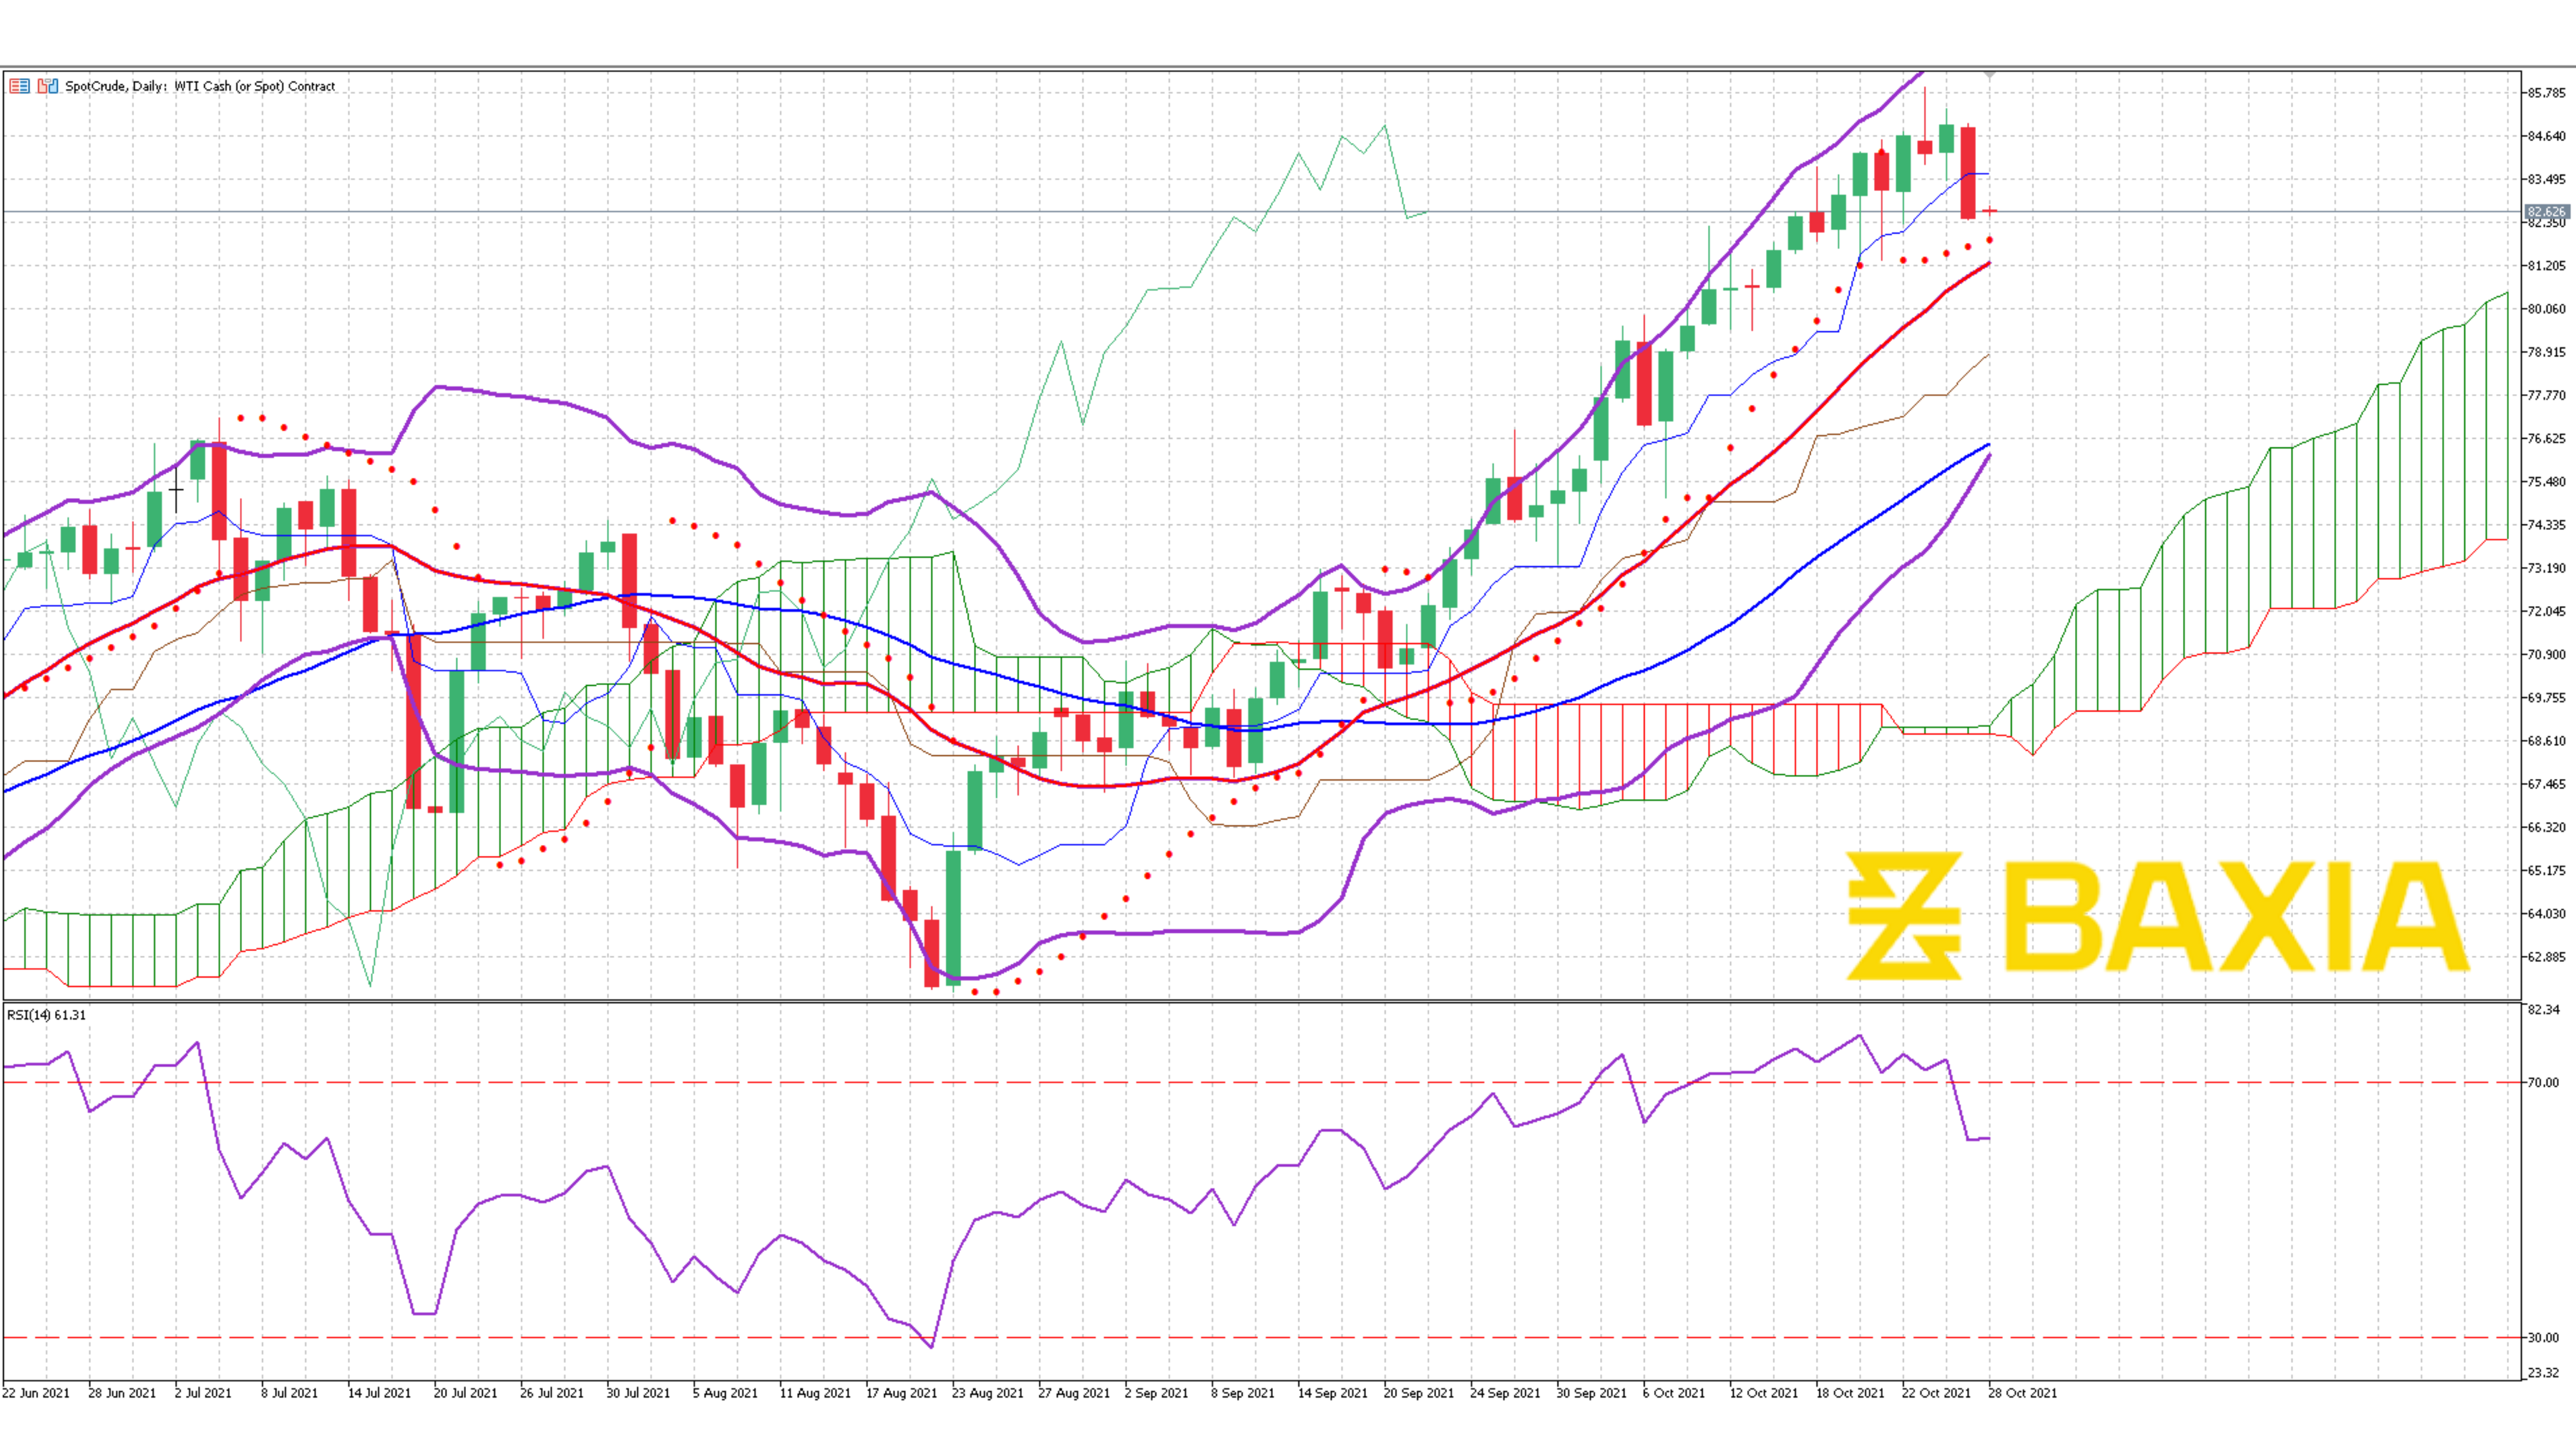
The relative strength index just recovered from an overbought status; another reason why we see a retracement in the price. The pair's RSI stayed overbought for more than 12 trading days. The retracement did not come as a surprise; it's natural for the price to drop back a few points after such a strong rally.
Our parabolic SAR indicator suggests that the price will continue to move upwards in the short term. However, we believe the price could enter a temporary consolidation period before breaking out or down.
We love to hear new ideas from traders and want to know what you think!
If you like this topic and want to suggest future topics that you find helpful, let us know by clicking the ‘submit your feedback’ button below.

Trading foreign exchange on margin carries a high level of risk, and may not be suitable for all investors. Before deciding to trade foreign exchange you should carefully consider your investment objectives, level of experience, and risk appetite.
Nothing contained in this website should be construed as investment advice. Any reference to an investment's past or potential performance is not, and should not be construed as, a recommendation or as a guarantee of any specific outcome or profit.