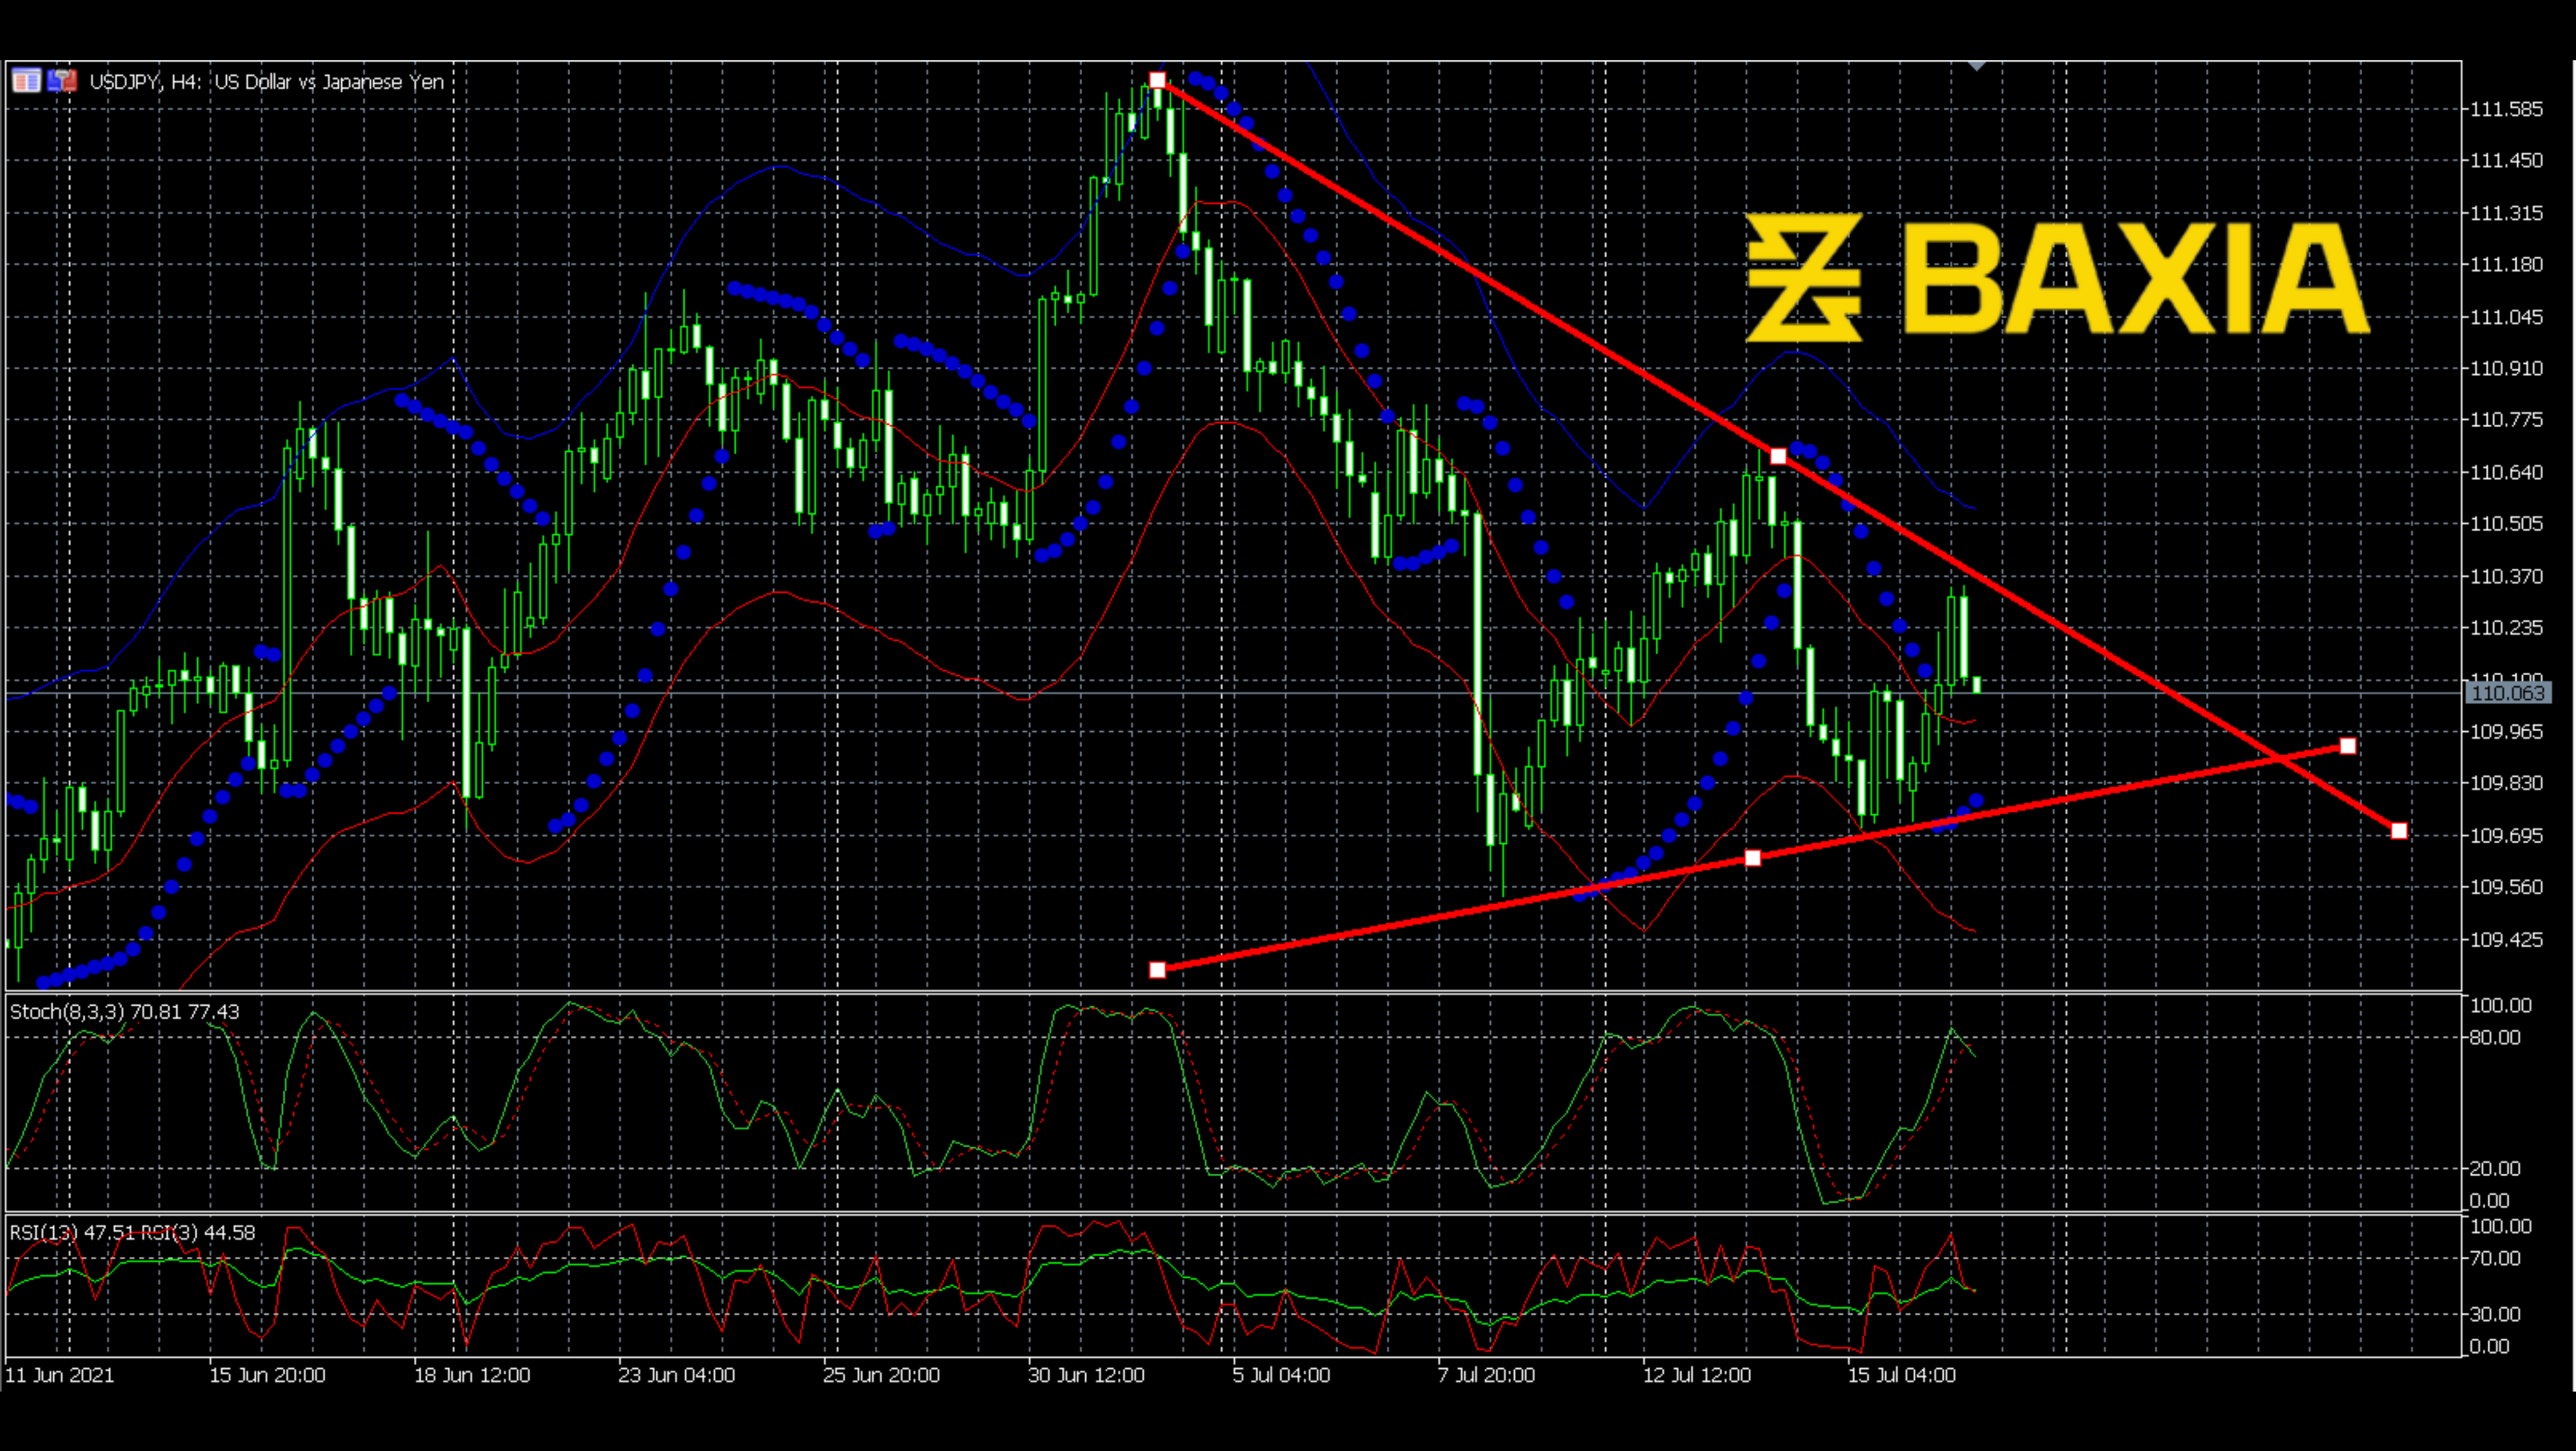

USDJPY has finished a bearish ABCD pattern. As we can see, this whole pattern took four days to complete. As we expected, the price started to go down after the pattern. However, recently, the price met support here around 110.50; will the price continue to go down?
The price now reached the 61.8% Fibonacci level of the previous bearish ABCD pattern. The 61.8% level refers to comparatively high pressure, which could change the direction of the price line; looking at the price now shows that holds true. The price started to fluctuate, and we can catch an upward trend beginning here.
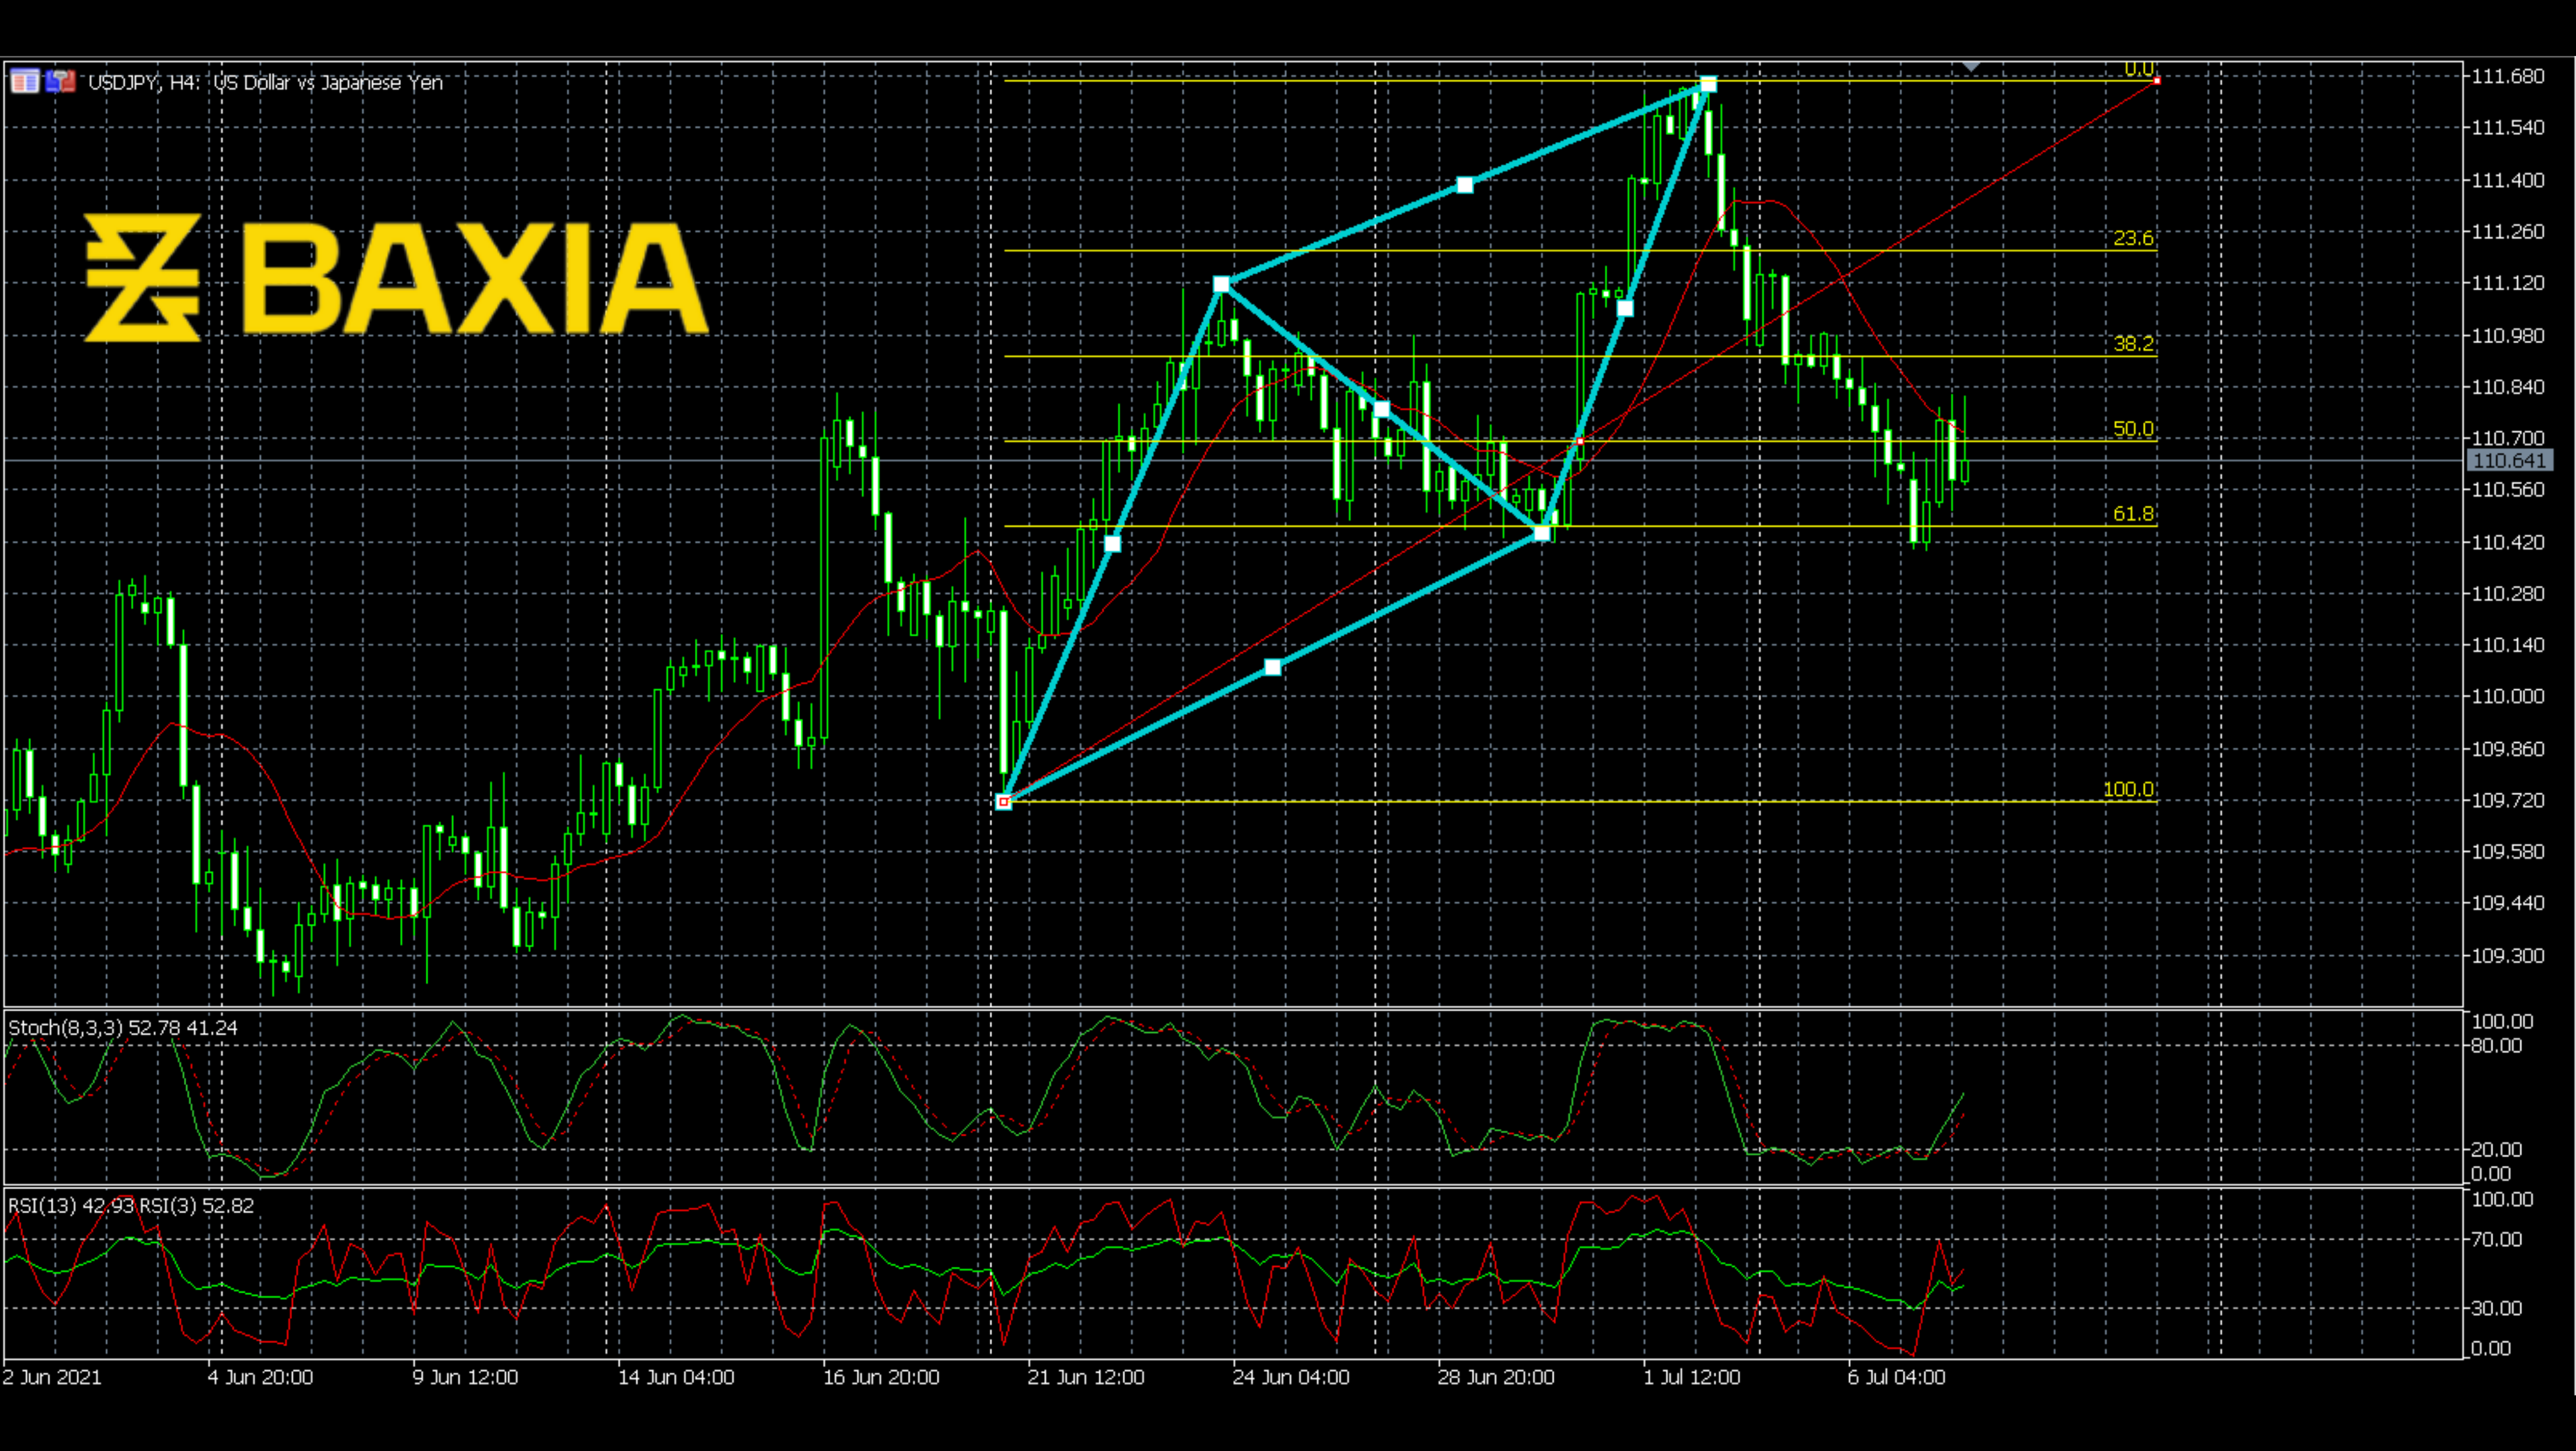
The stochastics are at a perfect point, not overbought, no oversold. Two lines just in an upward trend and make a stable bullish signal. Also, the RSI shows the same situation. Although two lines seemed to cross, they separated all of a sudden, still making a bullish signal.
The big picture of USDJPY is an upward one, and the bearish ABCD pattern was just a wave; it could not change the total direction of the price line. Now the price is back in an upward trend.
We love to hear new ideas from traders and want to know what you think!
If you like this topic and want to suggest future topics that you find helpful, let us know by clicking the ‘submit your feedback’ button below.

Trading foreign exchange on margin carries a high level of risk, and may not be suitable for all investors. Before deciding to trade foreign exchange you should carefully consider your investment objectives, level of experience, and risk appetite.
Nothing contained in this website should be construed as investment advice. Any reference to an investment's past or potential performance is not, and should not be construed as, a recommendation or as a guarantee of any specific outcome or profit.