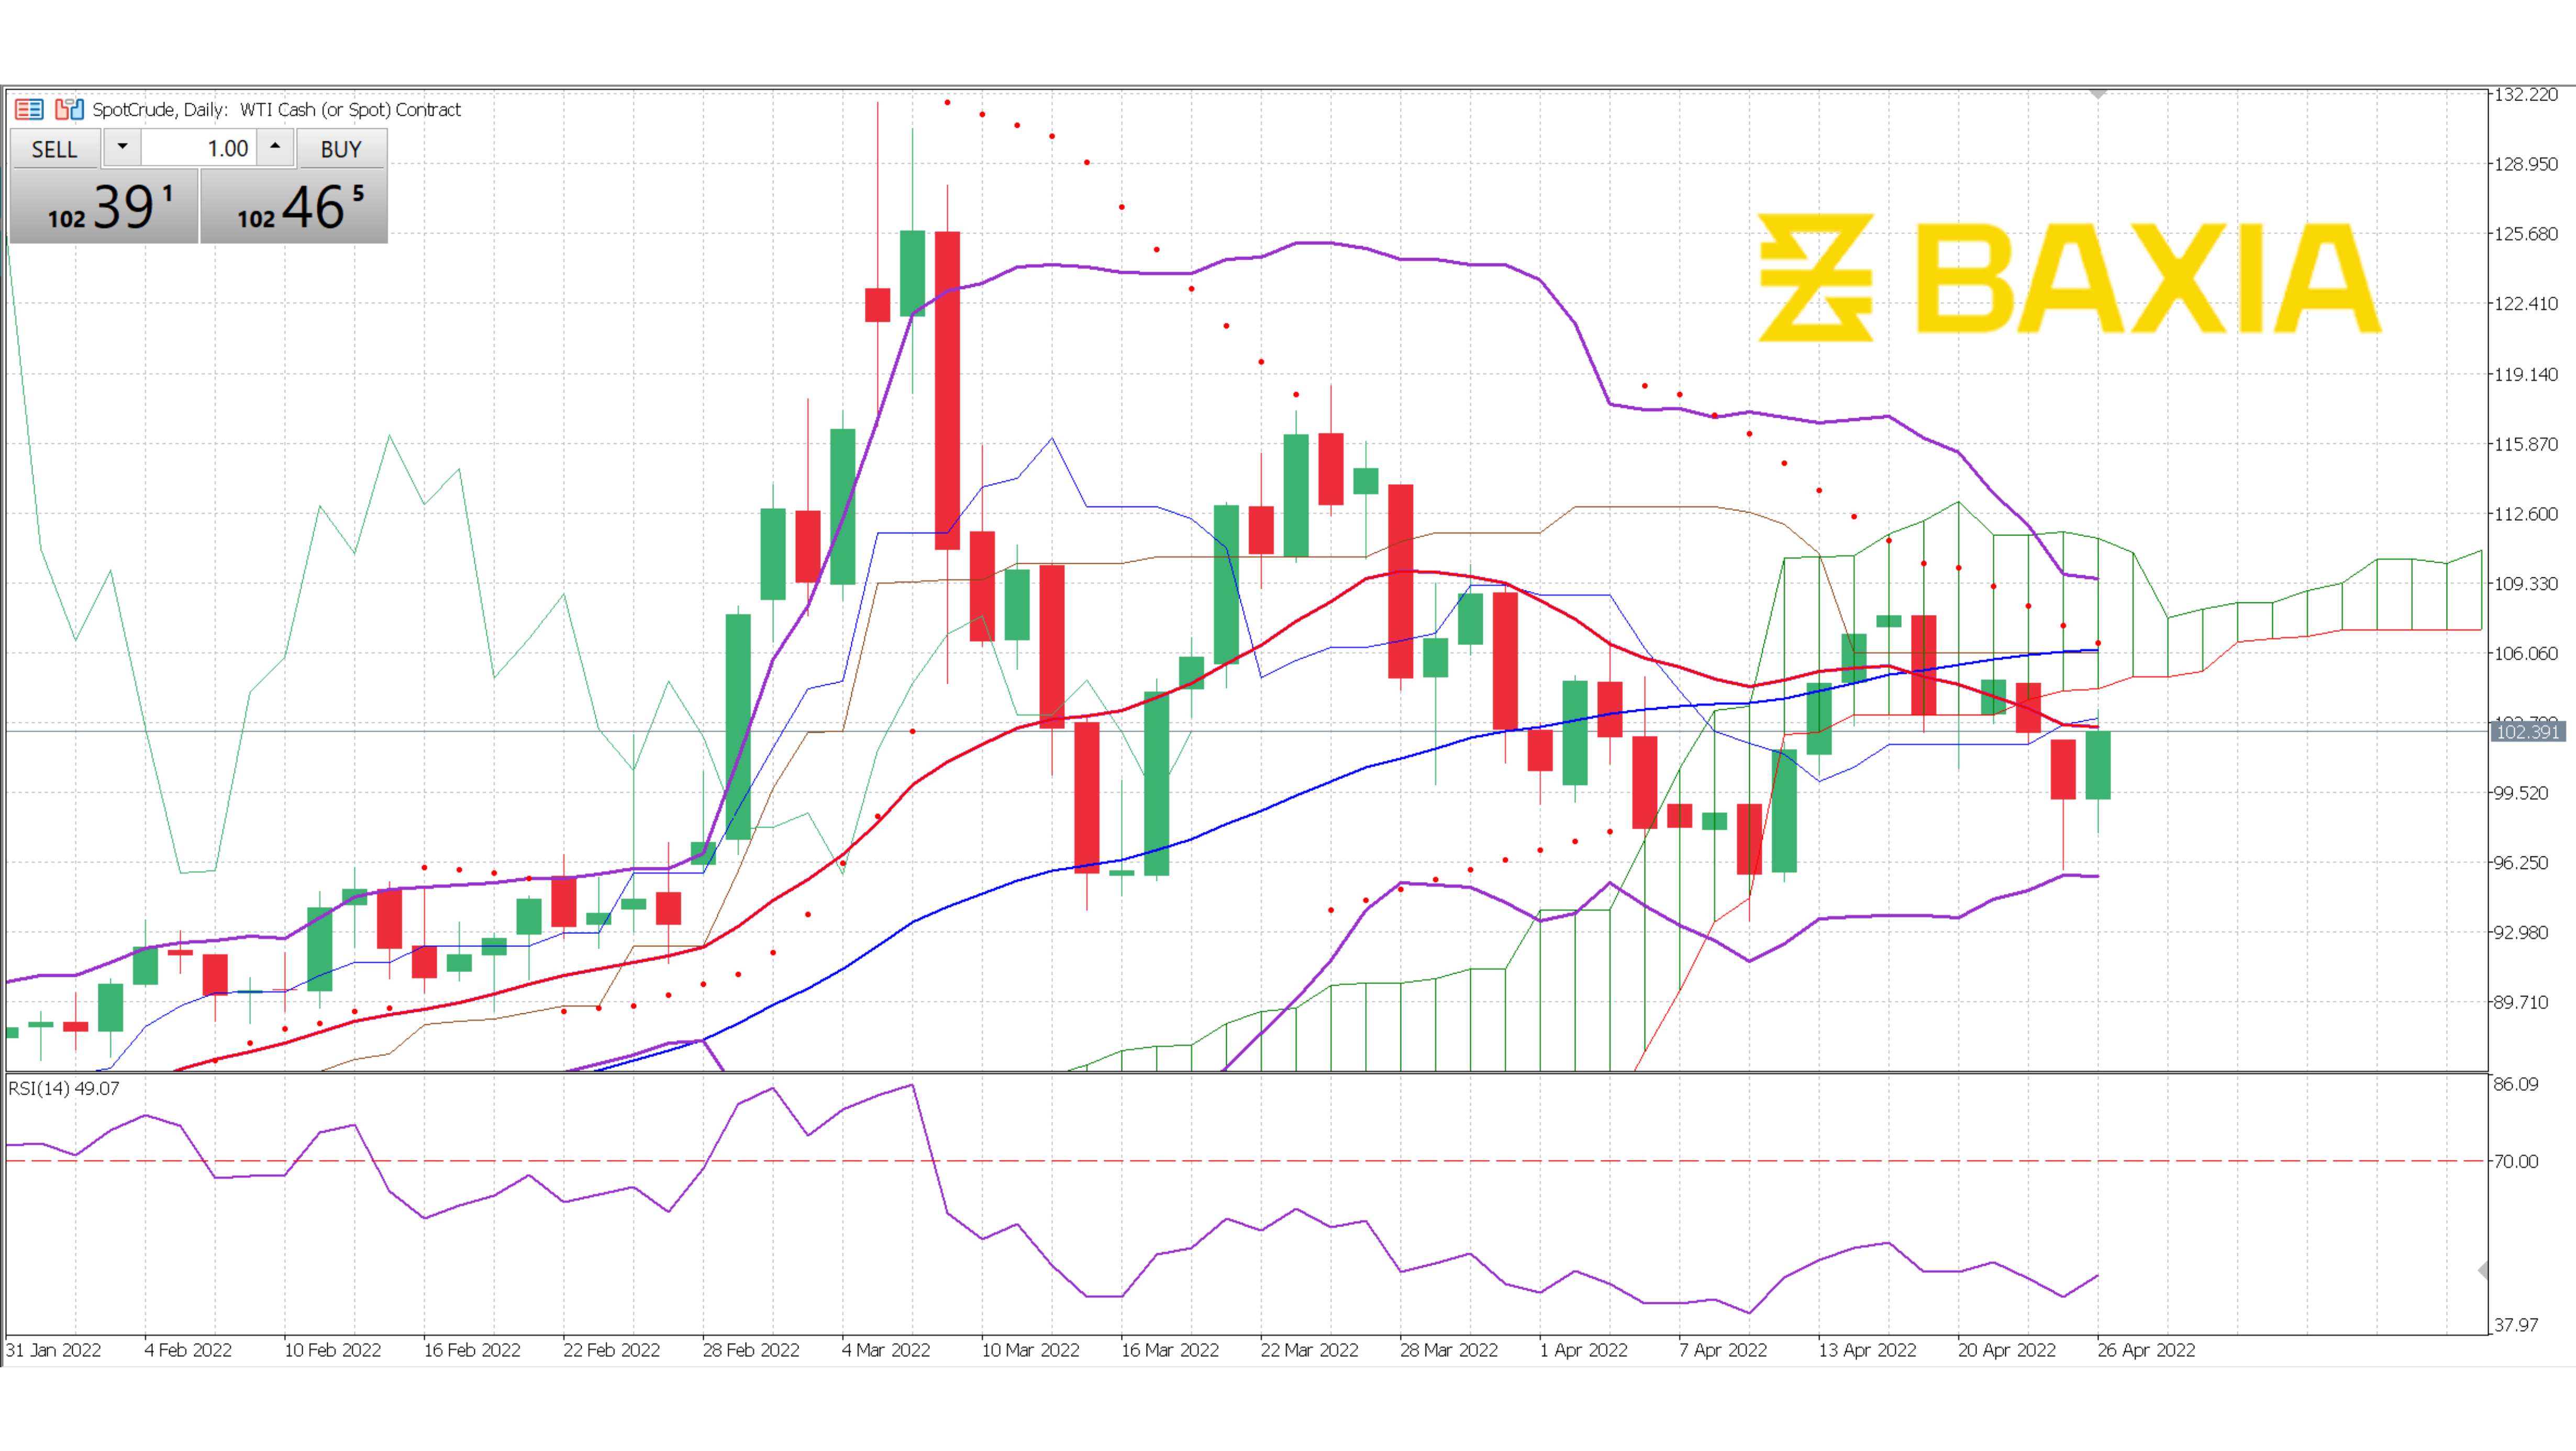

The energy commodity could resume the rally it started in early March after finding support at $92, close to our 50% Fibonacci retracement, possibly one of the most important retracement levels as it often signifies a trend reversal when crossed. The pair trades below the short and long-term moving averages, suggesting that the downwards trend could continue, but today's performance is going to make it difficult.
The Bollinger bands are slightly closing down, volatility should still be high in the upcoming trading sessions, but it might diminish as the bands get narrower. The pair traded in between the bands, suggesting that the price is at a relatively fair level. XTI is likely to make a breakout attempt on the 38.2% retracement at $100.72
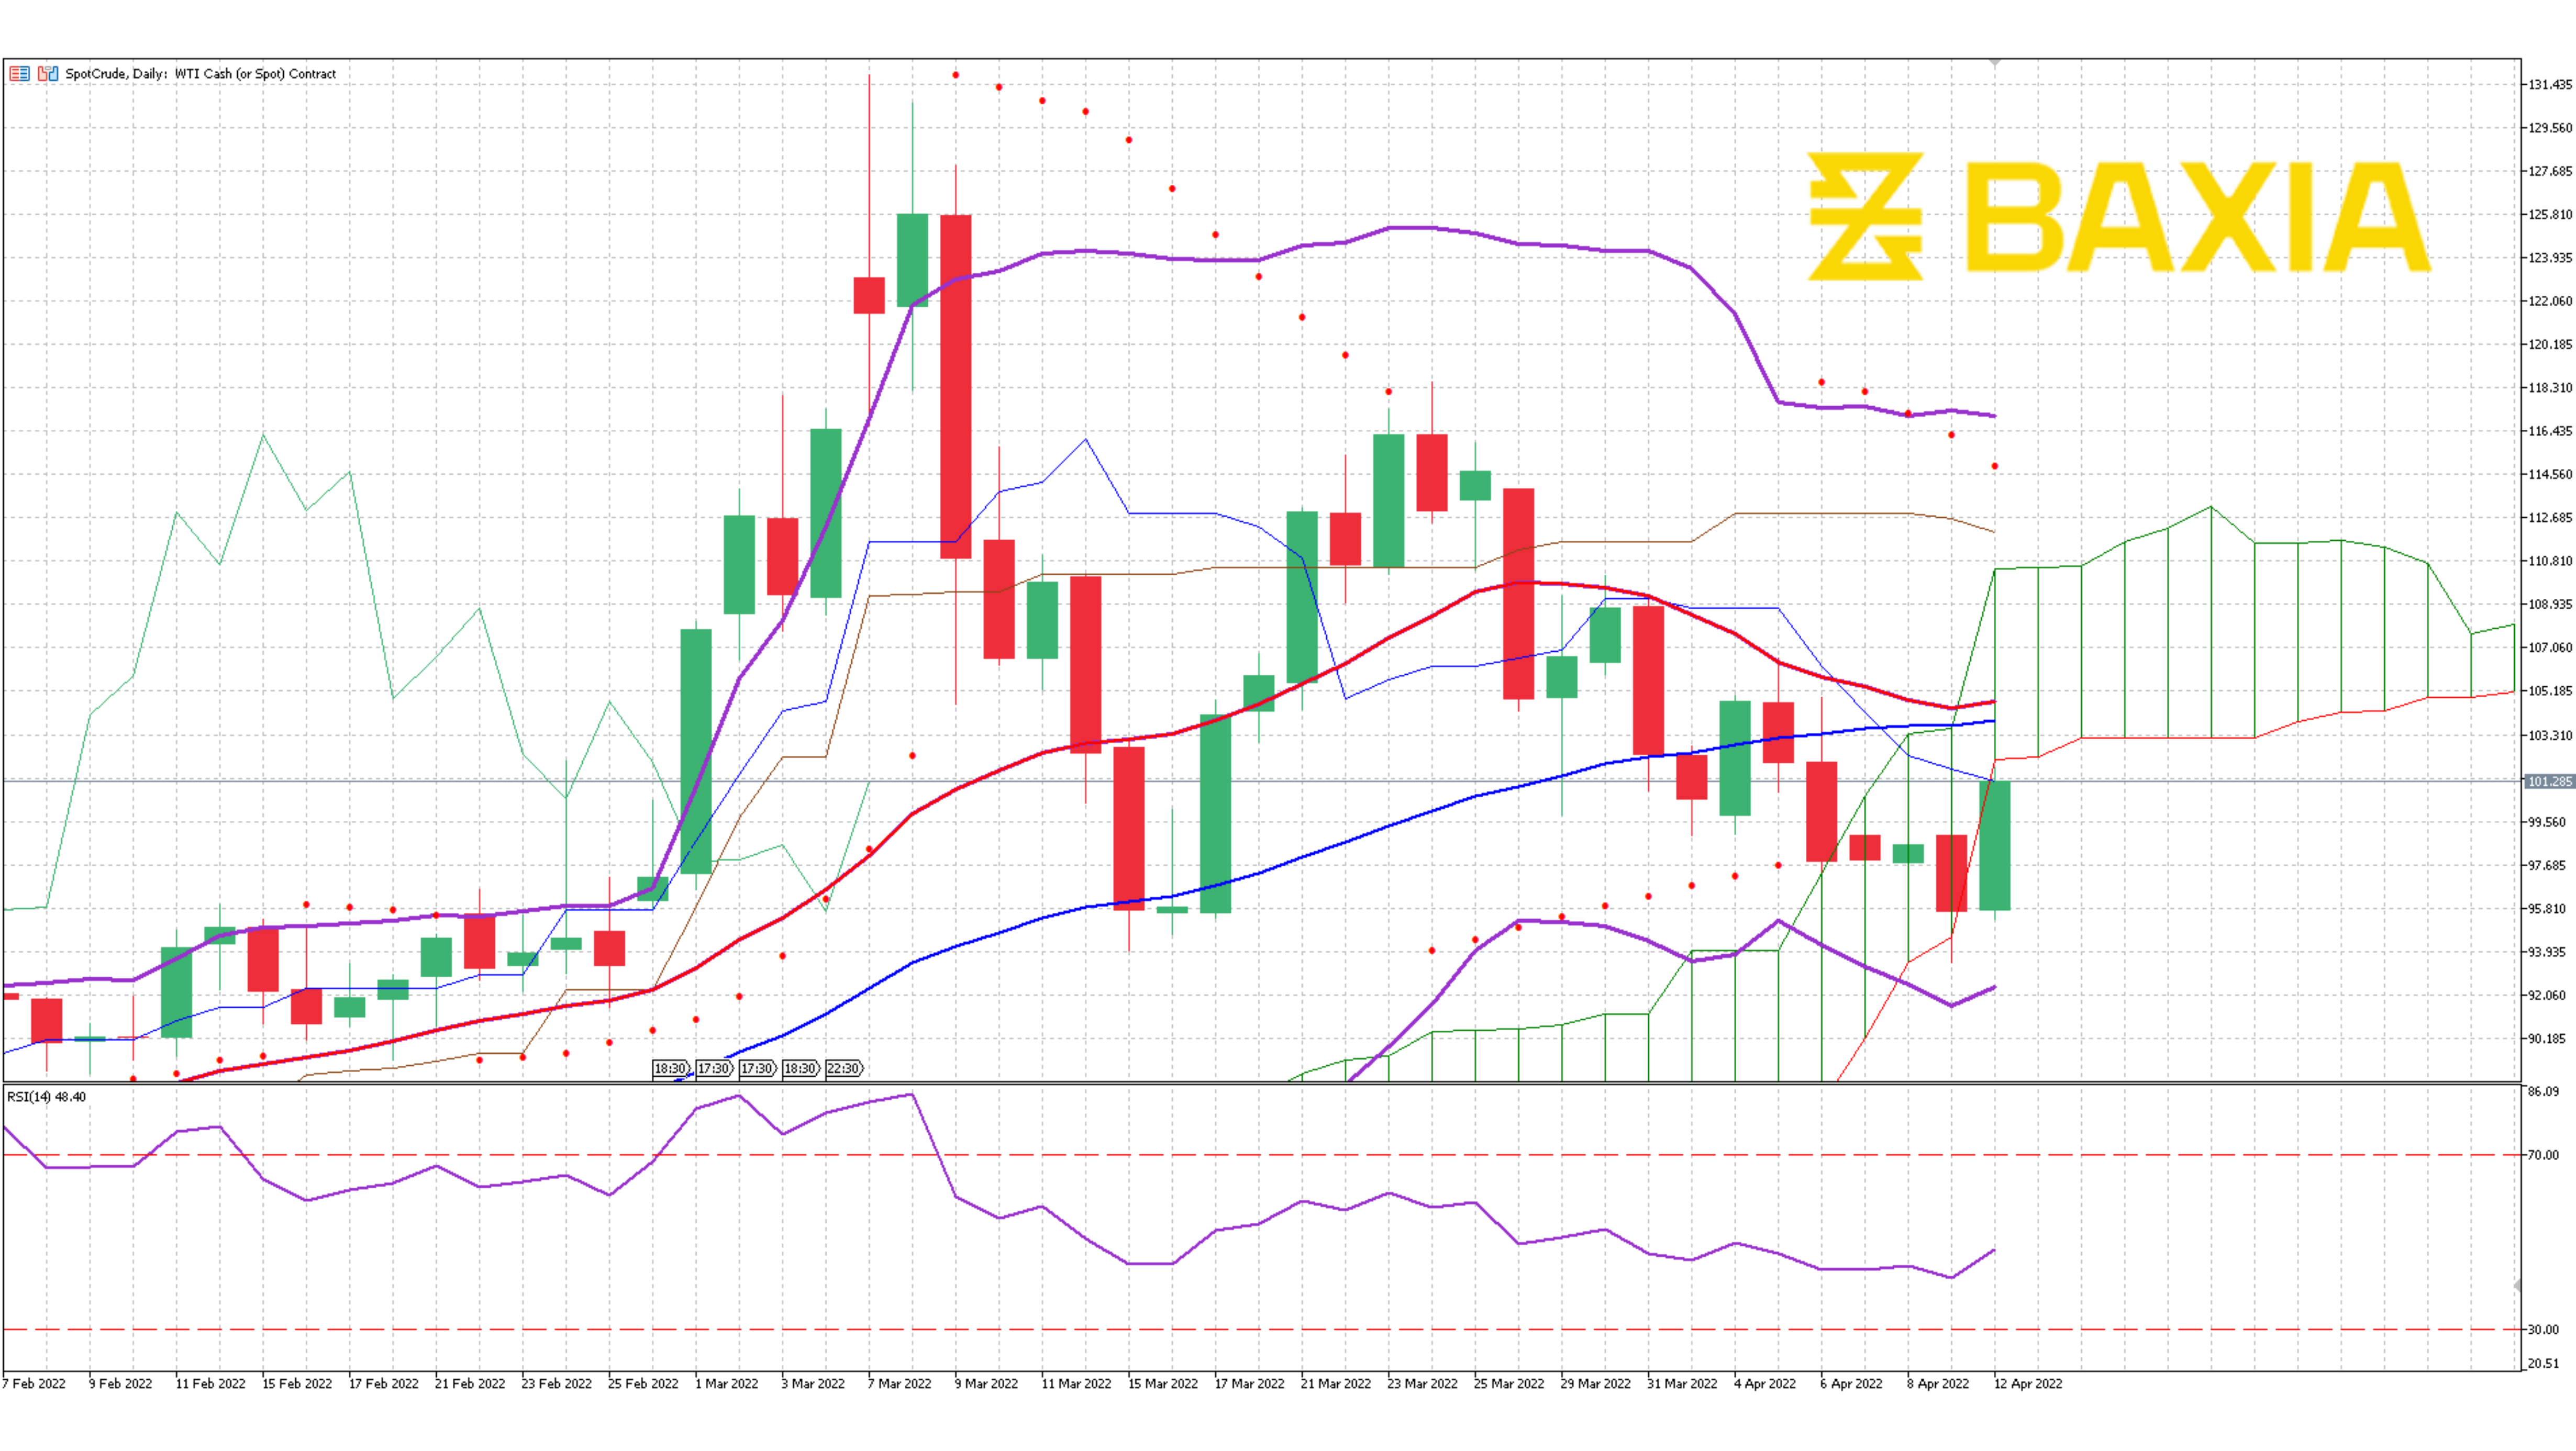
The relative strength index is at 47% which will allow the pair to move in either direction, more likely upwards after today’s session, if the price manages to complete the breakout on 100.72, we would expect the price to continue rising in the short term and possibly get back in the mid 100’s soon.
We love to hear new ideas from traders and want to know what you think!
If you like this topic and want to suggest future topics that you find helpful, let us know by clicking the ‘submit your feedback’ button below.

Trading foreign exchange on margin carries a high level of risk, and may not be suitable for all investors. Before deciding to trade foreign exchange you should carefully consider your investment objectives, level of experience, and risk appetite.
Nothing contained in this website should be construed as investment advice. Any reference to an investment's past or potential performance is not, and should not be construed as, a recommendation or as a guarantee of any specific outcome or profit.