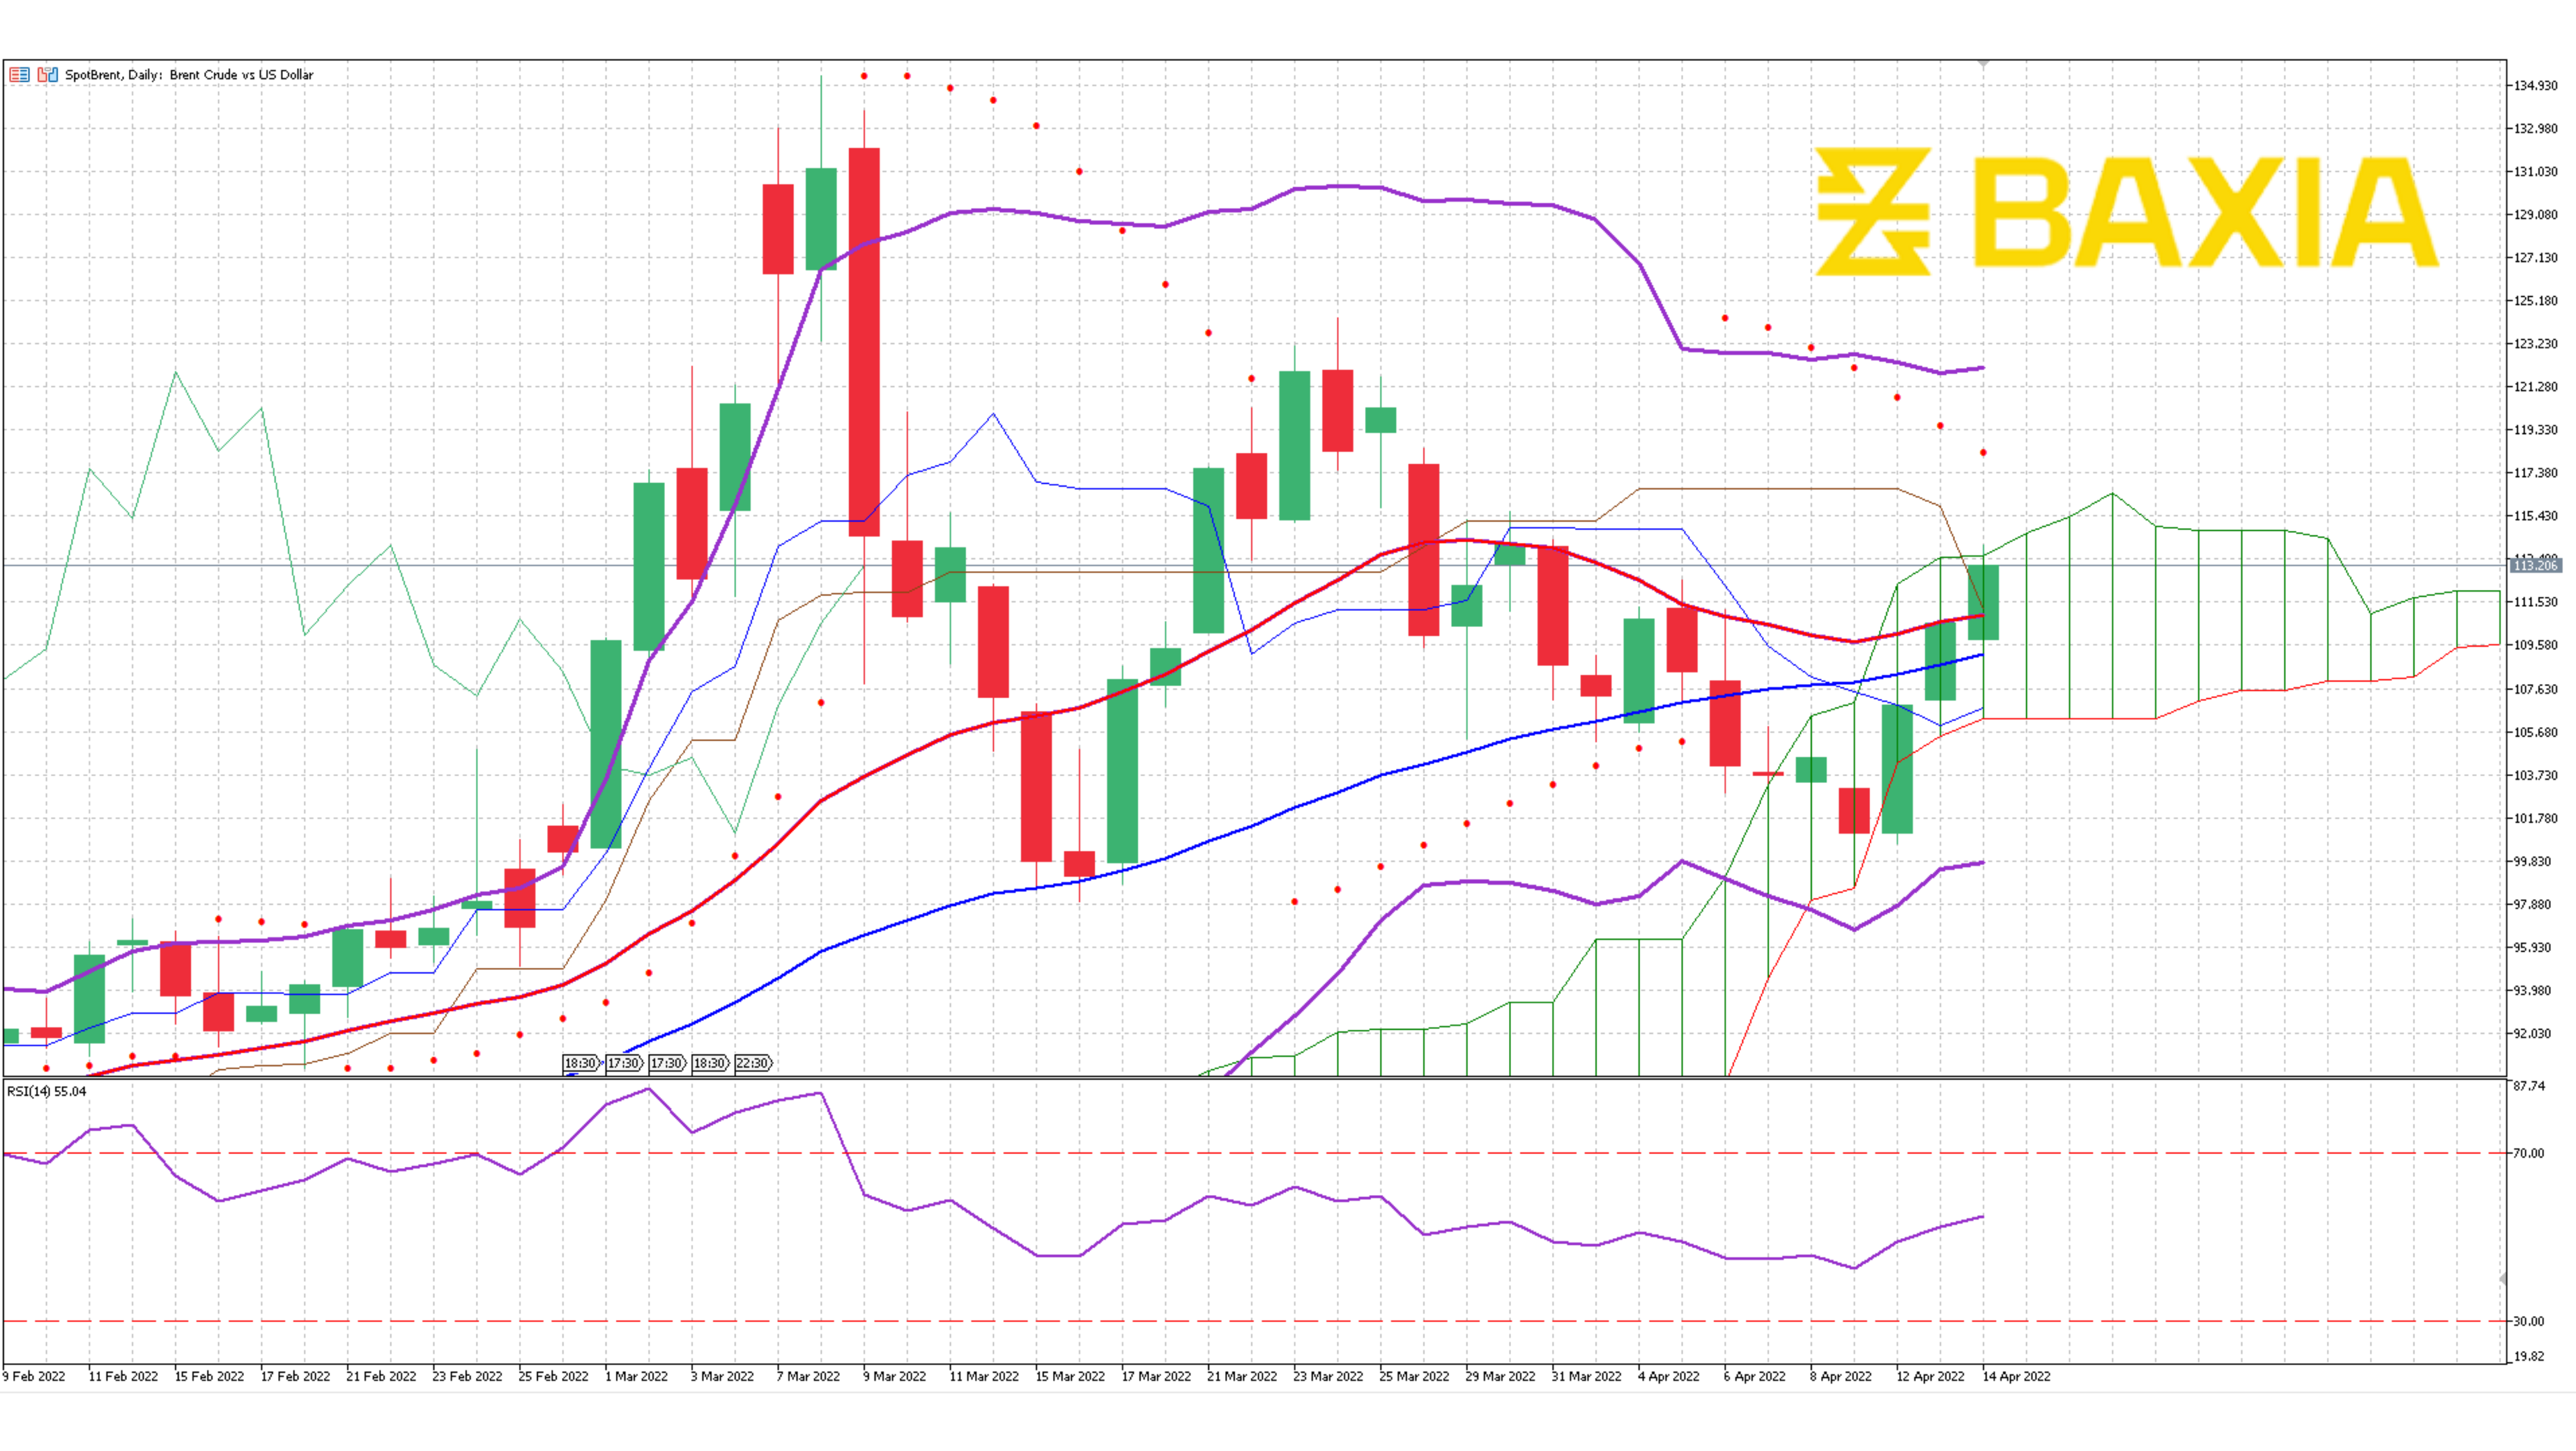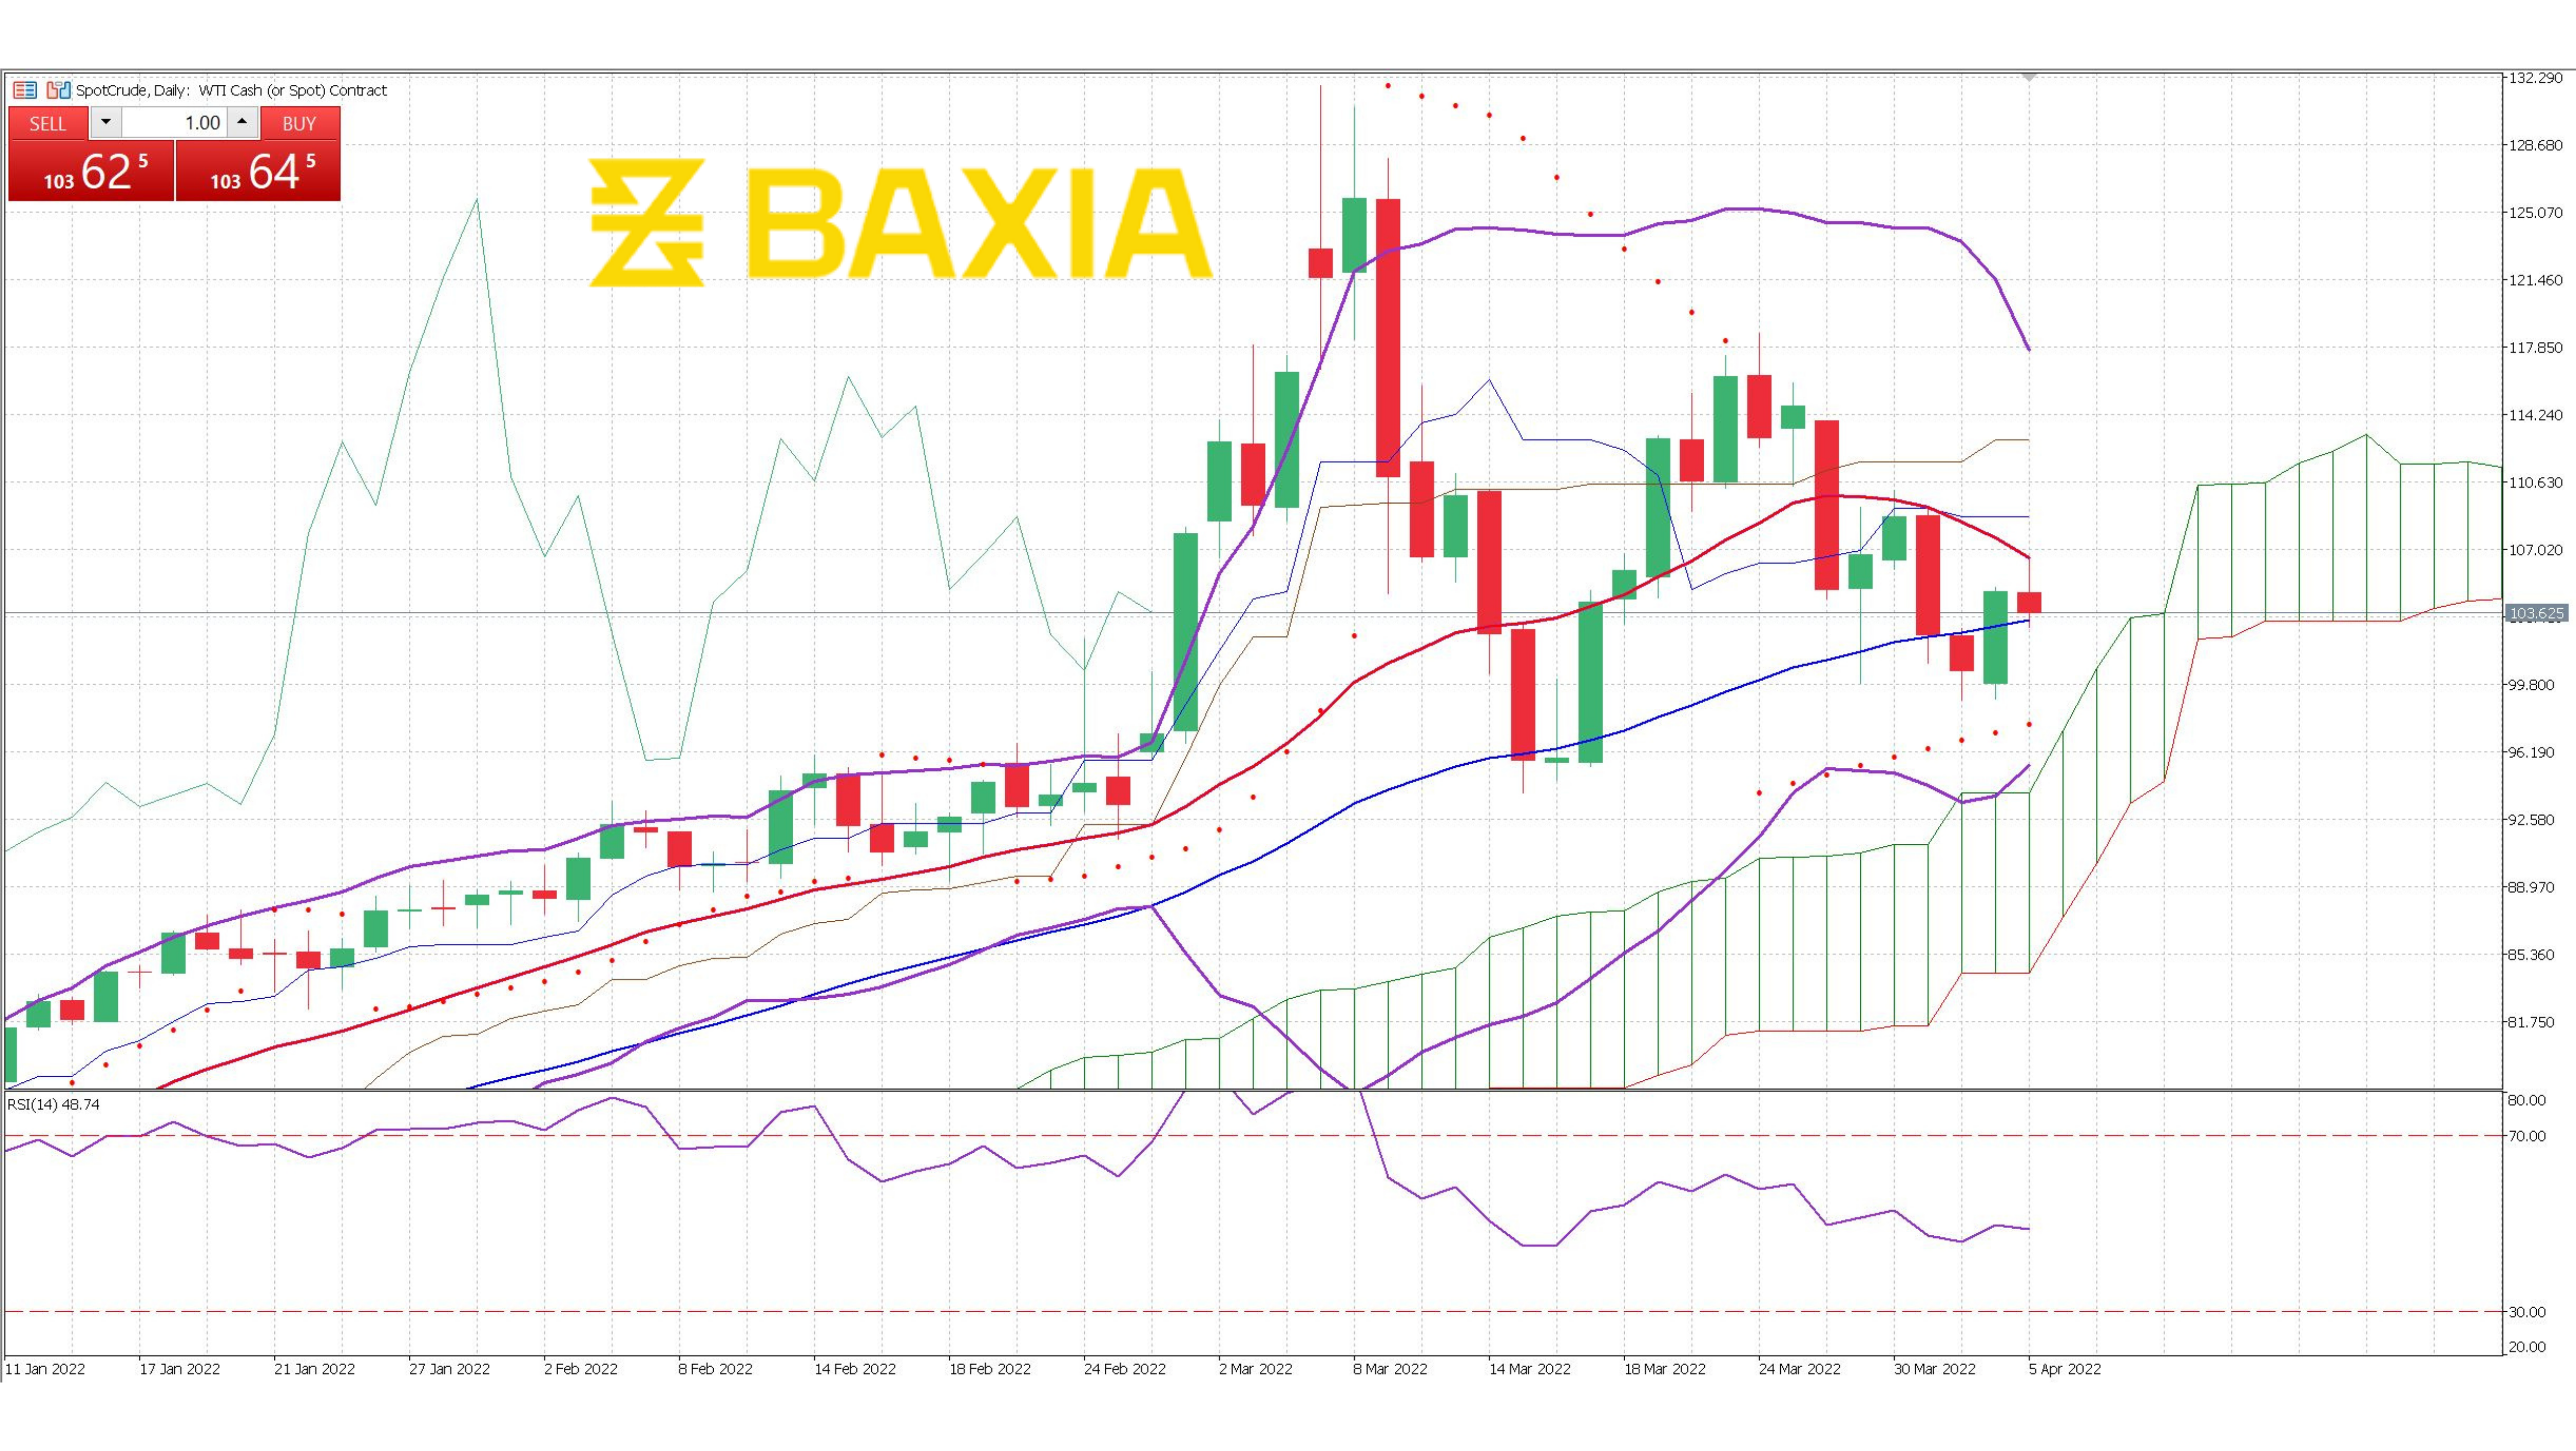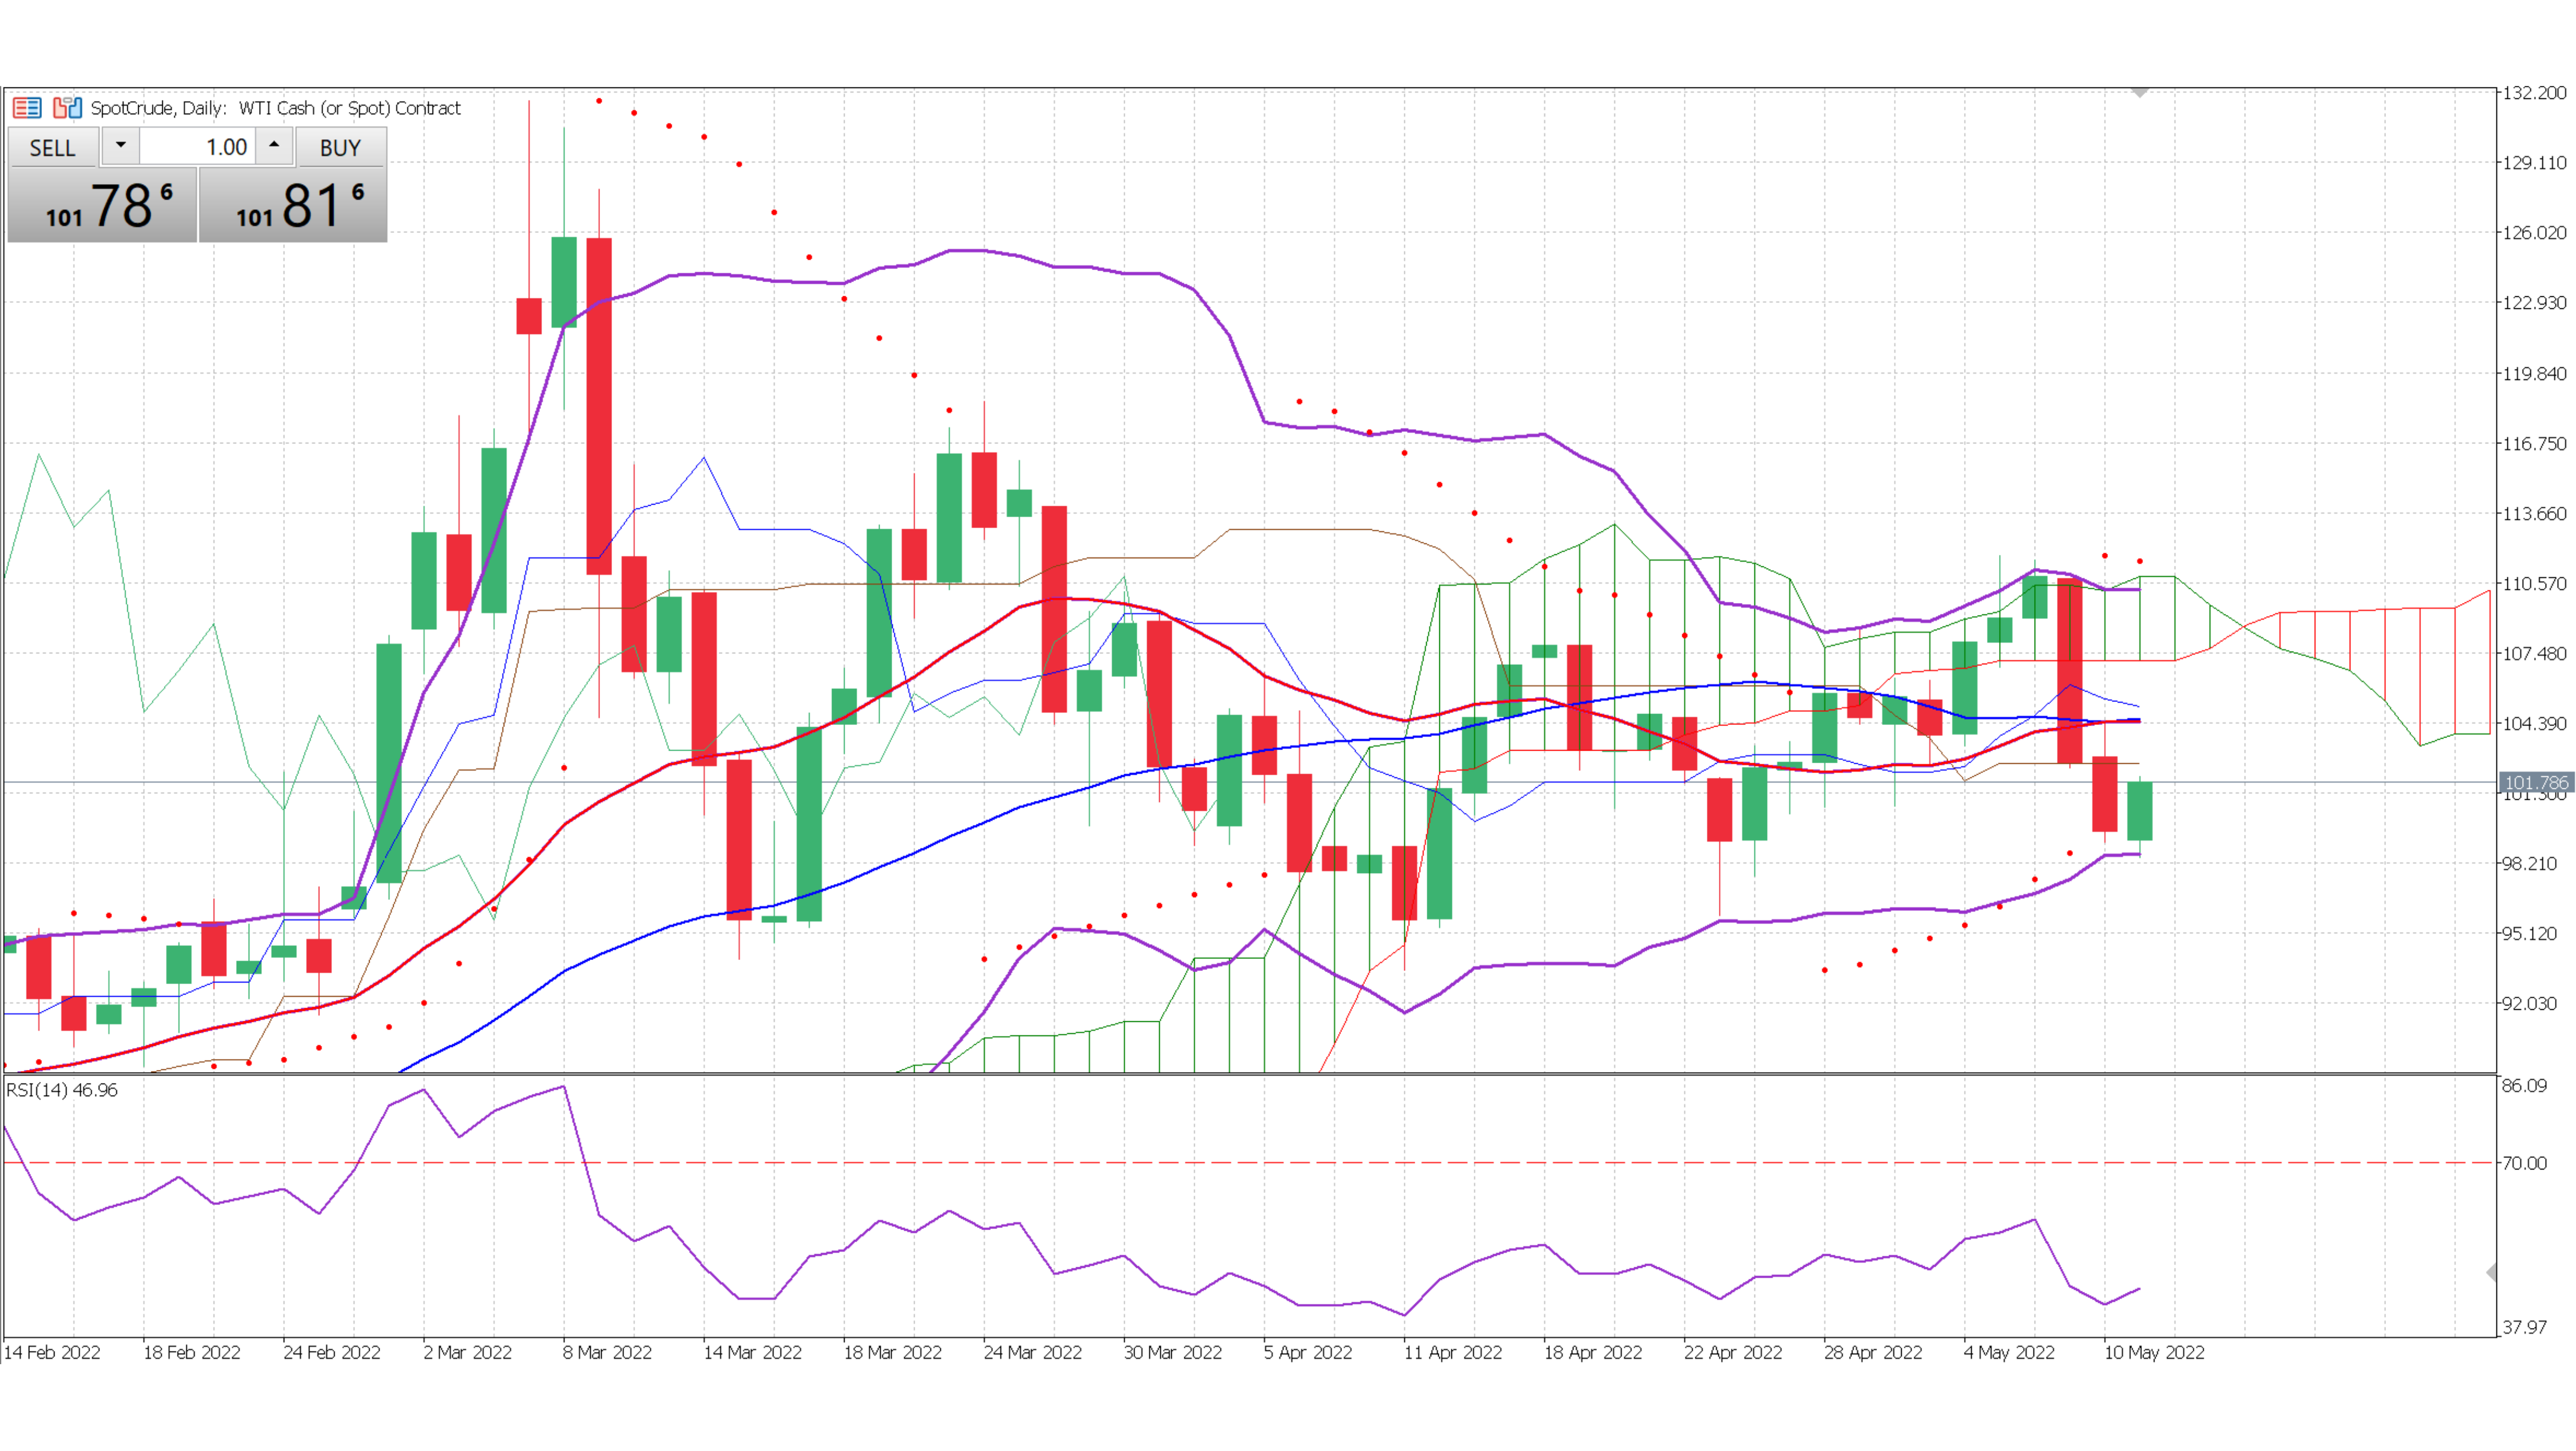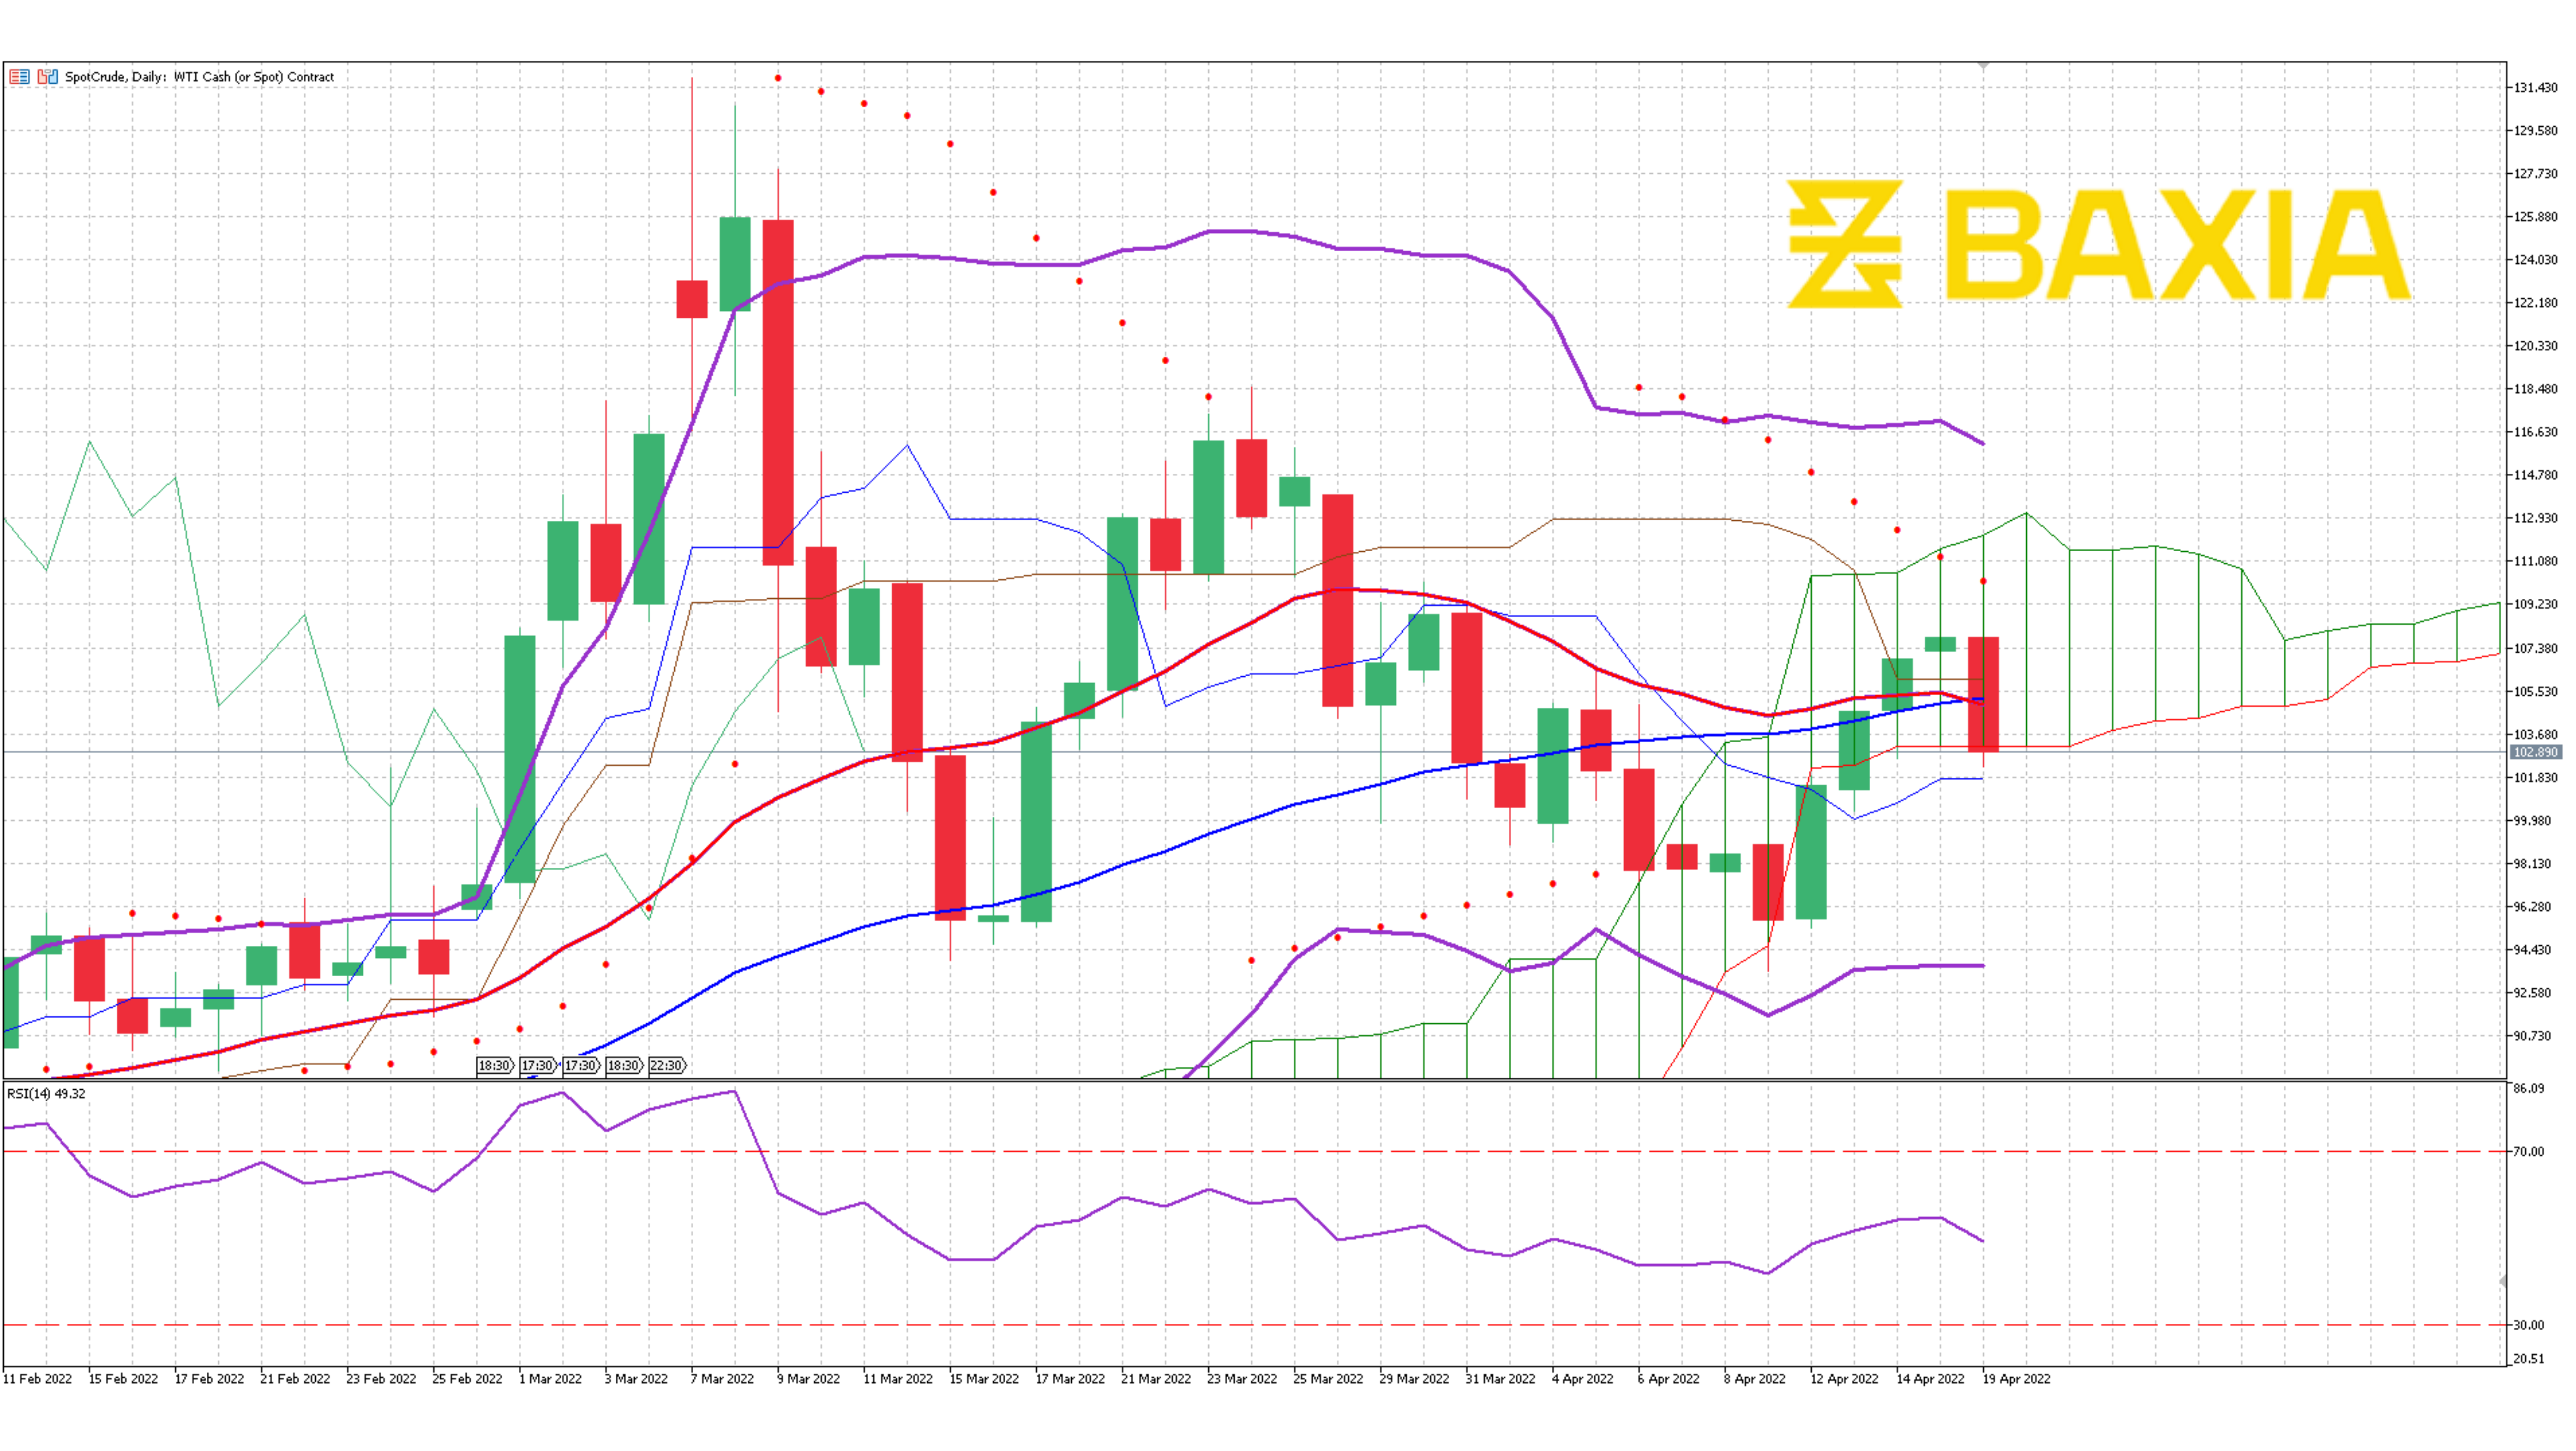

The energy commodity broke two resistance levels on our 38.2% and 23.6% Fibonacci retracement at $100.72 and $111.67. The pair bounced after it sank to 93.56 on March 15th. Current price trades above the short and long-term moving average, indicating that the uptrend would continue.
The Bollinger bands are wide and continue moving upwards, signaling that the uptrend is expected to continue in the short term. The price still has some space before reaching the upper band, suggesting that the current price is at a fair level.
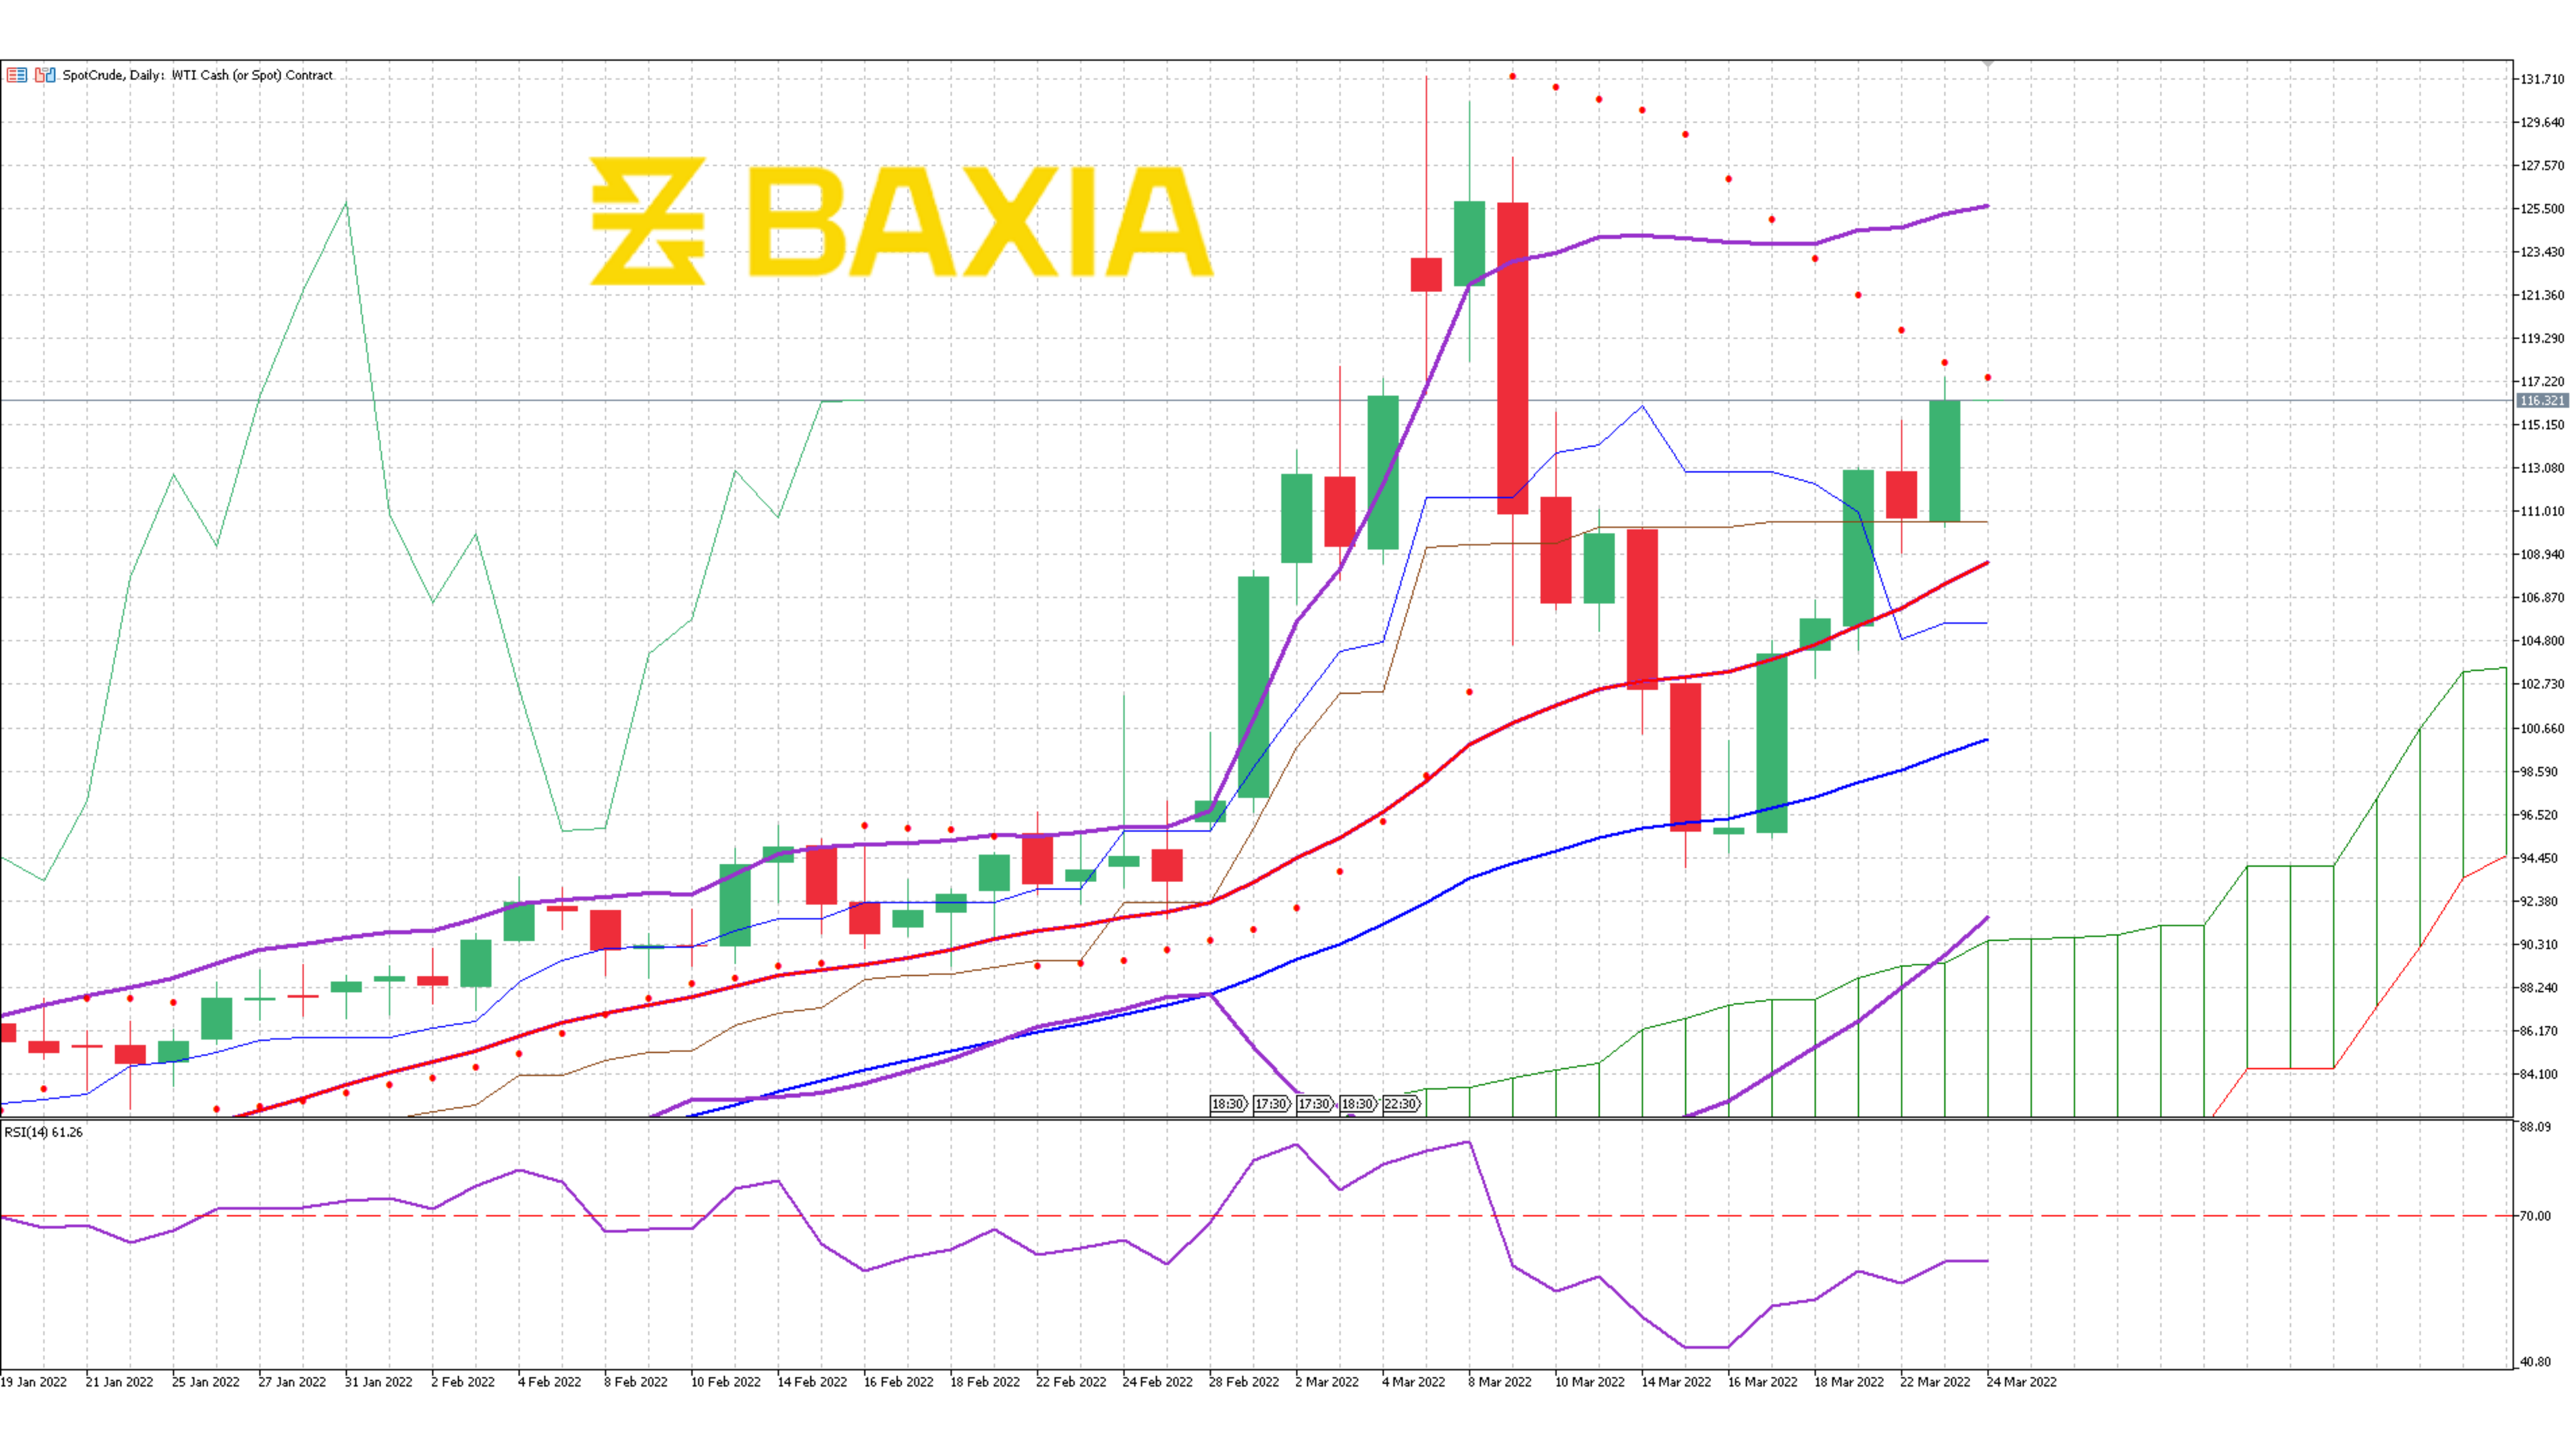
The relative strength index is at 59% which will also give the pair enough room to continue moving upwards, the price could reach $120 in the short to mid-term. Our parabolic SAR indicator suggests that the price will continue the upward trend, strengthening the Buy signals.
We love to hear new ideas from traders and want to know what you think!
If you like this topic and want to suggest future topics that you find helpful, let us know by clicking the ‘submit your feedback’ button below.

Trading foreign exchange on margin carries a high level of risk, and may not be suitable for all investors. Before deciding to trade foreign exchange you should carefully consider your investment objectives, level of experience, and risk appetite.
Nothing contained in this website should be construed as investment advice. Any reference to an investment's past or potential performance is not, and should not be construed as, a recommendation or as a guarantee of any specific outcome or profit.