
The USDCAD bulls are making a strong move, aiming to test the previous day's high at 1.3641. If the pair surpasses this level, it is likely to encounter resistance at the 200-day Exponential Moving Average (EMA), a critical point for further upward momentum.
Today’s key economic release for the USDCAD trading pair is the Foreign Securities Purchases data from Canada. Economists predict an increase in foreign purchases of Canadian securities. Should the actual data align with these forecasts, it could bolster the bullish outlook for the Canadian dollar, reinforcing the positive sentiment in the market.
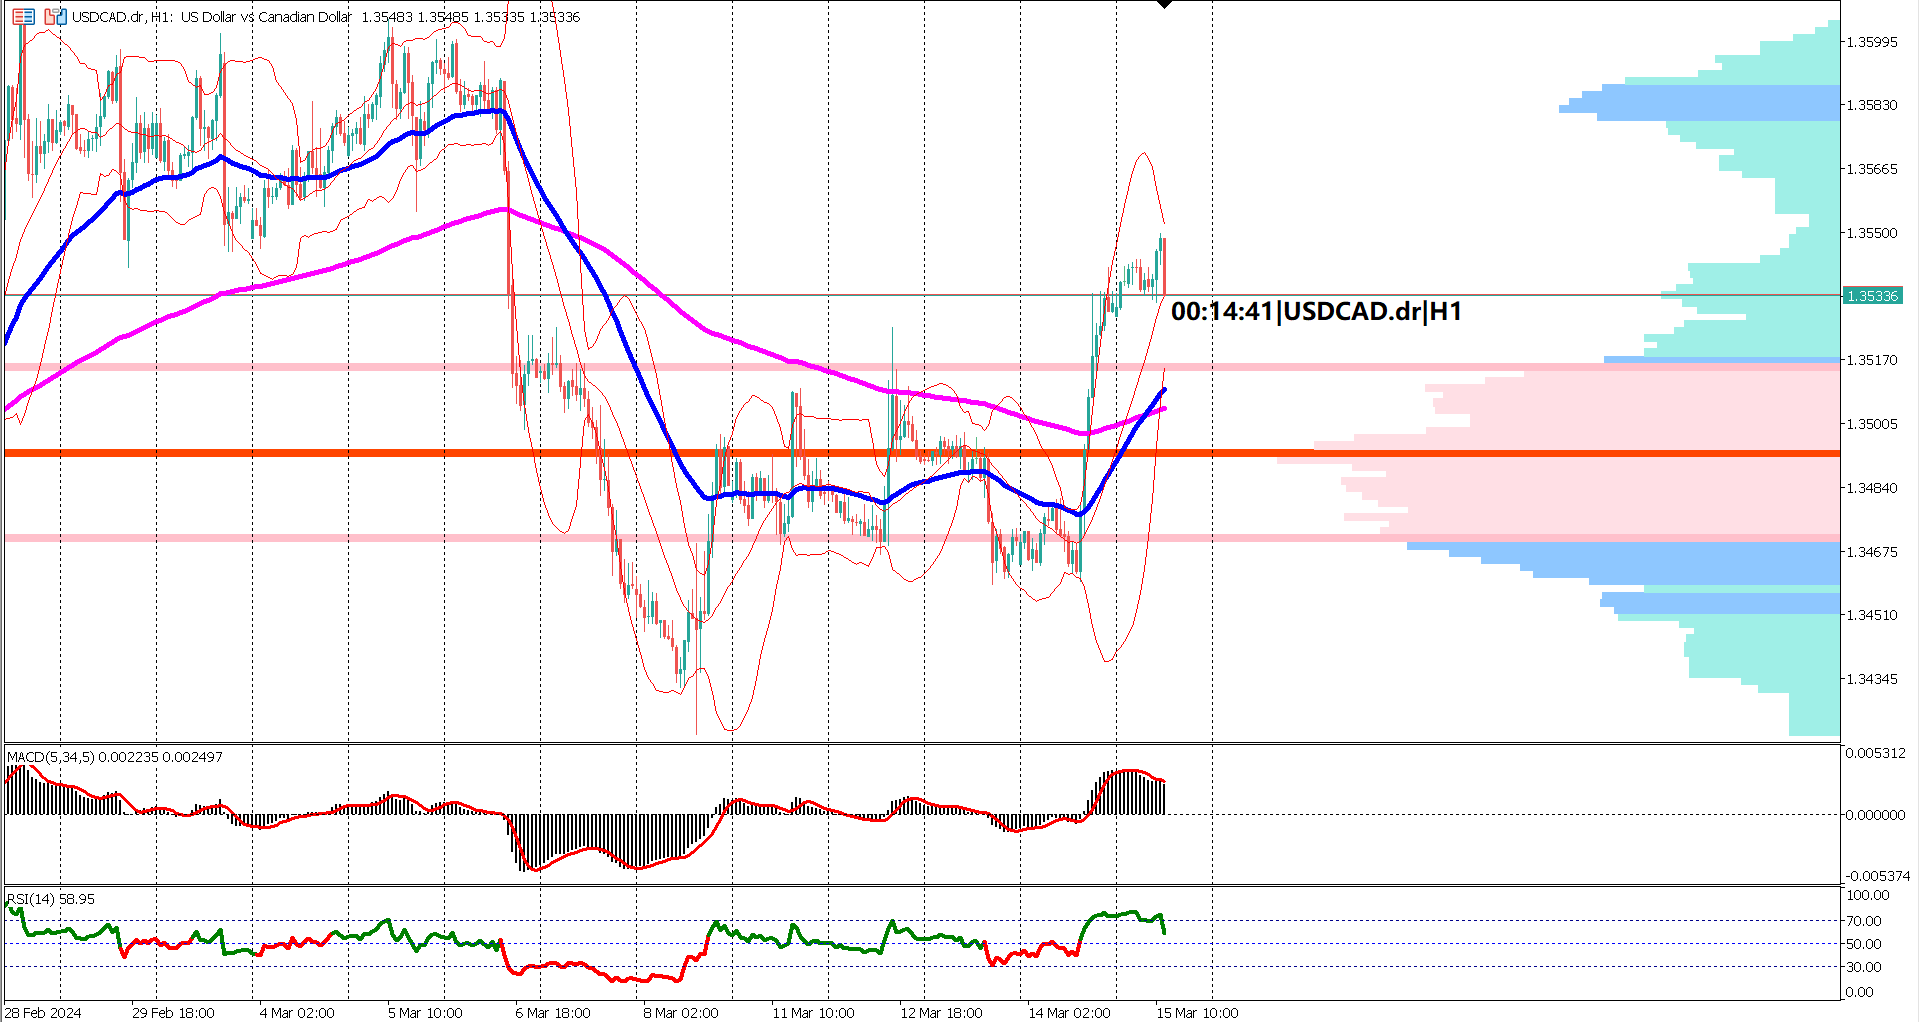
On the 1-hour chart, long-term indicators suggest a bearish correction phase, with the 50-day EMA trending upwards towards the 200-day EMA. This movement indicates potential bullish strength building up. The current price is trading above the upper band of the Bollinger Bands, indicating a bullish trend. The expansion of both bands points to increased market volatility. The lower band of the Bollinger Bands serves as a key support level. A break below this support would suggest a shift to bearish sentiment.
The Moving Average Convergence Divergence (MACD) and Relative Strength Index (RSI) are both signaling bullish sentiment. The MACD signal line and histogram are both above the zero line and trending upwards, indicating positive momentum. The RSI is above the 50% level but has not yet reached overbought territory, suggesting there is still room for further price increases before encountering significant resistance.
The immediate resistance level to watch is the previous day’s high at 1.3641. A successful breach of this level would set the stage for a test of the 200-day EMA, which could act as a significant resistance point. On the downside, the lower band of the Bollinger Bands is a critical support level. A breach of this support could indicate a bearish reversal and increased downward pressure.
The USDCAD pair is currently exhibiting bullish momentum, supported by positive technical indicators and an optimistic economic forecast for Canada. The previous day's high at 1.3641 and the 200-day EMA are key resistance levels that traders will be watching closely. Meanwhile, the lower band of the Bollinger Bands provides essential support, highlighting the importance of monitoring these levels for potential market shifts. With increased volatility indicated by the expanding Bollinger Bands, traders should prepare for dynamic movements in the market.
Forecast 2.4% vs Previous 2.4%
Forecast 0.6% vs Previous 0.4%
Forecast 3.51B vs Previous -8.78B

Trading foreign exchange on margin carries a high level of risk, and may not be suitable for all investors. Before deciding to trade foreign exchange you should carefully consider your investment objectives, level of experience, and risk appetite.
Nothing contained in this website should be construed as investment advice. Any reference to an investment's past or potential performance is not, and should not be construed as, a recommendation or as a guarantee of any specific outcome or profit.