
The price has been hovering around 0.9146 for more than two months since June 18th. The chart shows that the fluctuations shrink and go flat; this pattern is known as a rising triangle. Usually, a rising triangle is a breakout signal with the direction upward. So, will the price break up on the USDCHF?
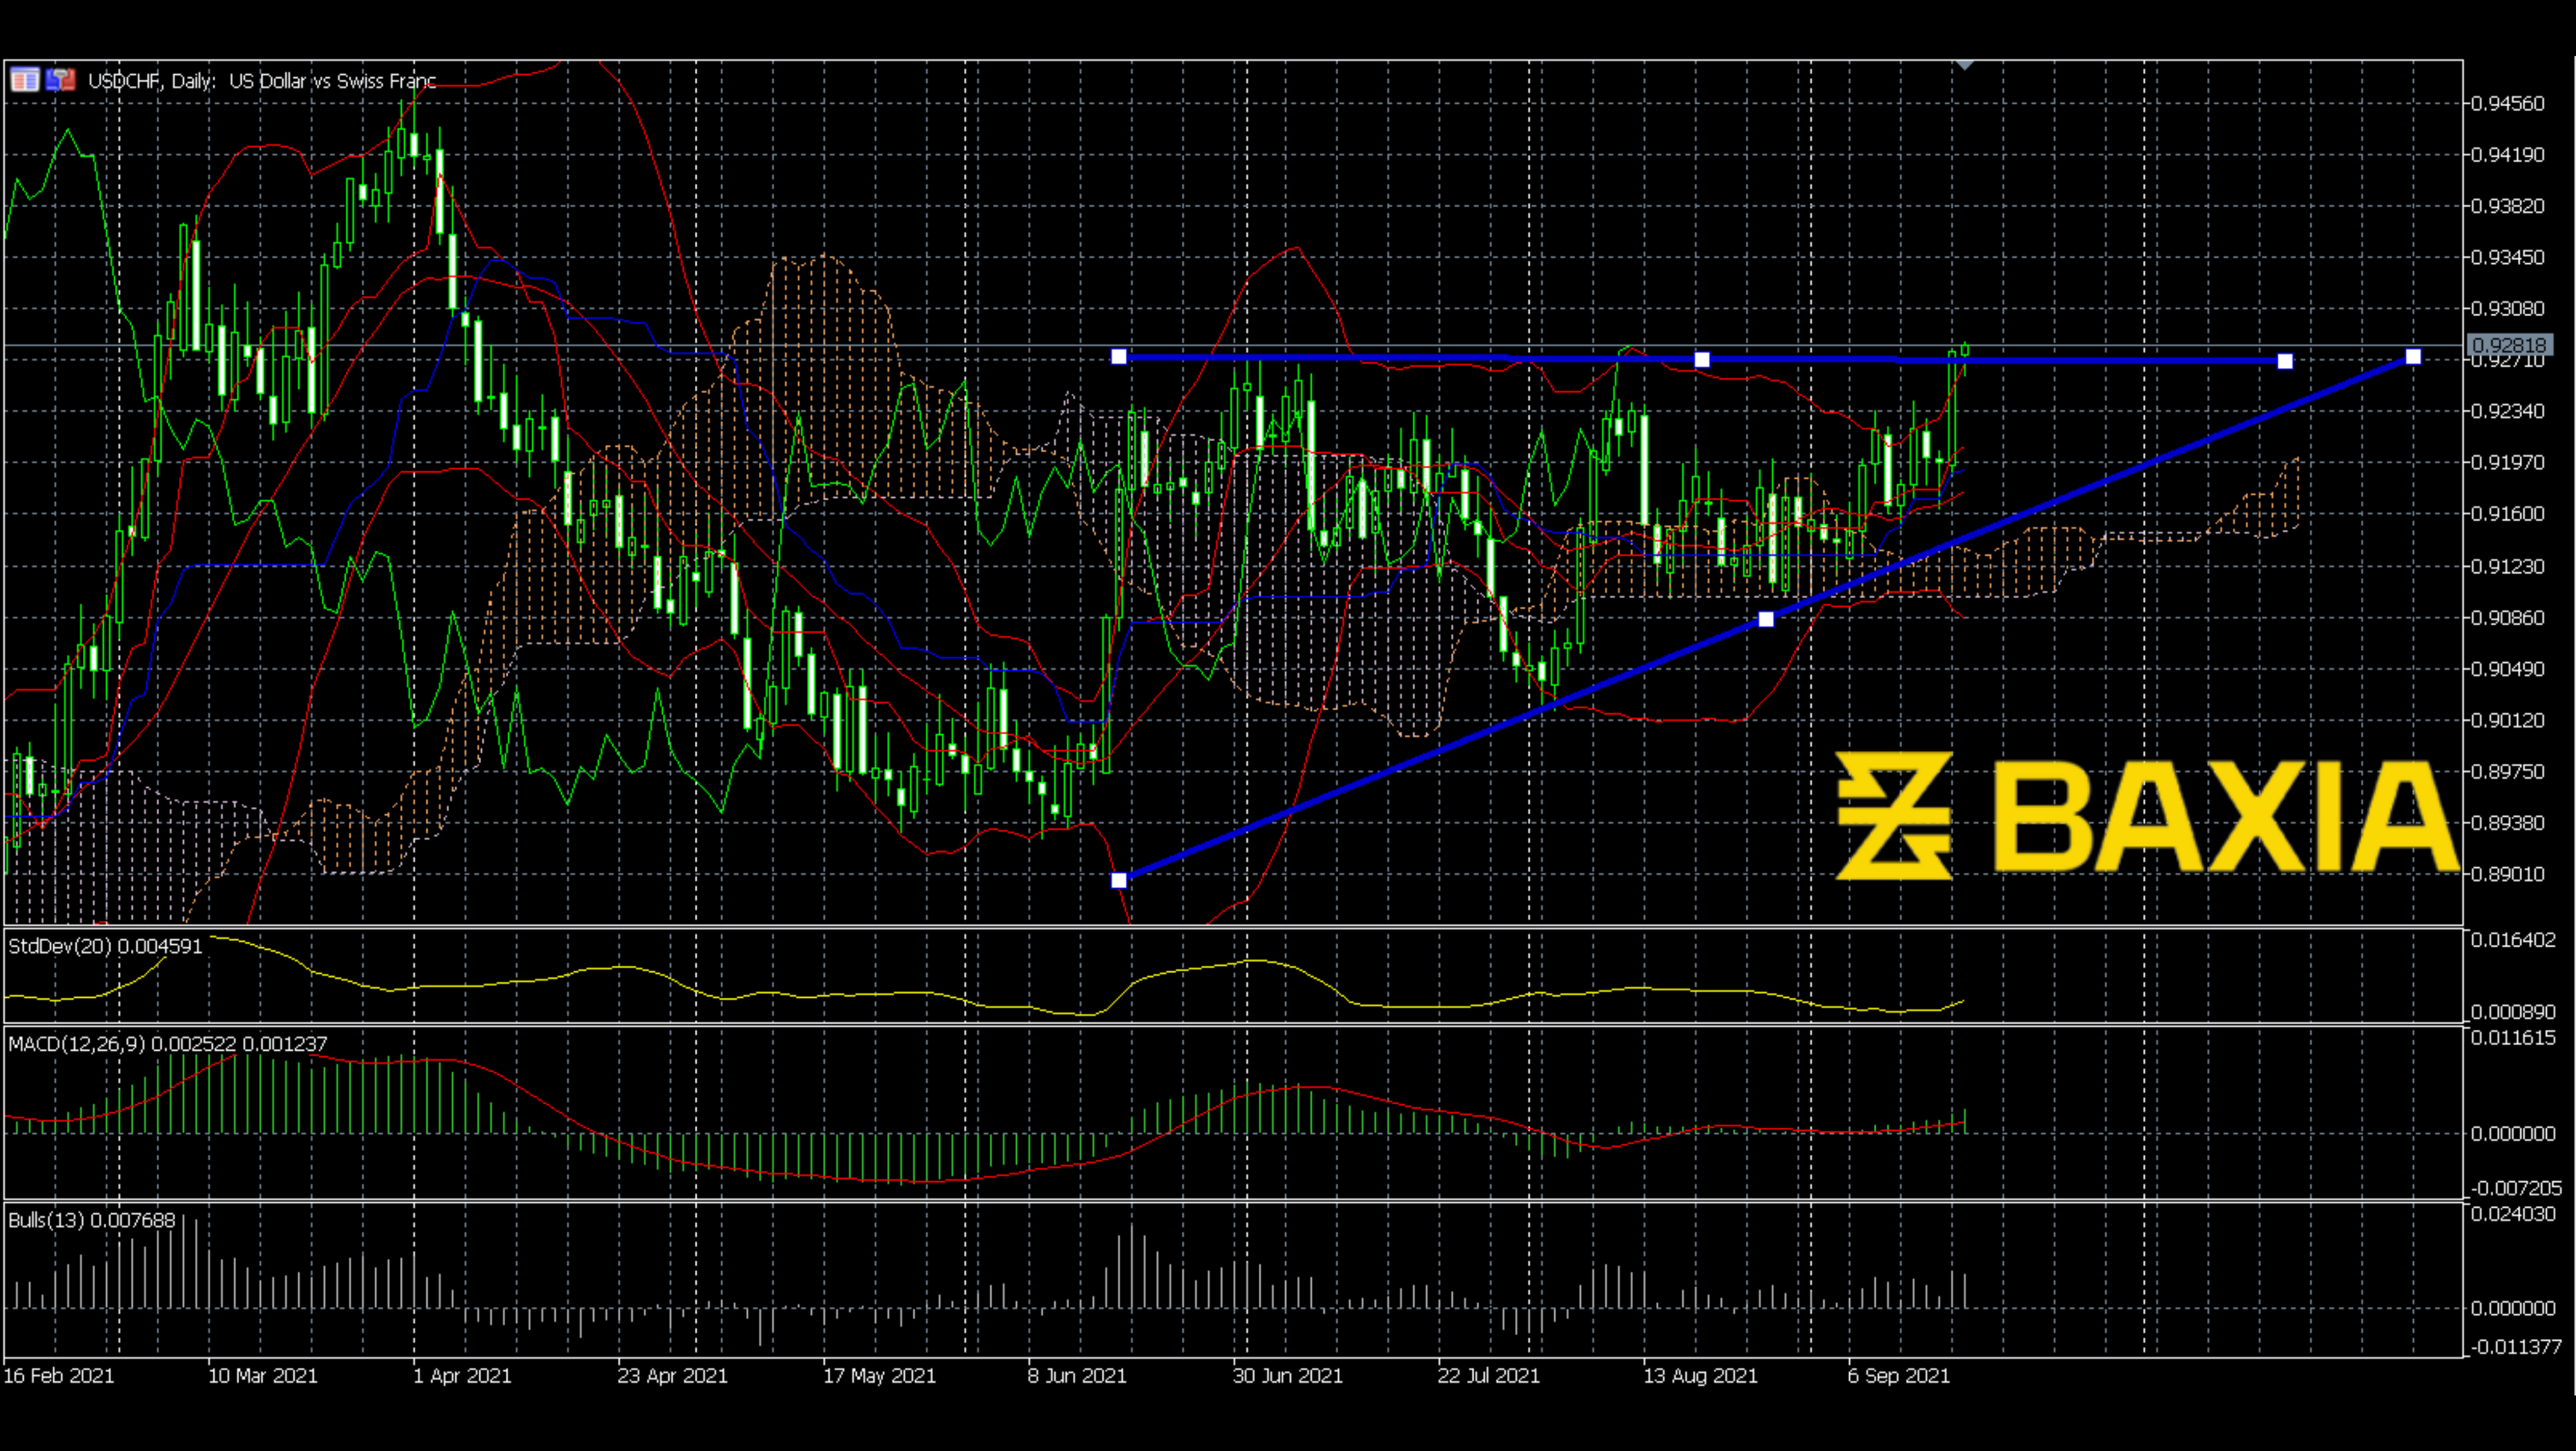
Here we can see that the MACD already made a bullish cross, and the angle becomes more significant, which is a strong bullish signal. We can find the same result on Bulls power; it stays positive, and we can see waves go up continuously. Also, the Standard deviation is going up from a low level, which means the big fluctuation is on the way; this looks like a breakout signal. Ichimoku is going up; however, the price is already beyond the cloud, which means the signal of Ichimoku is still bullish. Bollinger Bands just shrunk; a breakout is already on the way. Keep your eyes on this pair, let’s wait for the breakout to come.
We love to hear new ideas from traders and want to know what you think!
If you like this topic and want to suggest future topics that you find helpful, let us know by clicking the ‘submit your feedback’ button below.

Trading foreign exchange on margin carries a high level of risk, and may not be suitable for all investors. Before deciding to trade foreign exchange you should carefully consider your investment objectives, level of experience, and risk appetite.
Nothing contained in this website should be construed as investment advice. Any reference to an investment's past or potential performance is not, and should not be construed as, a recommendation or as a guarantee of any specific outcome or profit.