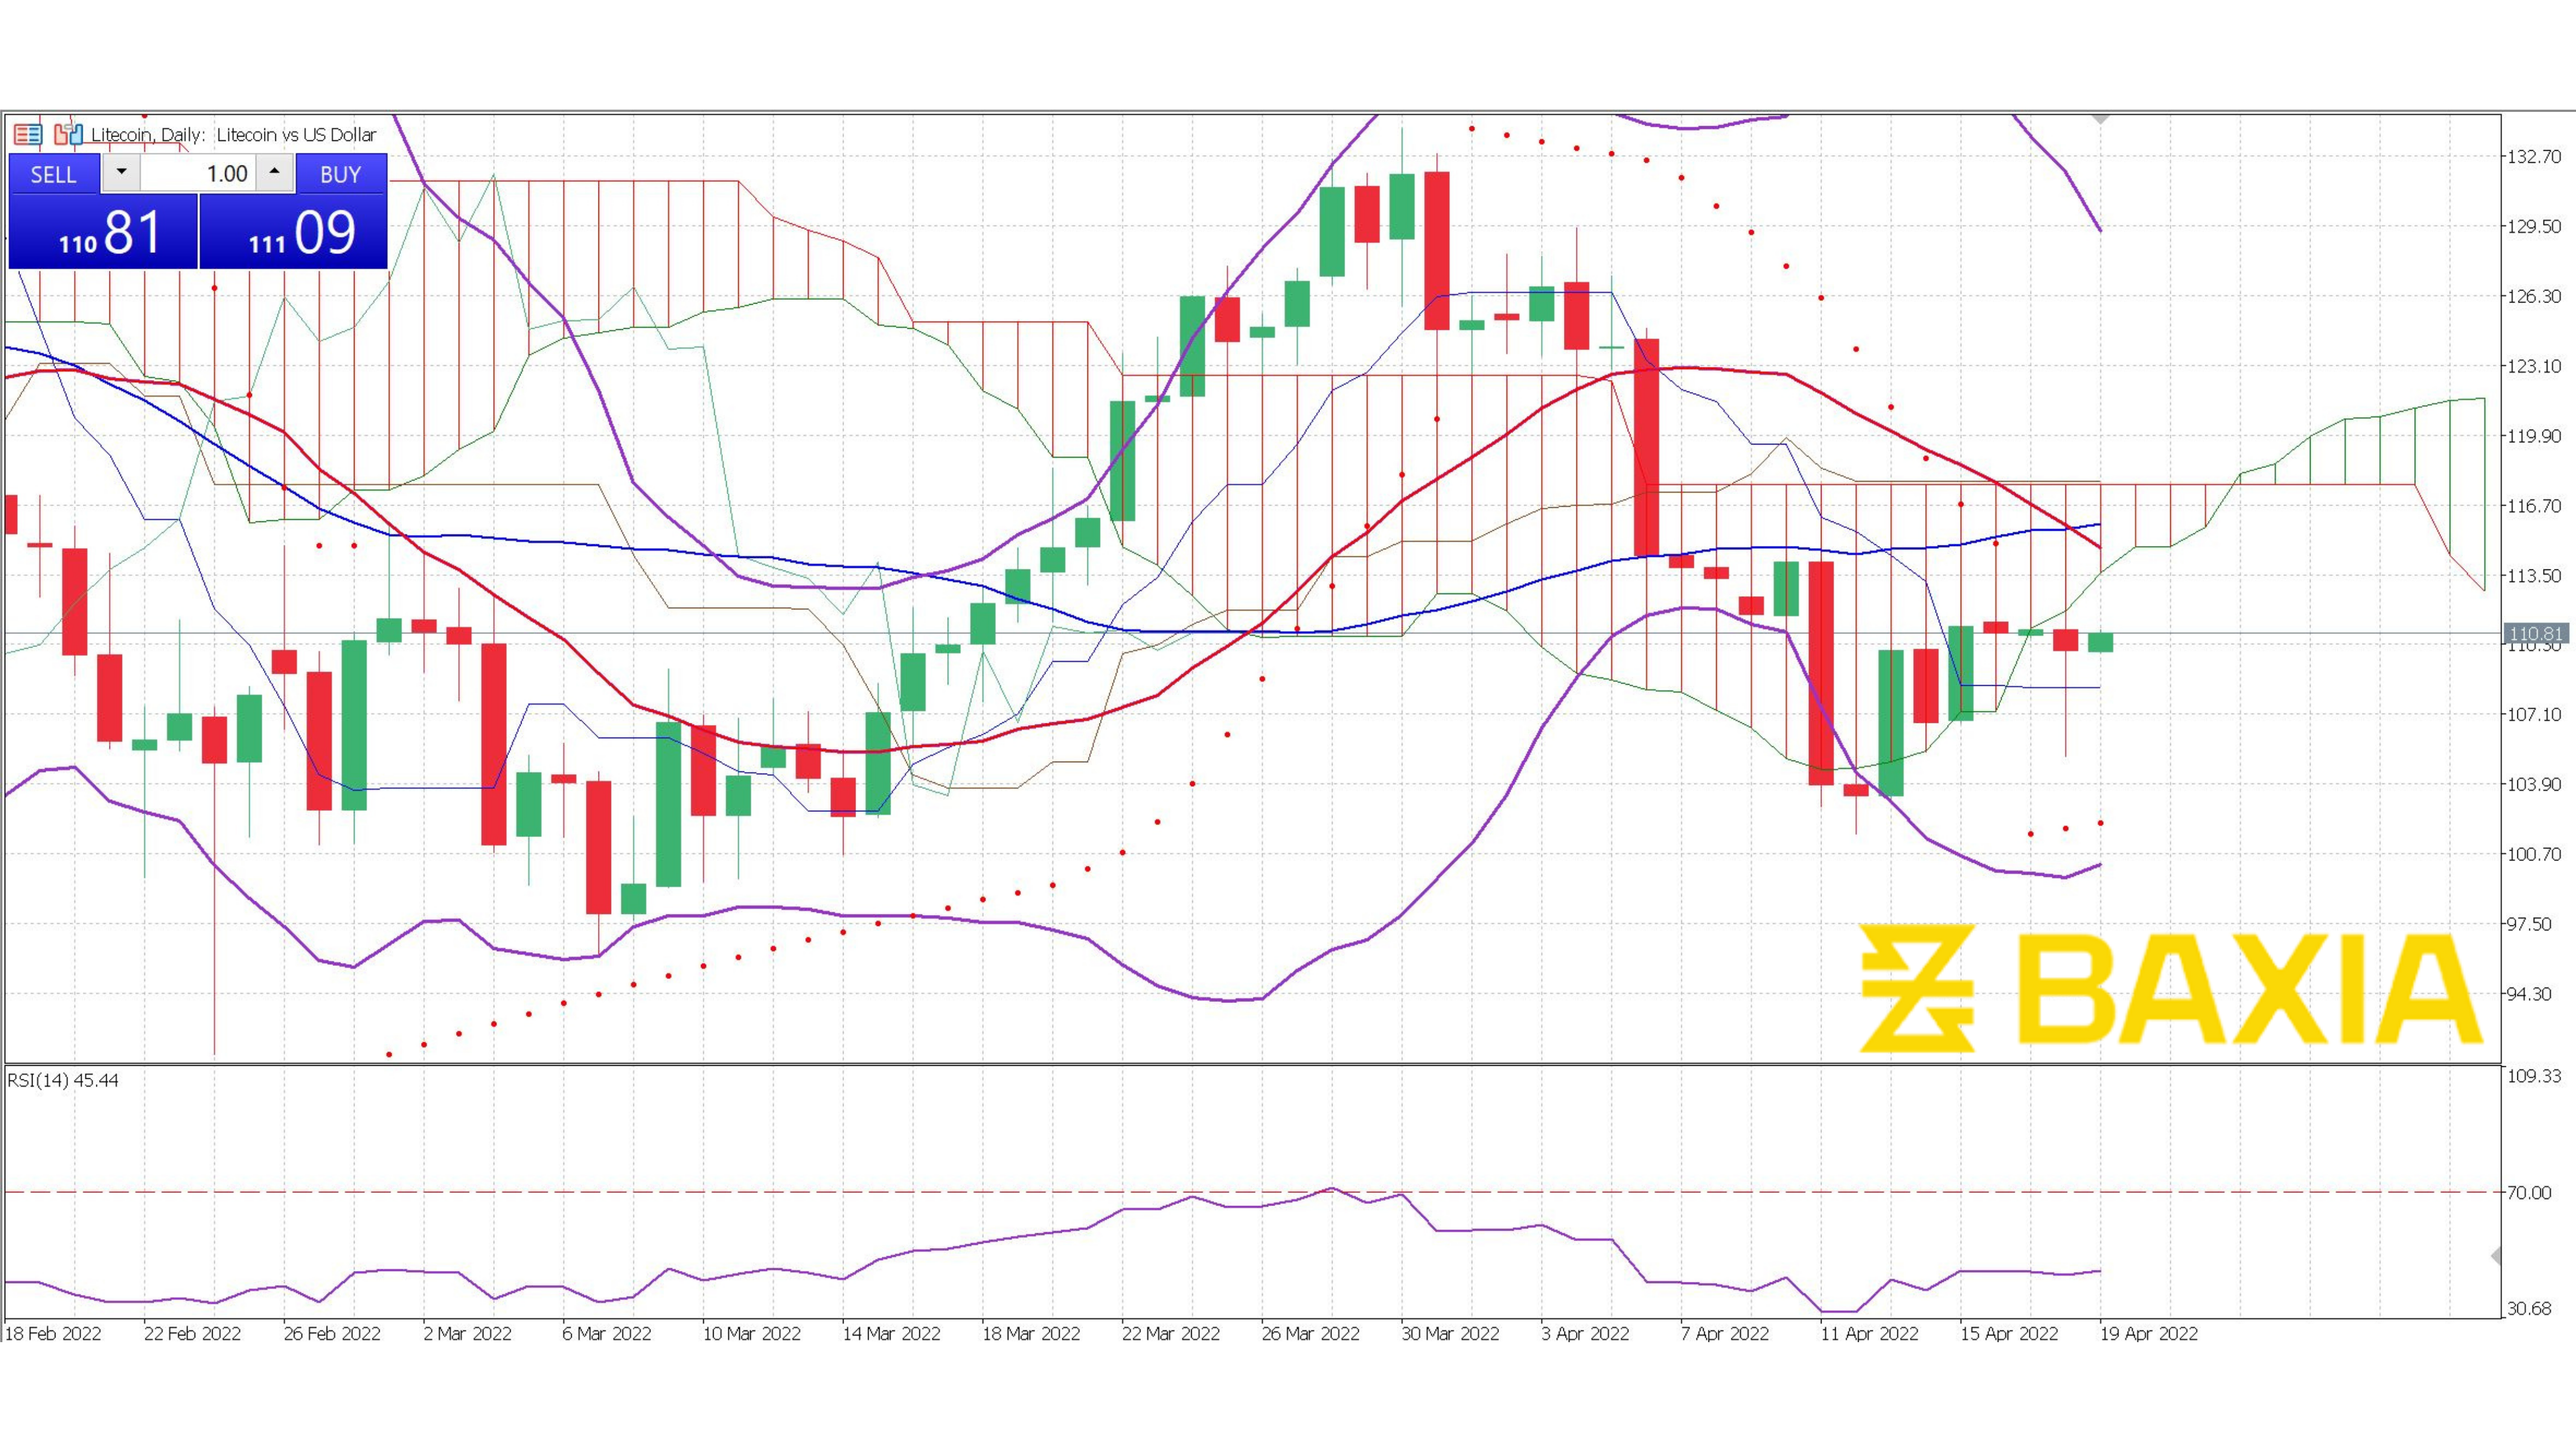

After a two-week rising, the price started to hover around 0.711 on Sep 3rd, during which the Ichimoku overlapped with the price line. However, this flat trend did not last for too long; the price went down on Sep 16th. Then the momentous soon became oversold. RSI even reached the 30 level twice. So, will the price continue?
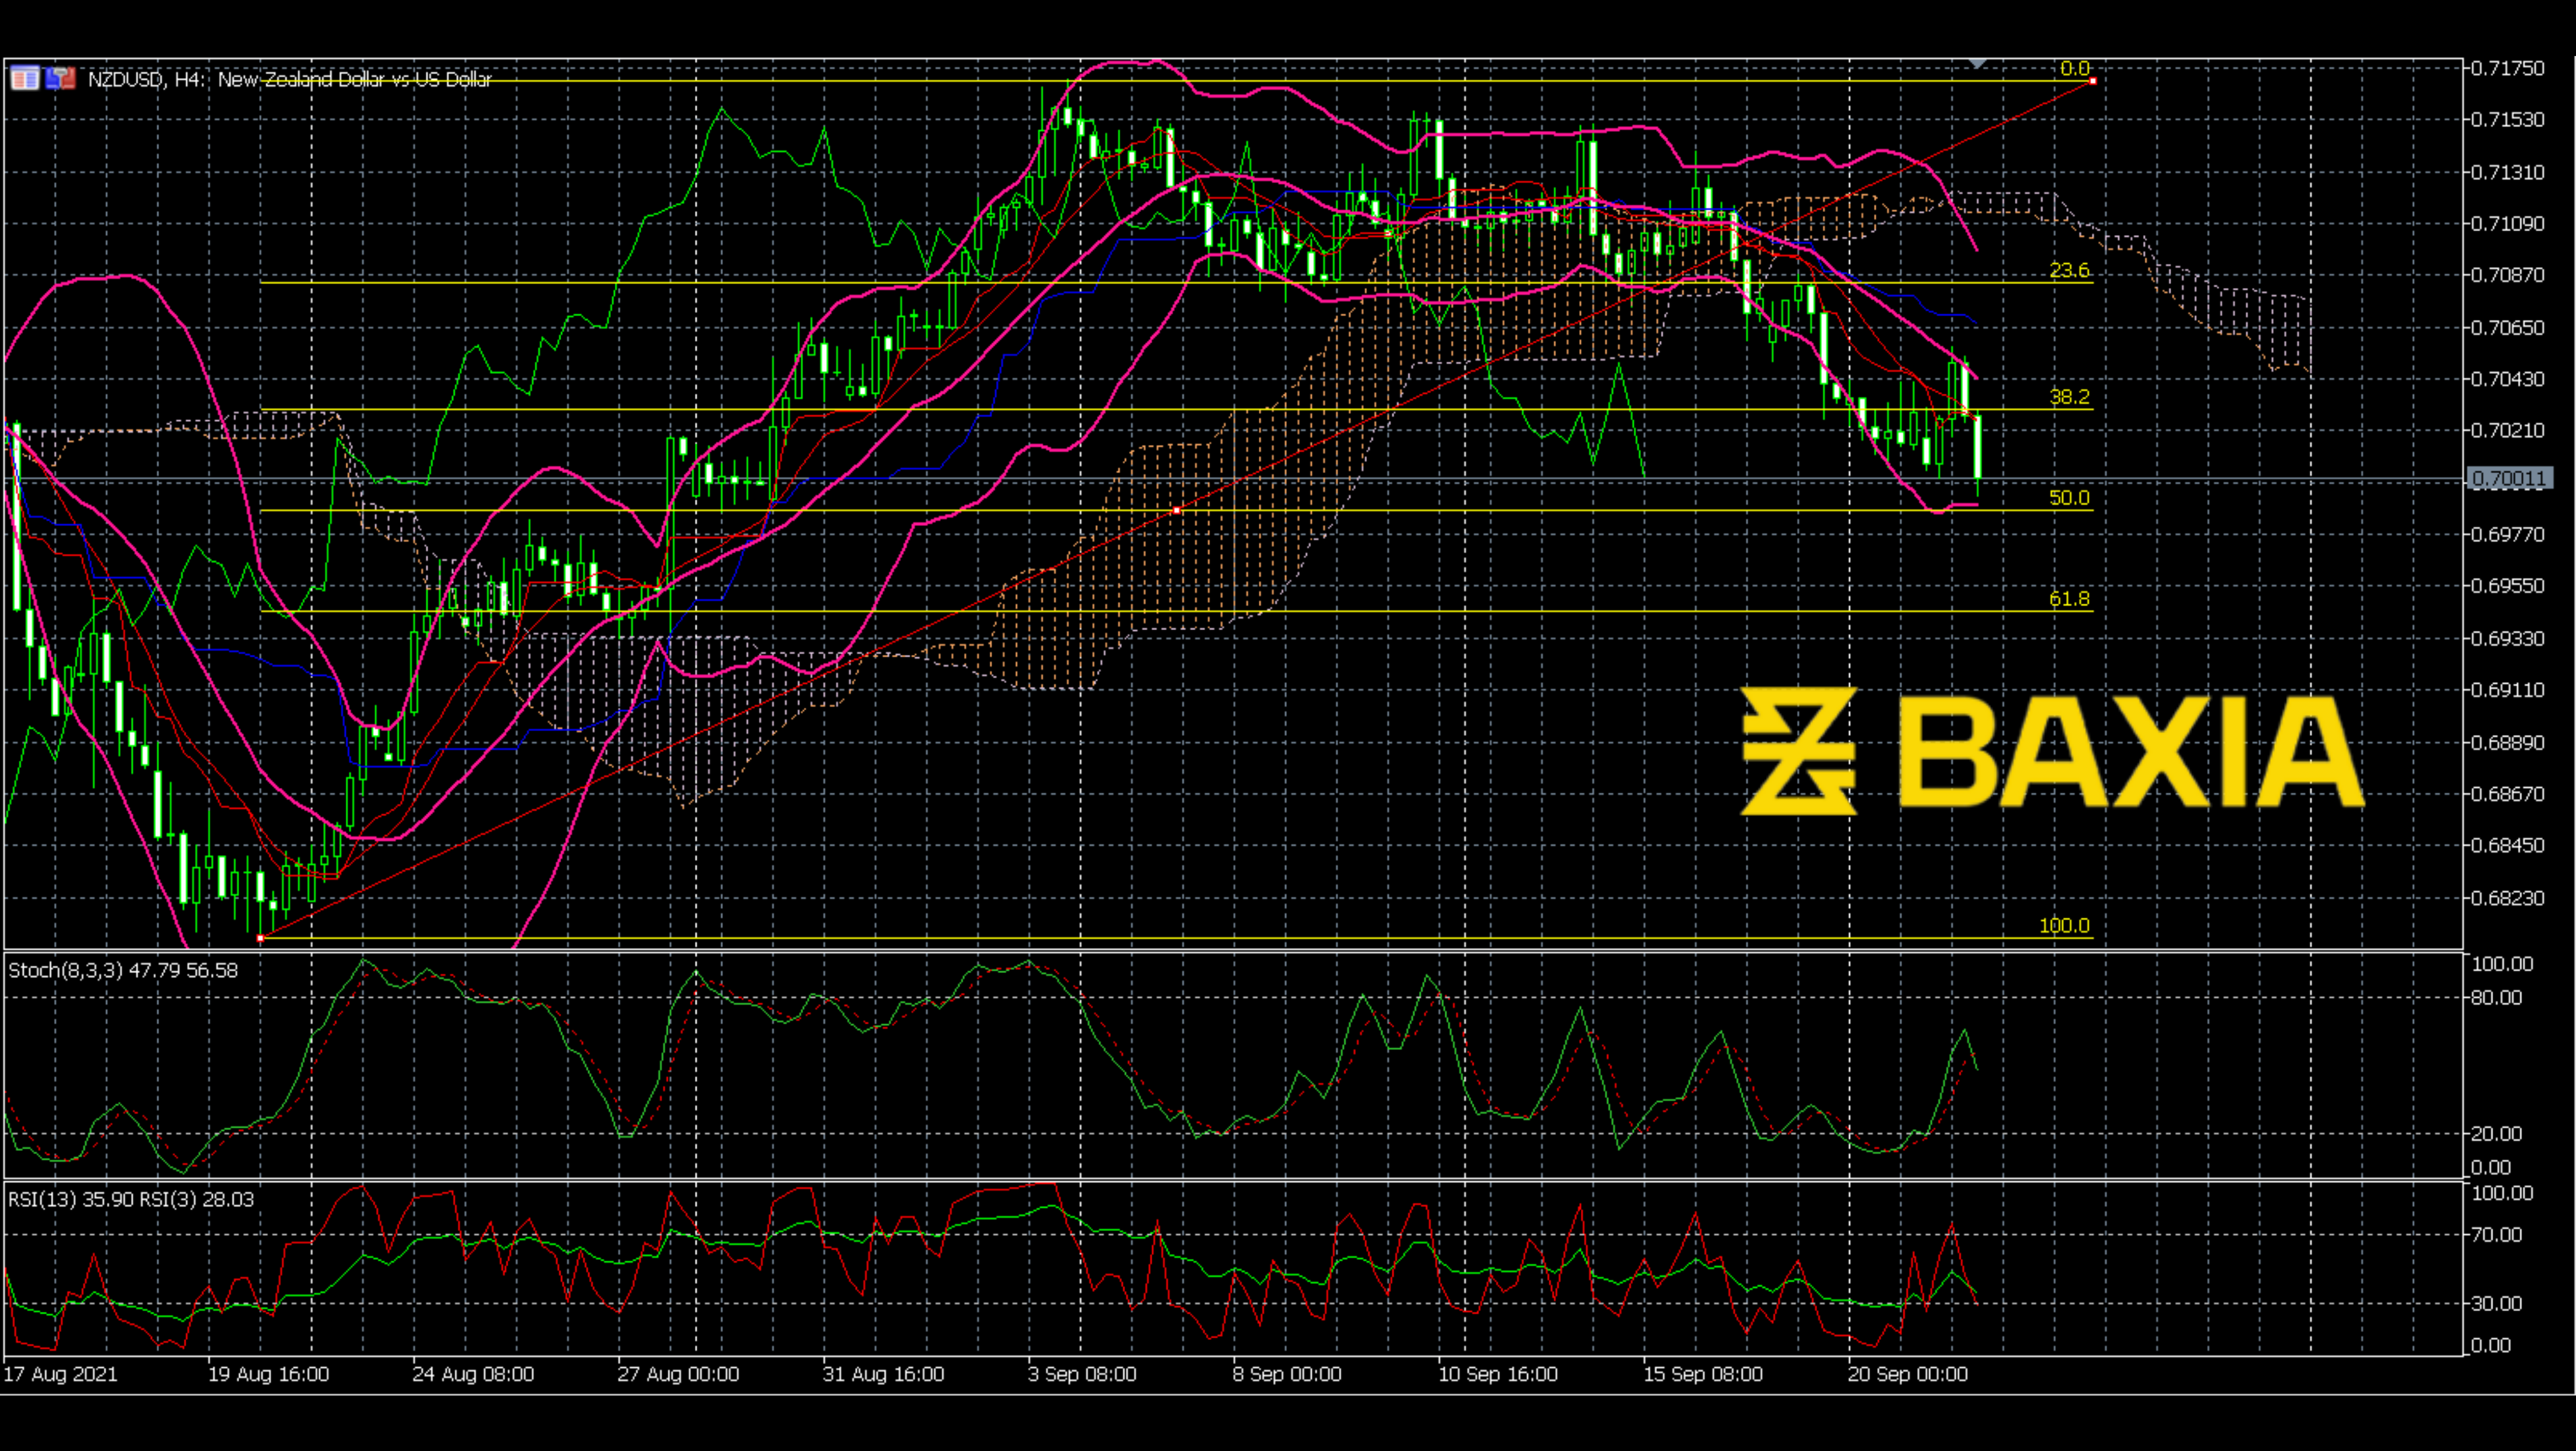
The Bollinger Bands started getting broader since the fall beginning. As we know, the broad Bollinger Bands means a breakout signal. For now, the fluctuation becomes larger; will the price breakout at this time? I do not think so. The broad Bollinger Bands means the breakout has already finished. Now, the price bounced back to the middle line of the Bollinger Bands; the mild movement may show up. Alao, the Stochastics and RSI both move to a middle area, which means the price may not make too much up and down recently.
We love to hear new ideas from traders and want to know what you think!
If you like this topic and want to suggest future topics that you find helpful, let us know by clicking the ‘submit your feedback’ button below.

Trading foreign exchange on margin carries a high level of risk, and may not be suitable for all investors. Before deciding to trade foreign exchange you should carefully consider your investment objectives, level of experience, and risk appetite.
Nothing contained in this website should be construed as investment advice. Any reference to an investment's past or potential performance is not, and should not be construed as, a recommendation or as a guarantee of any specific outcome or profit.