
The price of GBPUSD has been hovering around 1.416 for about 20 days. The fluctuation during that period was comparatively low, which means the price was stable. However, the breakout still came; it lasted 60 hours and dropped the price by 2.4%. This breakout is significant as it broke a 20 days trend at a steep angle. Now, the price is making an ascending triangle; as we know, the ascending triangle is a bullish signal. Can we expect the price to turn around?
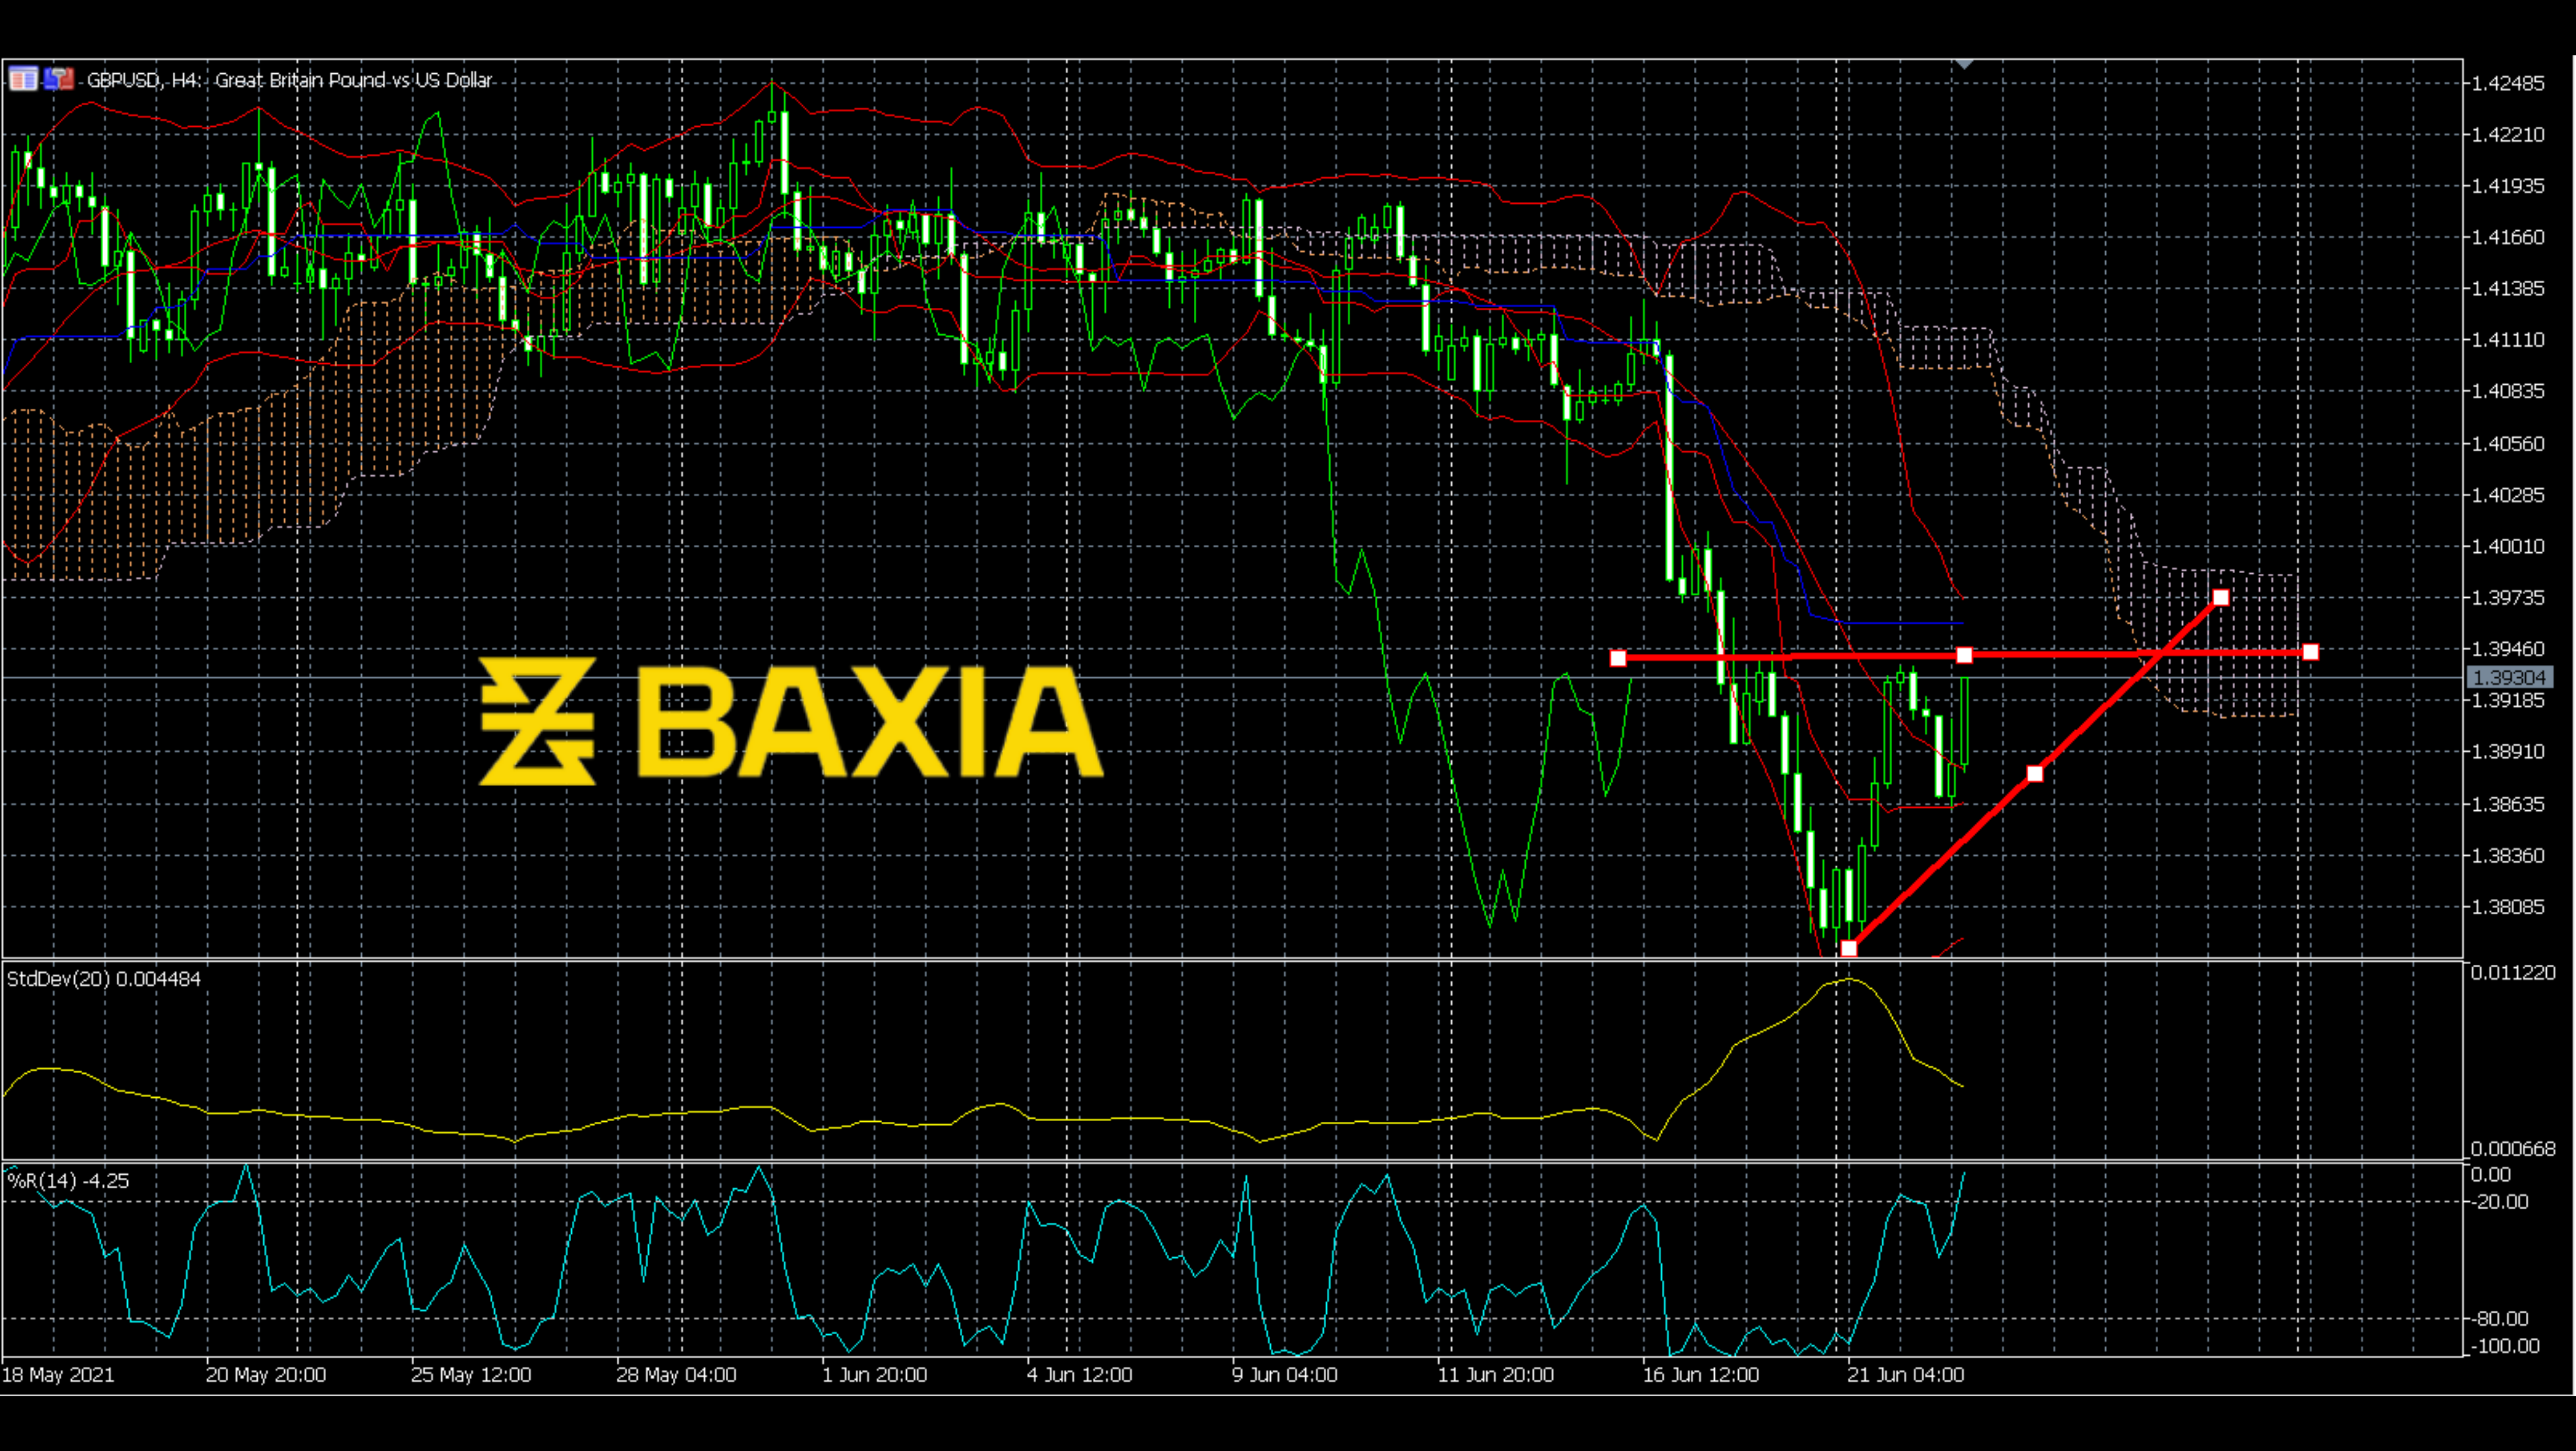
The Bollinger Bands are shrinking, which means the price might make a new breakout soon. Also, the price tested the lower Bollinger Band, which could push the price back to the middle. The Ichimoku is always ahead of the price line; however, it is getting thicker and has moved down recently; these are all bullish signals. Standard deviation is going down, which is understandable because the waves of the price line are relatively calm. Although the bullish signals show up, we still have a bearish signal here. Williams R% reached the overbought area; this is an unstable point because the price could bounce back anytime.
We love to hear new ideas from traders and want to know what you think!
If you like this topic and want to suggest future topics that you find helpful, let us know by clicking the ‘submit your feedback’ button below.

Trading foreign exchange on margin carries a high level of risk, and may not be suitable for all investors. Before deciding to trade foreign exchange you should carefully consider your investment objectives, level of experience, and risk appetite.
Nothing contained in this website should be construed as investment advice. Any reference to an investment's past or potential performance is not, and should not be construed as, a recommendation or as a guarantee of any specific outcome or profit.