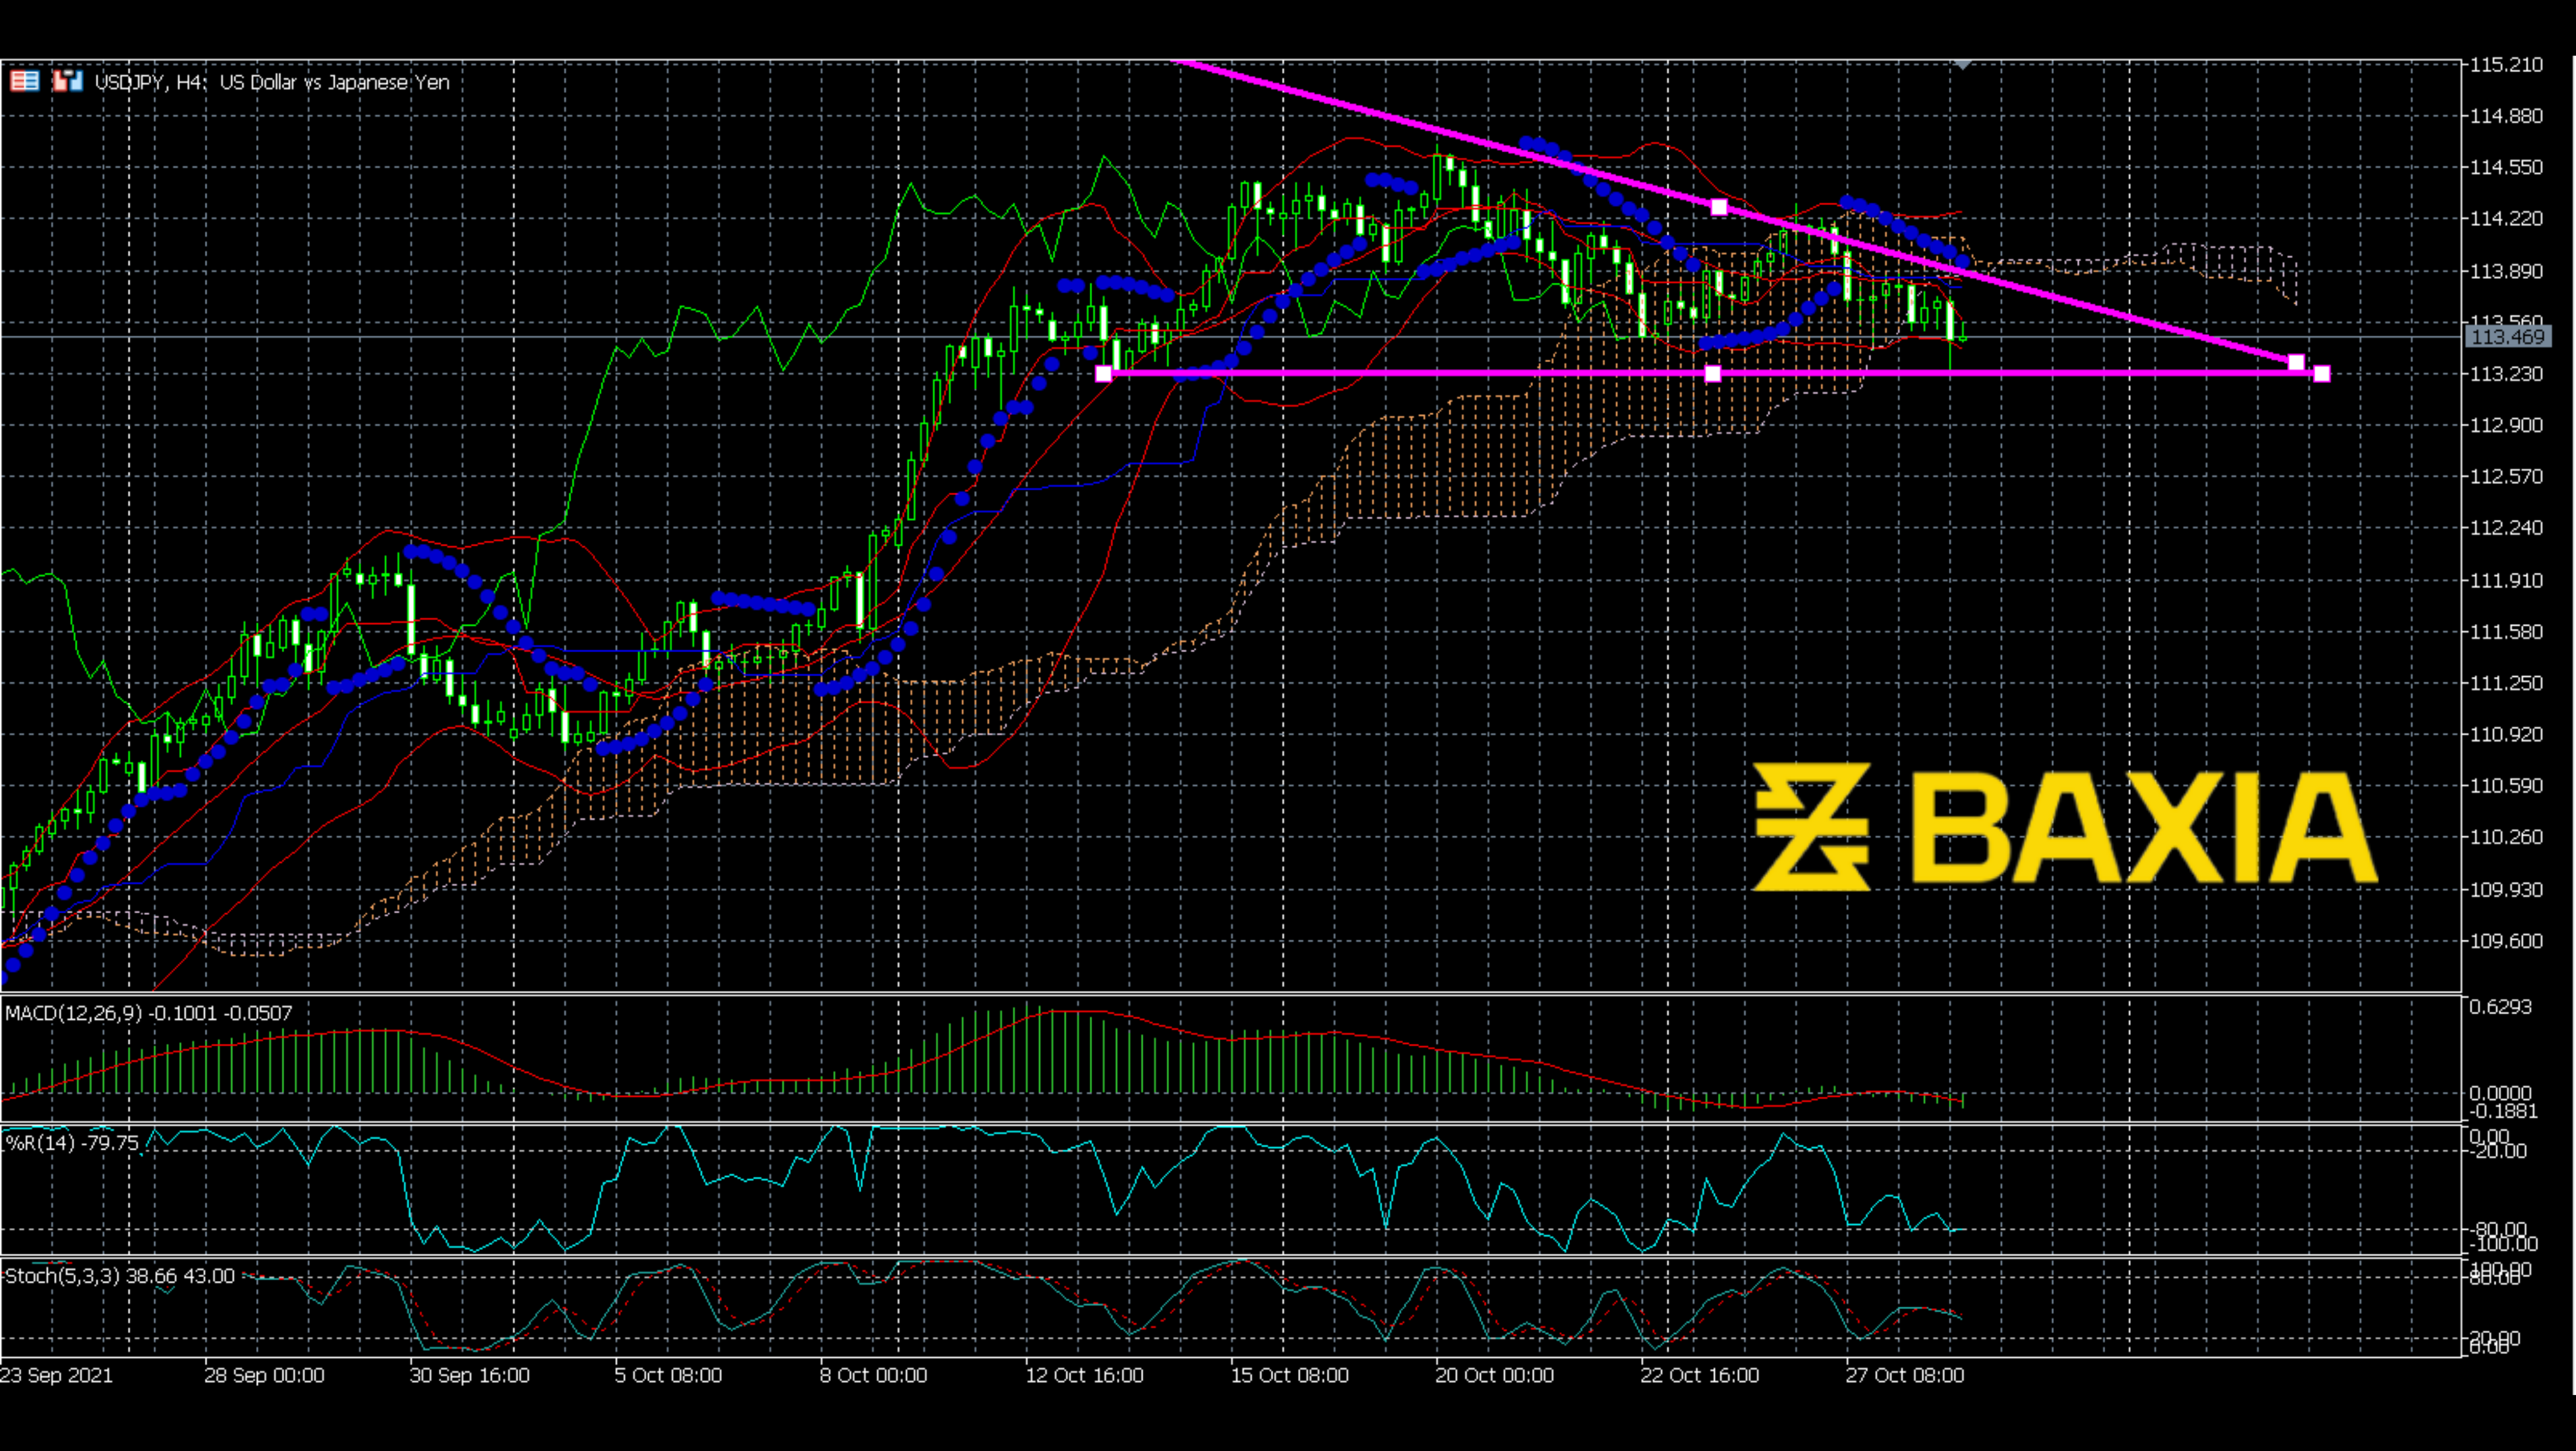

The previous breakup was steep. Although this breakout was within the expectation, it was still fast, it even stopped soon. As can be seen, the price met resistance on Sep 20th. The whole breakout process had lasted three days, which was not a long and solid trend. Recently, the price made some fluctuations; however, none of them had enough power to change the big picture of the price.
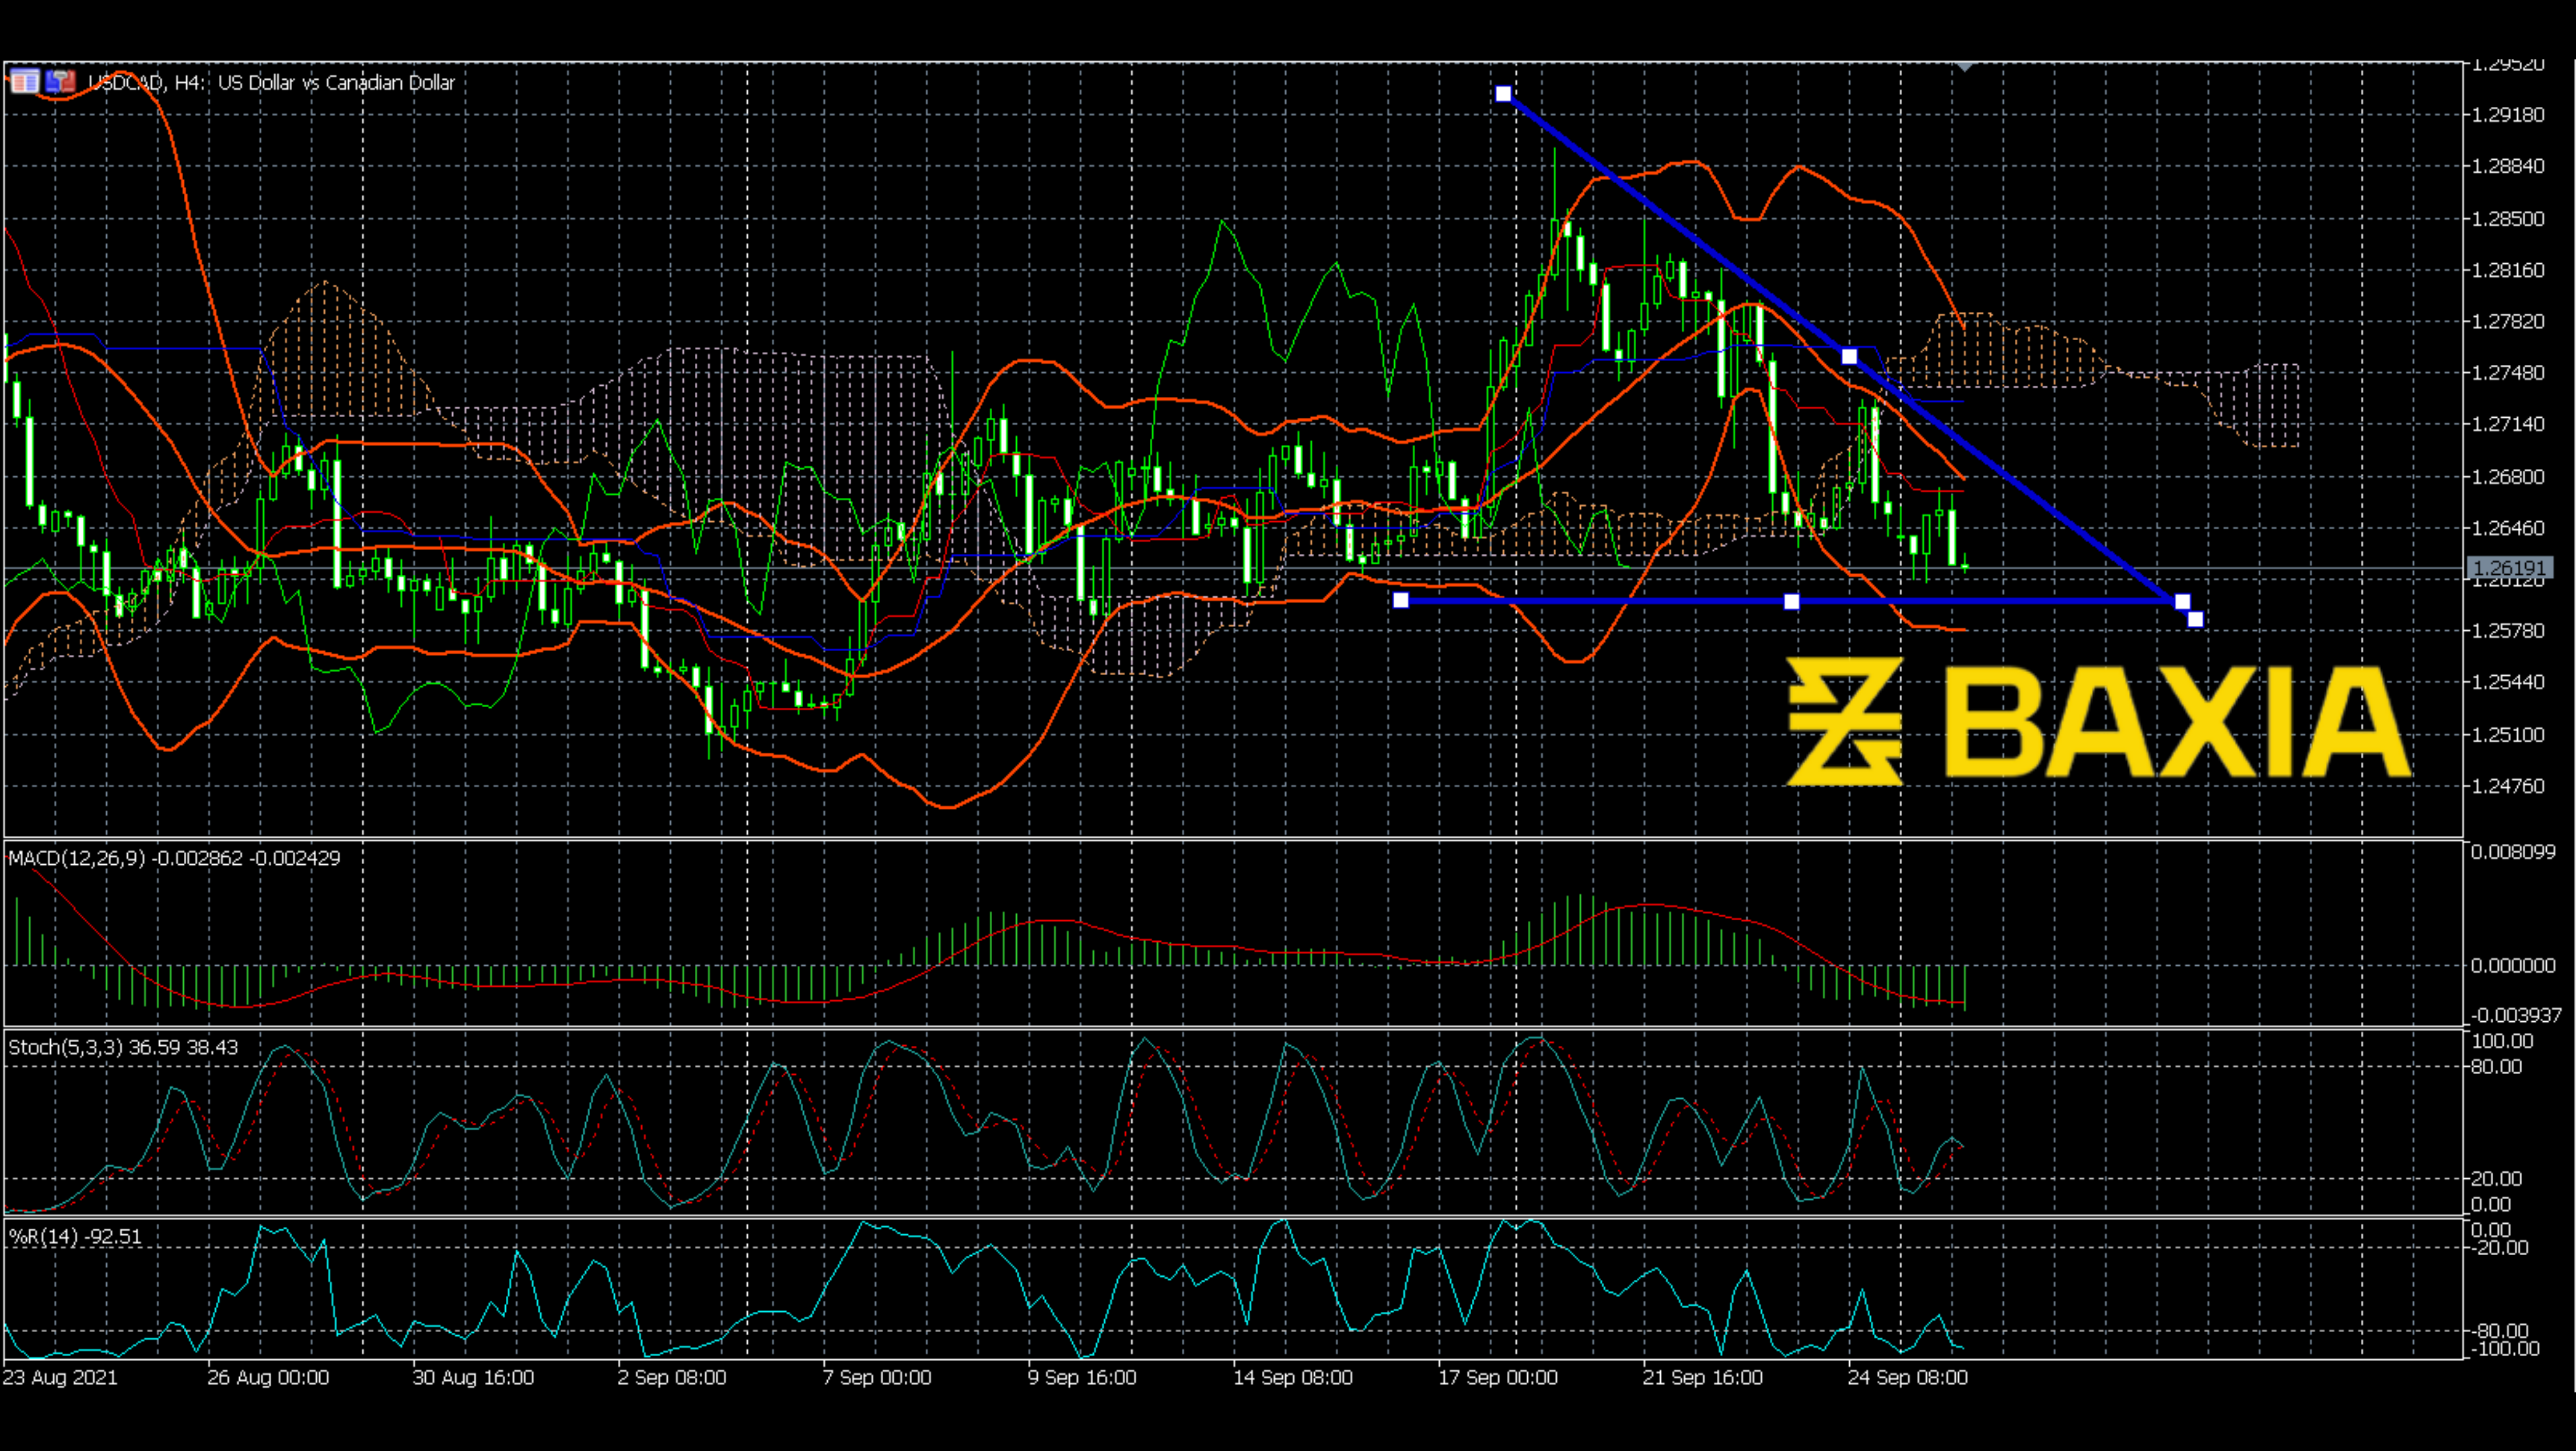
But we can still find some hints on those fluctuations. Here we can see, the fluctuations have been making a Descending triangle. As we know, the descending triangle is a bearish signal, which means the price would break down when the triangle finishes. Will the USDCAD go down soon? We already got some signals here. The MACD moved below the zero level. Although the MACD made a bullish cross recently, it just revealed a temporary fluctuation signal. Ichimoku has moved above the price line earlier. Stochastics are going down and just made a cross. I know the Williams R% oversold situation may look unstable; however, the oversold situation could last.
We love to hear new ideas from traders and want to know what you think!
If you like this topic and want to suggest future topics that you find helpful, let us know by clicking the ‘submit your feedback’ button below.

Trading foreign exchange on margin carries a high level of risk, and may not be suitable for all investors. Before deciding to trade foreign exchange you should carefully consider your investment objectives, level of experience, and risk appetite.
Nothing contained in this website should be construed as investment advice. Any reference to an investment's past or potential performance is not, and should not be construed as, a recommendation or as a guarantee of any specific outcome or profit.