The AUDCAD currency pair recently experienced significant volatility, breaking through a key resistance level at 0.9125, only to swiftly retreat below it. This movement was marked by the formation of a dark cloud cover candlestick pattern, a strong signal of a potential bearish reversal. In this article, we delve into the technical and fundamental factors influencing AUDCAD, providing a comprehensive analysis of the current market sentiment.
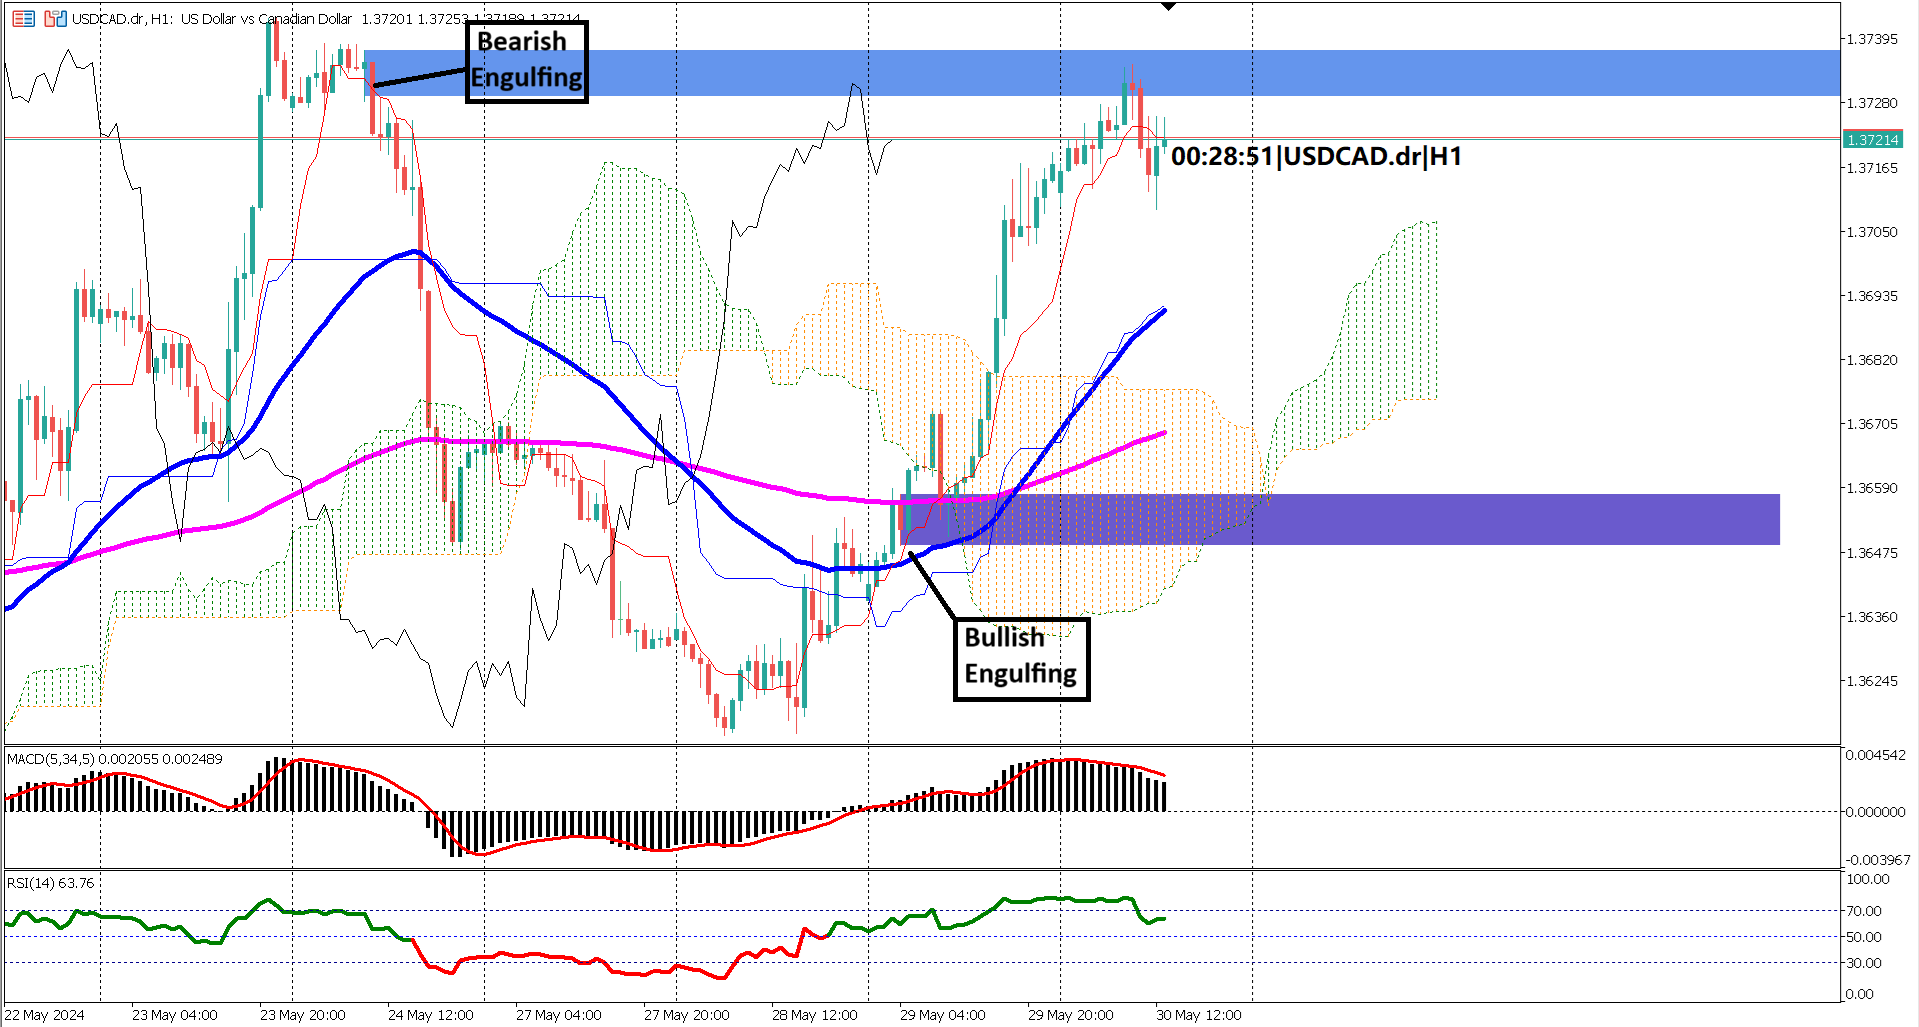
The initial breakout above the 0.9125 resistance level was short-lived, as the subsequent candle reversed below this threshold, forming a dark cloud cover pattern. This pattern is a bearish reversal signal, suggesting that the momentum could be shifting from bullish to bearish.
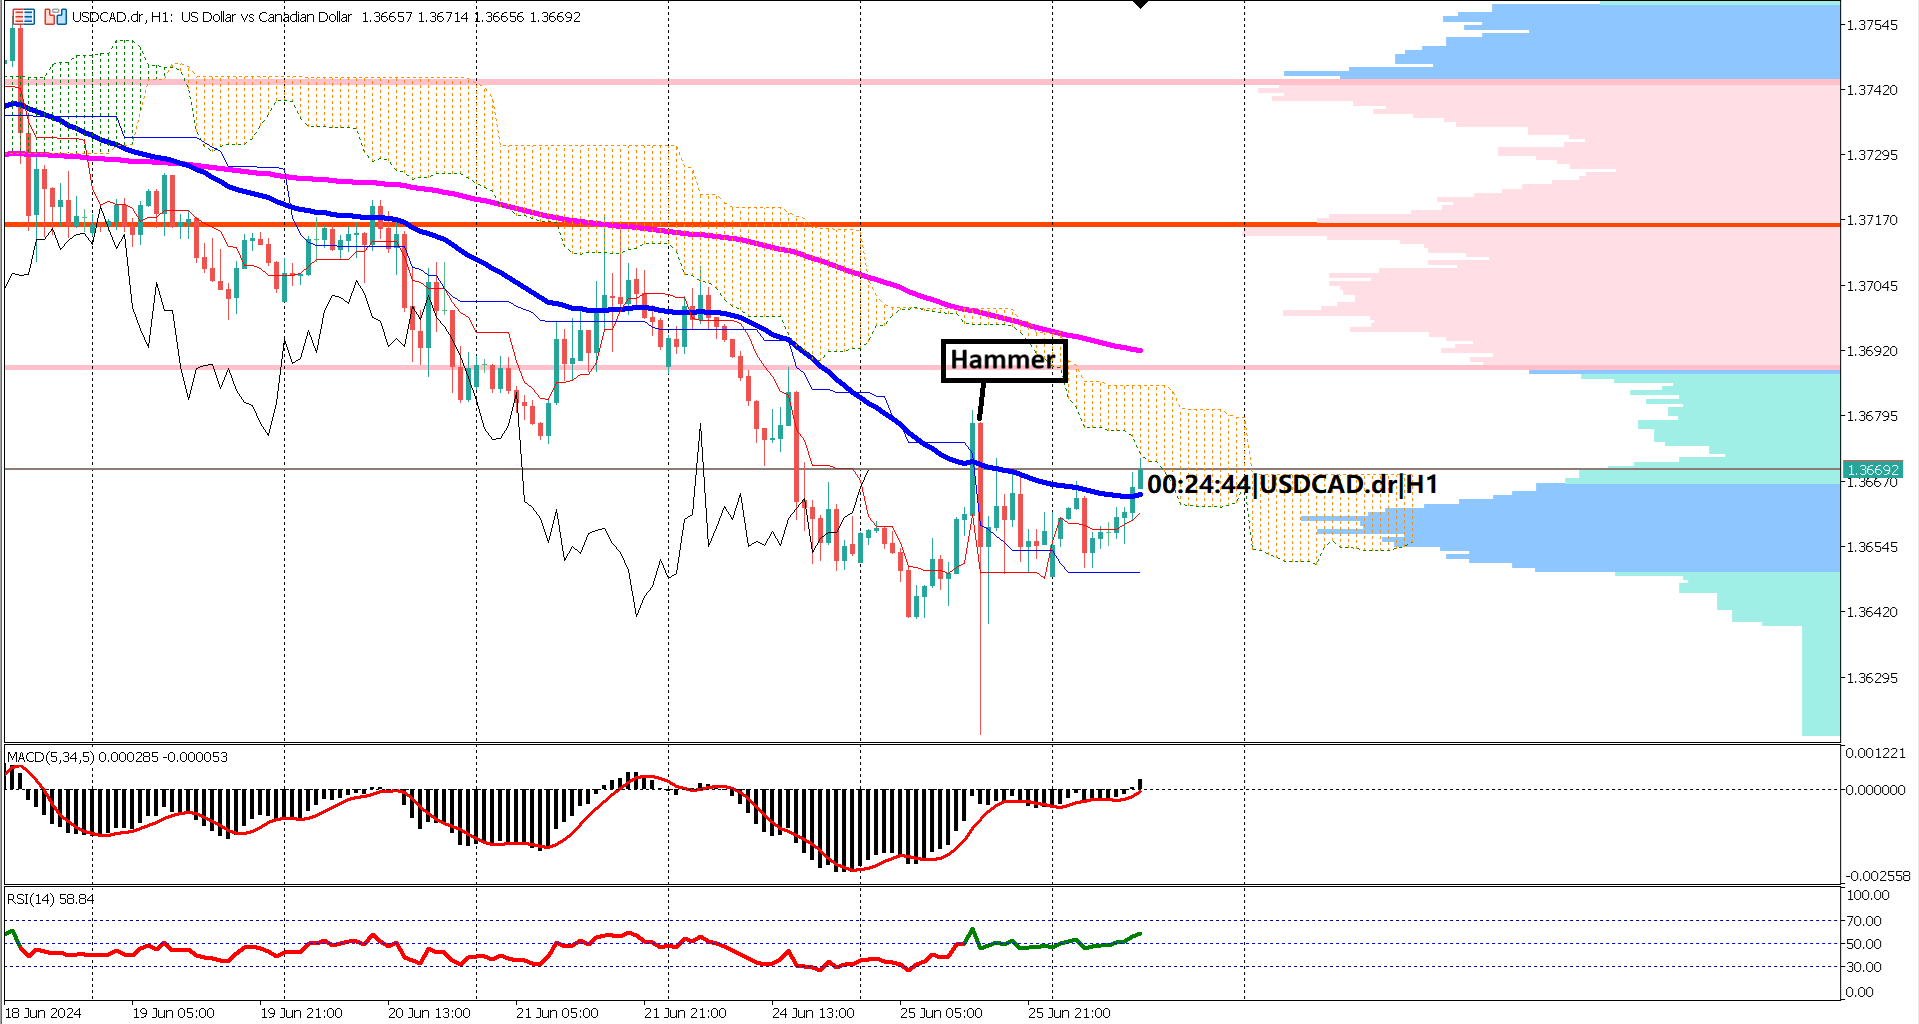
Currently, the market is searching for support around several critical levels, including the EMA 50, EMA 200, and the Ichimoku cloud on the 1-hour time frame chart. The EMA 50 remains positioned above the EMA 200, indicating that the medium to long-term sentiment is still bullish. Furthermore, the Ichimoku indicator remains bullish, with the Chikou Span, Kijun Sen, and Tenkan Sen all positioned above the cloud.
The MACD and RSI oscillators also provide valuable insights into the current market conditions. The MACD signal line is above the zero line, indicating that the bullish momentum is still present. The RSI is also in the bullish zone, as it has not fallen below 40%, reinforcing the overall slightly bullish sentiment.
The key support level to watch is at 0.9078, highlighted in a red rectangle. A break below this level would be a significant bearish signal and could potentially form a double top chart pattern, which is a classic reversal signal. Traders should closely monitor this support level, as its integrity will be crucial in determining whether the bullish trend can persist or if a bearish reversal is imminent.
Recent economic data from Australia has been robust, providing support for the AUD. The Home Loans figure came in significantly higher than forecasted, at 4.3% versus the expected 1.2%, and also exceeded the previous month's figure of 3.5%. Additionally, Australia’s trade balance came in higher than expected, with an actual figure of 6.548 billion compared to the forecasted 5.370 billion and the previous 4.841 billion. These positive data points contributed to the initial bullish momentum that broke the 0.9125 resistance level.
On the Canadian side, the market is anticipating the release of the trade balance figures. Economists are forecasting a slightly higher trade balance for Canada compared to the previous period. This data will be crucial in determining the next directional move for the CAD, and by extension, the AUDCAD pair. A stronger-than-expected trade balance could provide support for the CAD, potentially exerting downward pressure on AUD/CAD.
The AUDCAD pair is currently exhibiting a slightly bullish sentiment, supported by strong economic data from Australia and the technical indicators. However, the formation of the dark cloud cover pattern and the subsequent retreat below the 0.9125 resistance level suggest that caution is warranted.
Traders should closely monitor the key support level at 0.9078, as a break below this level could signal a bearish reversal and the formation of a double top pattern. Additionally, the upcoming Canadian trade balance data will play a crucial role in shaping the near-term outlook for the pair.
Overall, while the medium to long-term sentiment remains bullish, the market is at a critical juncture. The integrity of the support levels and the reaction to upcoming economic data will be decisive in determining whether the bullish trend can continue or if a bearish reversal is on the horizon.
Actual 4.3% vs Forecast 1.2% vs Previous 3.5%
Actual 6.548B vs Forecast 5.370B vs Previous 4.841B
Forecast 220K vs Previous 219K
Forecast -76.20B vs Previous -69.40B
Forecast 4.7% vs Previous 0.4%
Forecast 1,790K vs Previous 1,791K
Forecast -1.20B vs Previous -2.28B

Trading foreign exchange on margin carries a high level of risk, and may not be suitable for all investors. Before deciding to trade foreign exchange you should carefully consider your investment objectives, level of experience, and risk appetite.
Nothing contained in this website should be construed as investment advice. Any reference to an investment's past or potential performance is not, and should not be construed as, a recommendation or as a guarantee of any specific outcome or profit.