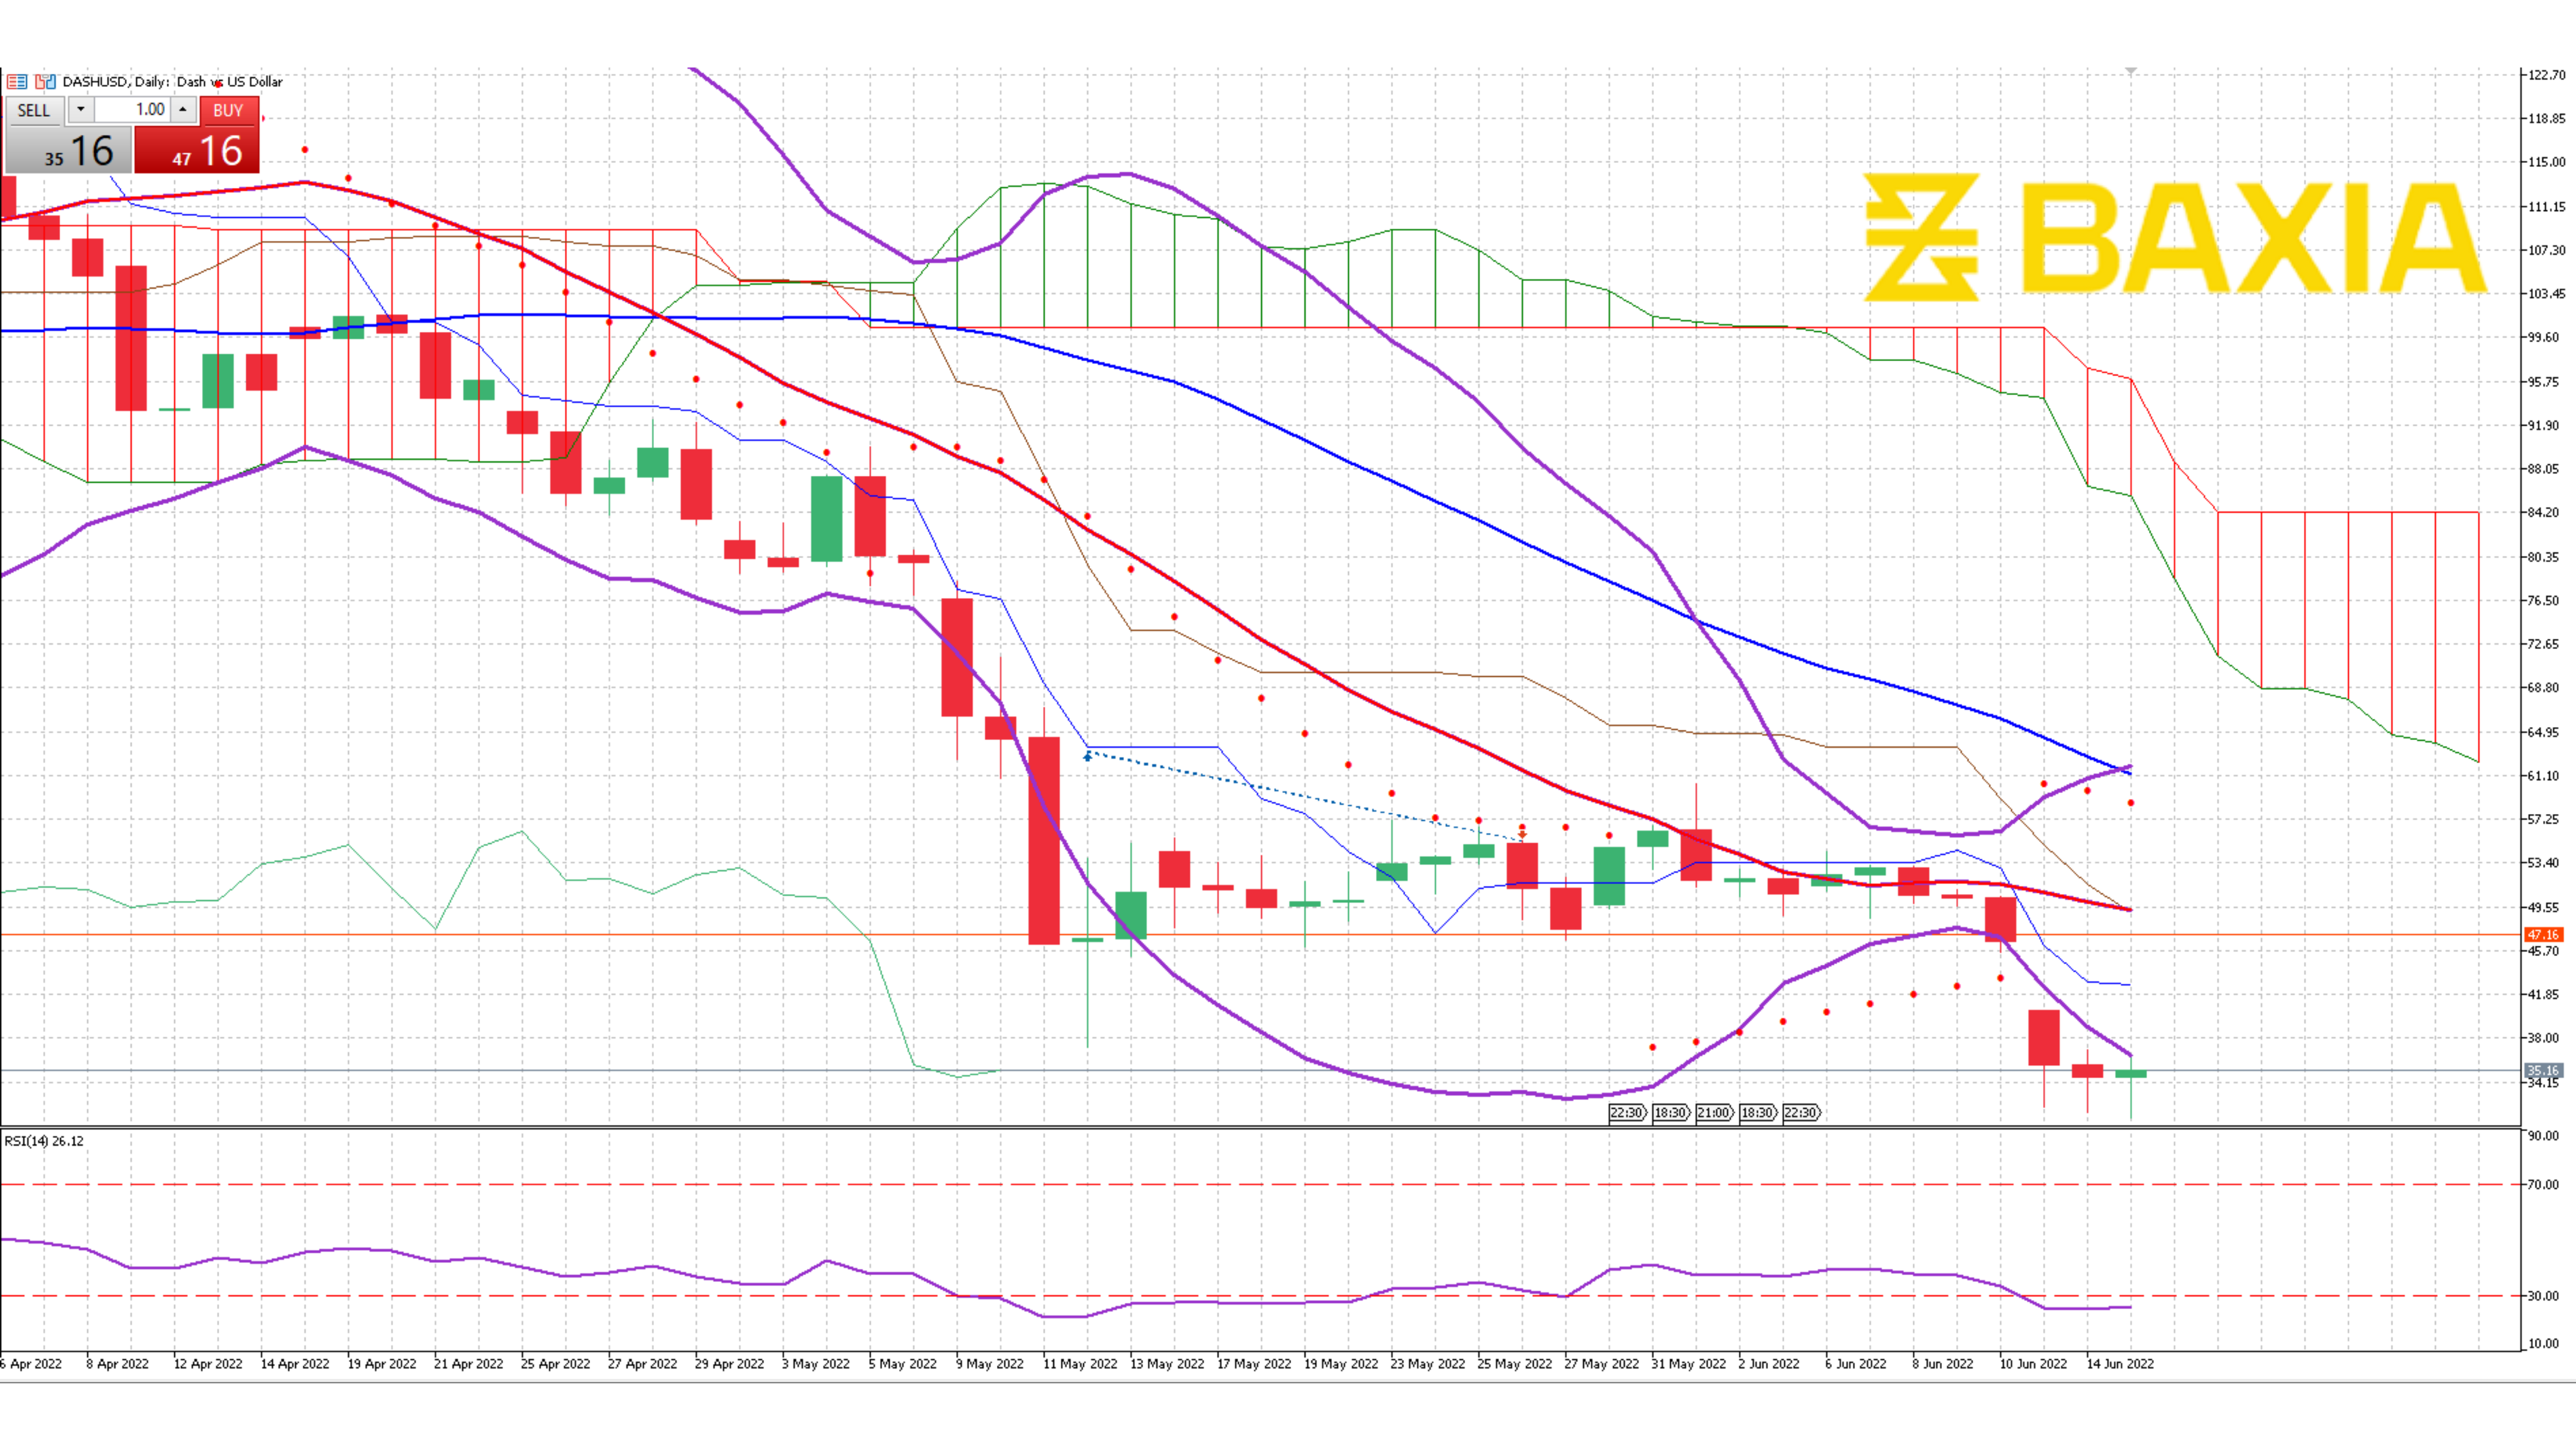

The cryptocurrency is struggling to break the resistance level at $38,547 after sinking to $37,400 in the previous trading session, its lowest level since March 7th. The gap between the short and long-term moving averages continues expanding, strengthening the short signals.
The Bollinger bands are somewhat narrow but we can see the edges opening up, which usually indicates a trend change and will likely bring higher volatility to BTCUSD. The pair traded below the lower band, suggesting that the price was relatively low, which pushed the price upwards as investors are entering the market at a low price, so far sellers are winning the battle.
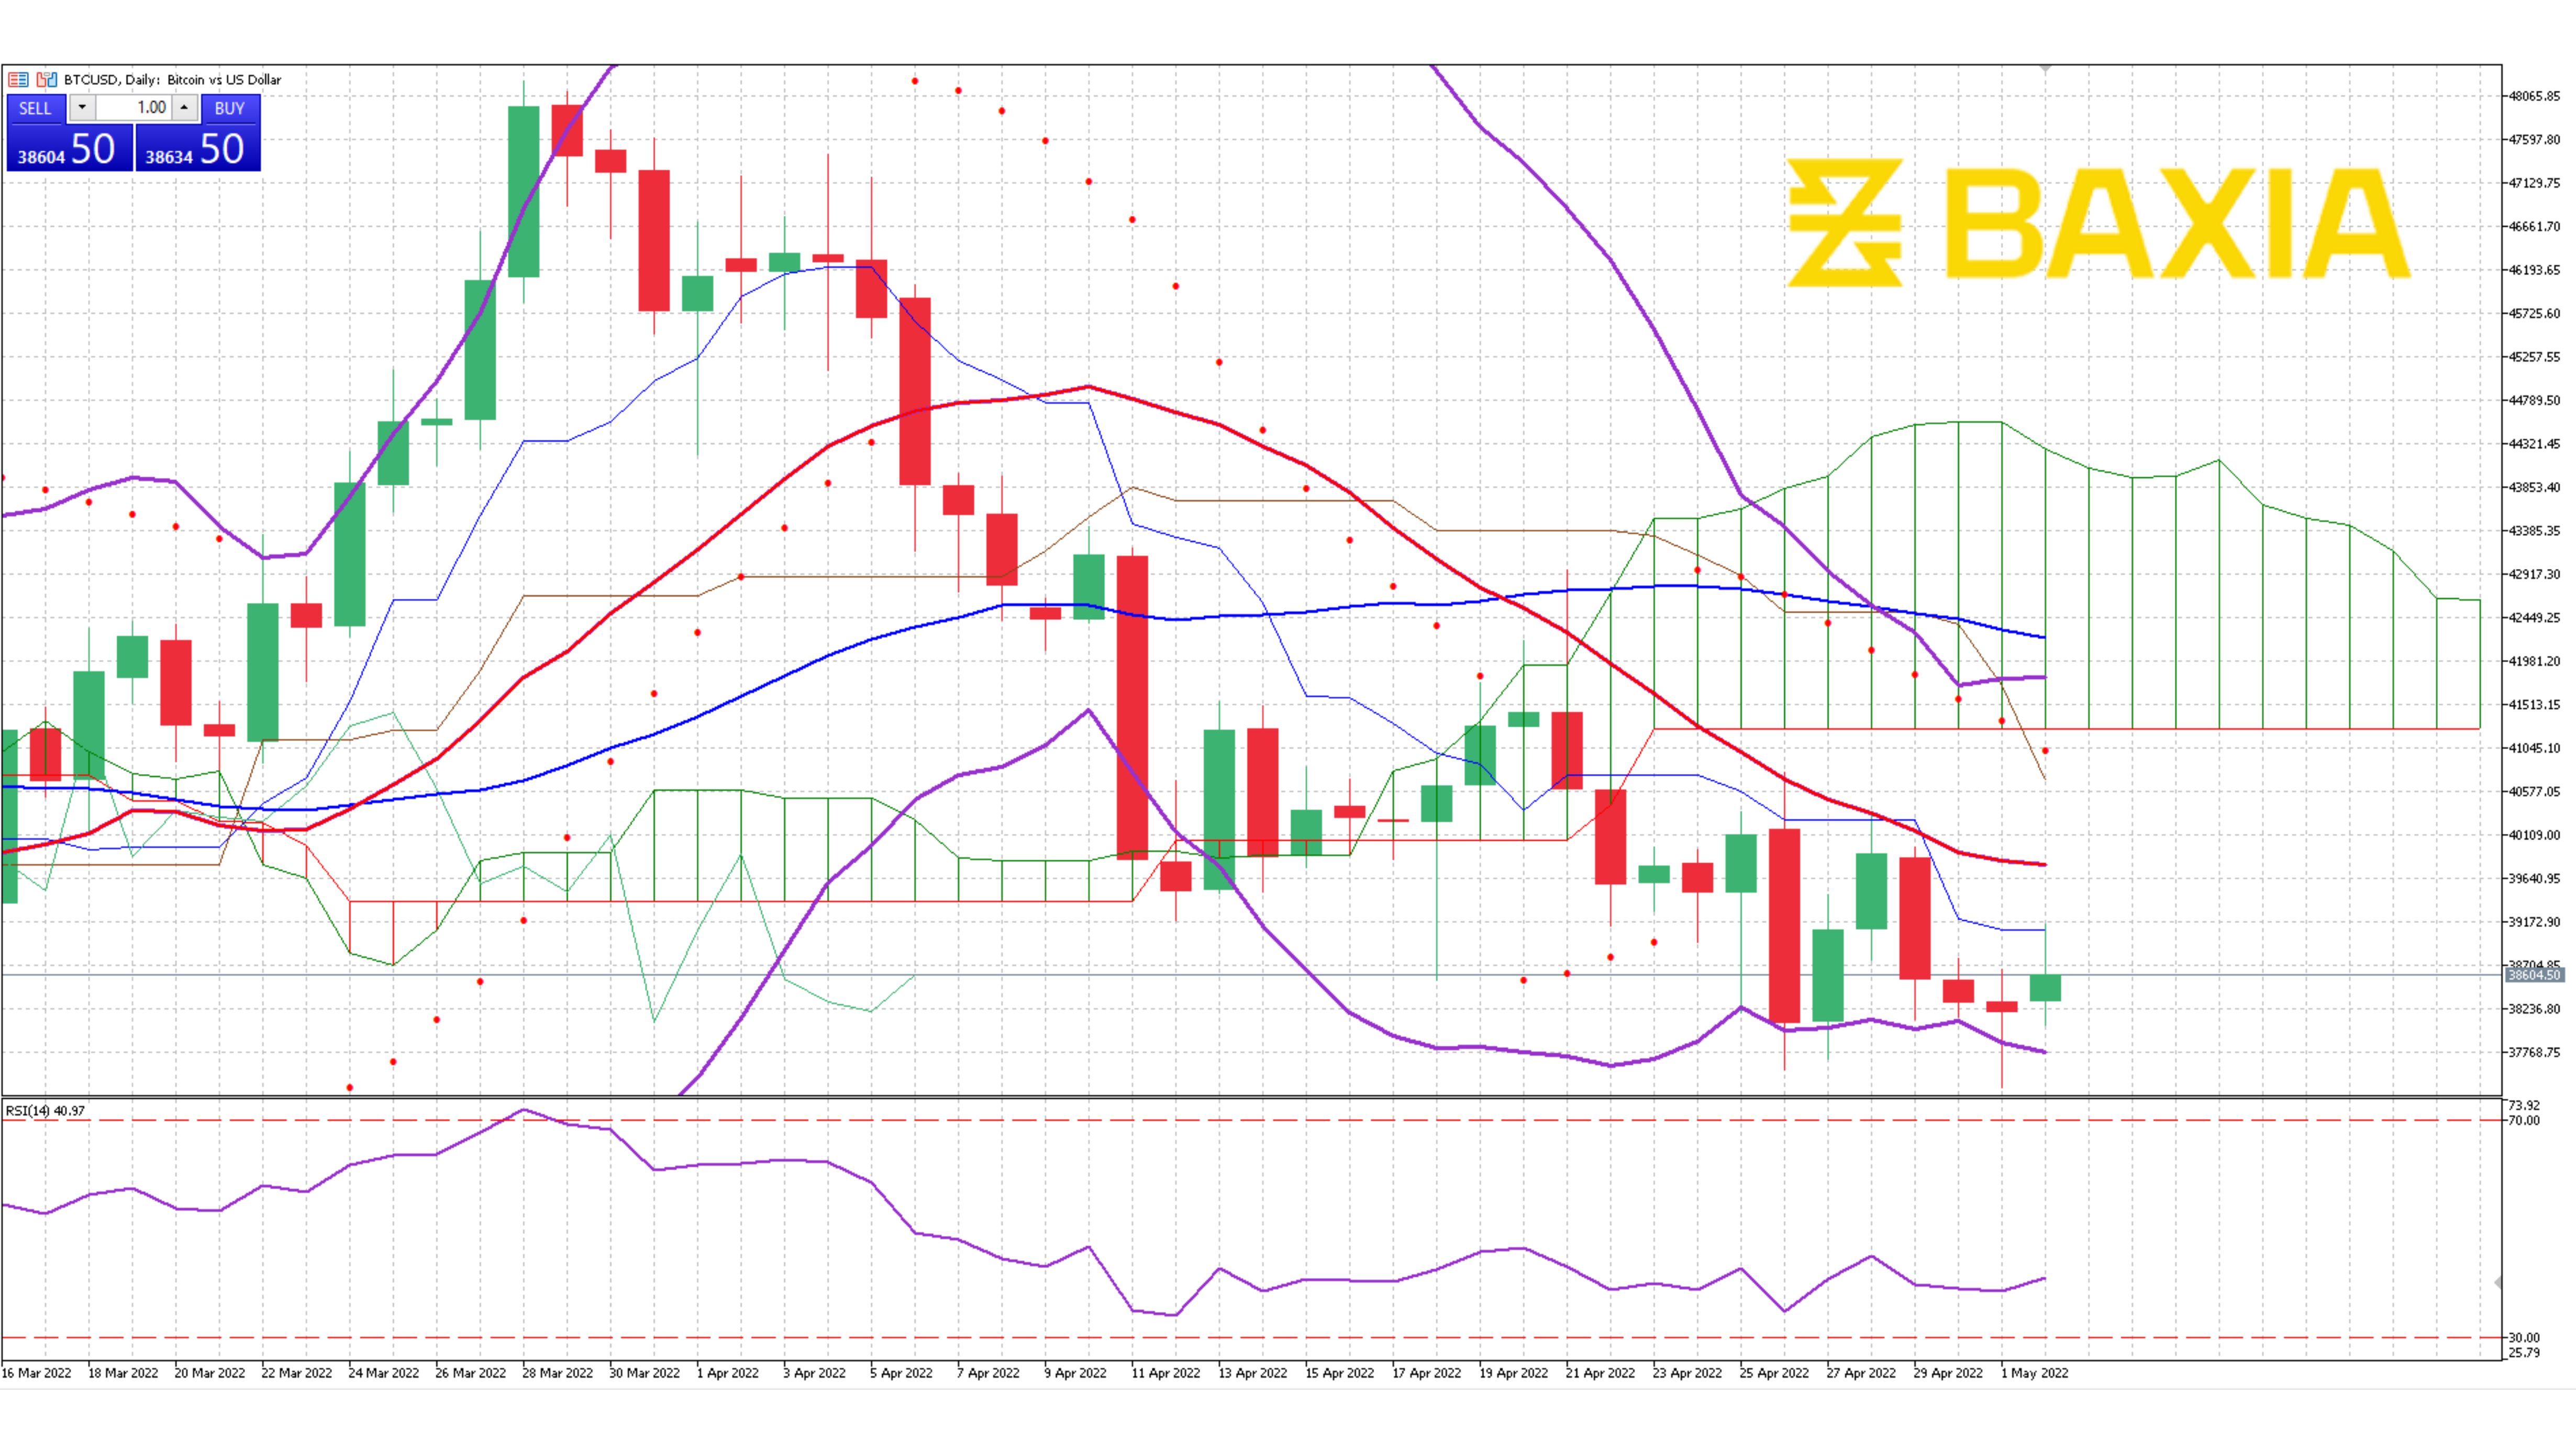
The relative strength index is at 41%, this will allow the pair to move upwards freely, but we could still see the pair fall a few more points before it enters the oversold status and starts recovering. Our parabolic SAR indicator suggests that the pair will continue moving downwards in the short term. The next support level sits at $37,400.
We love to hear new ideas from traders and want to know what you think!
If you like this topic and want to suggest future topics that you find helpful, let us know by clicking the ‘submit your feedback’ button below.

Trading foreign exchange on margin carries a high level of risk, and may not be suitable for all investors. Before deciding to trade foreign exchange you should carefully consider your investment objectives, level of experience, and risk appetite.
Nothing contained in this website should be construed as investment advice. Any reference to an investment's past or potential performance is not, and should not be construed as, a recommendation or as a guarantee of any specific outcome or profit.