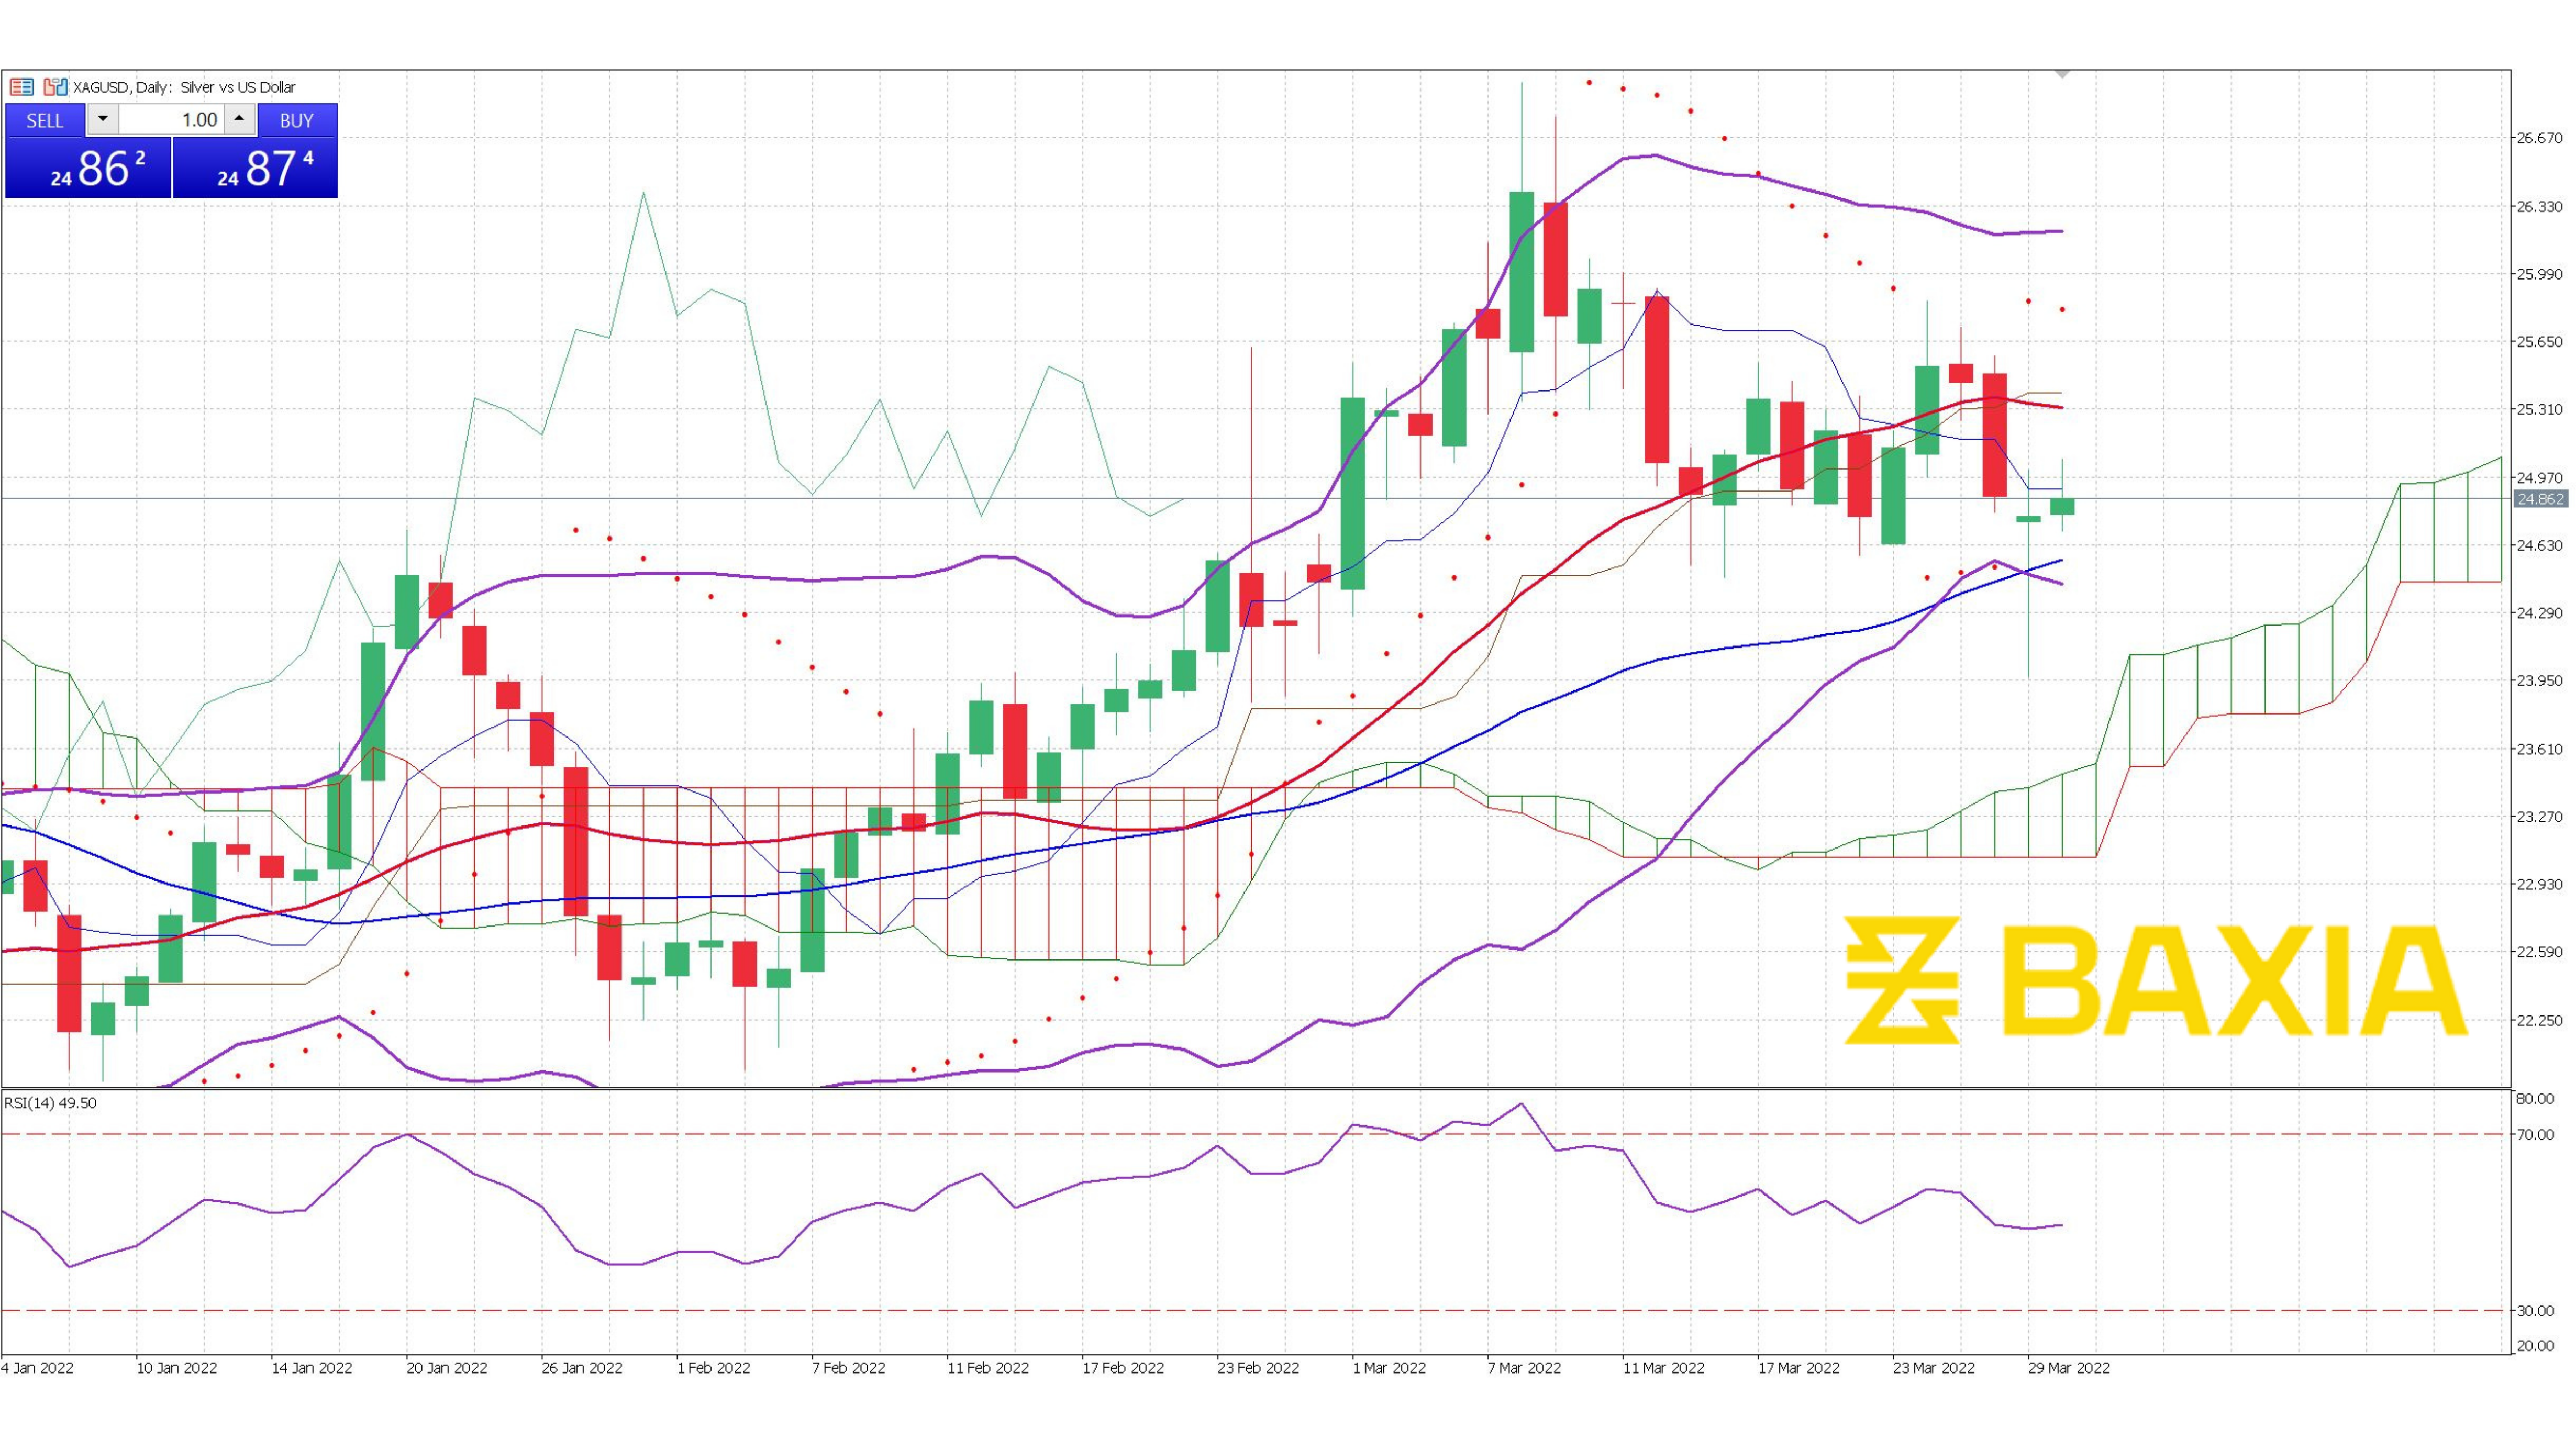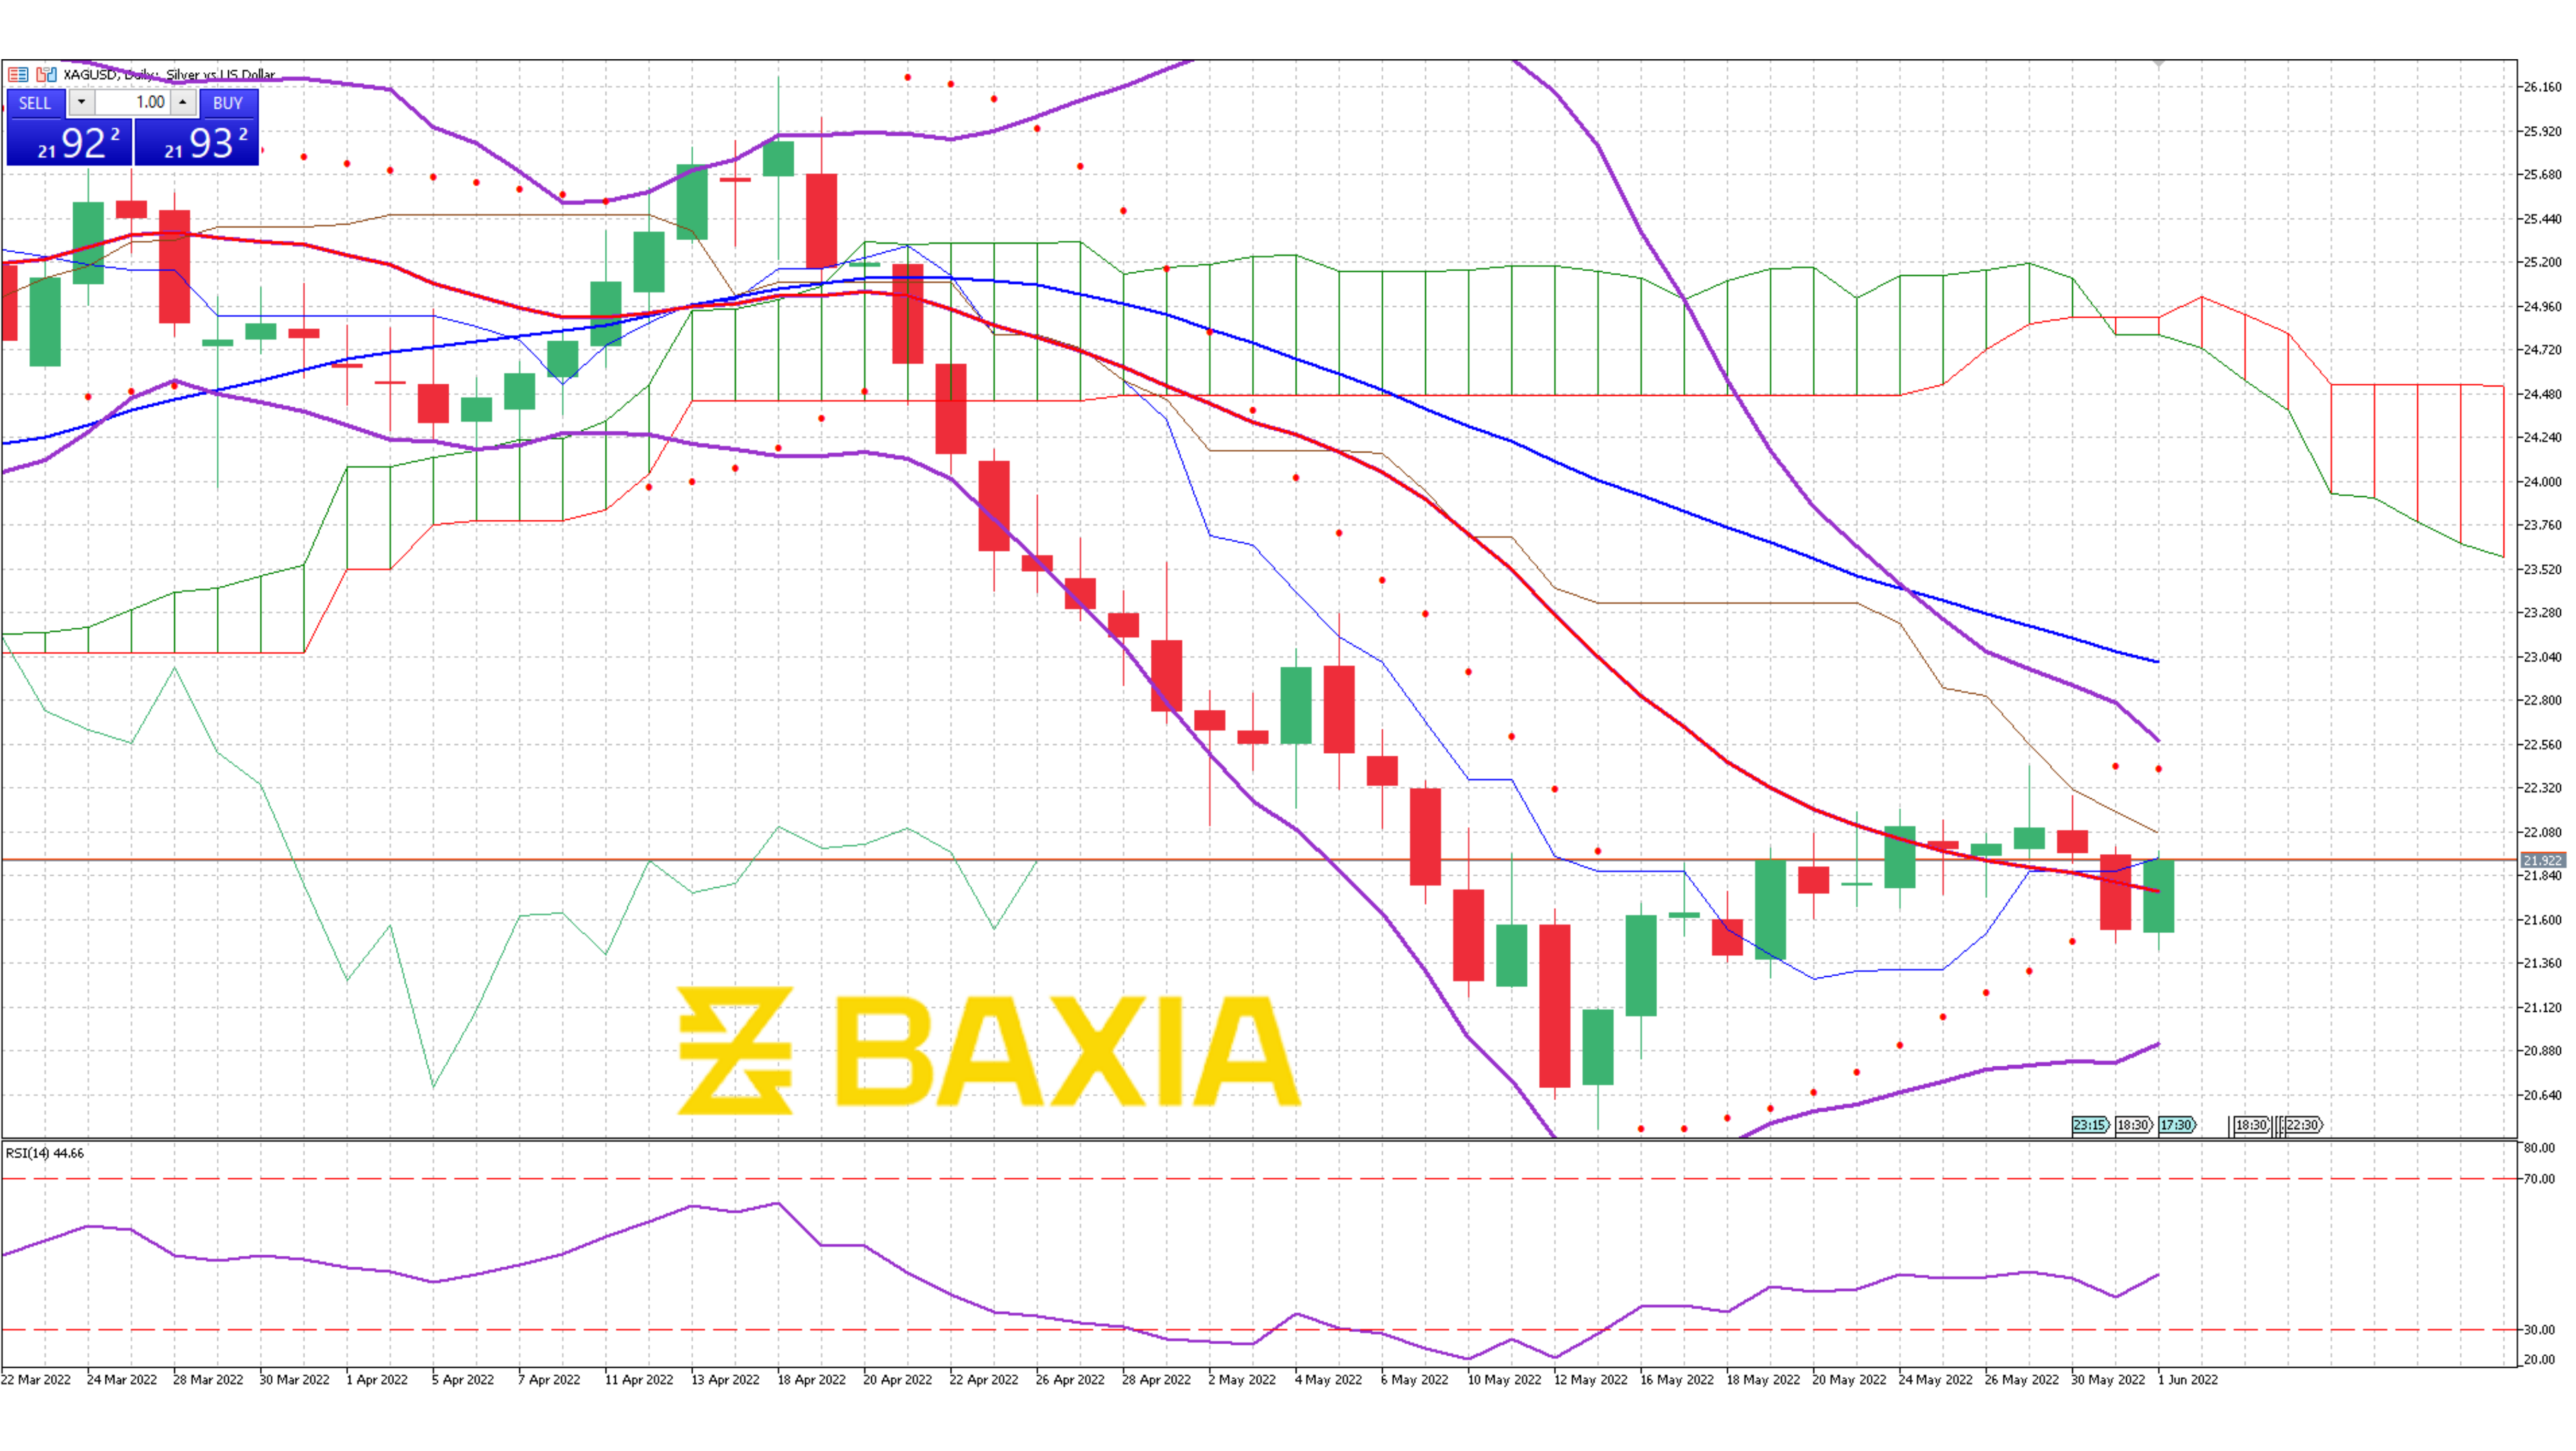

The precious metal is now on a general downwards trend as the price managed to break the support level from our 50% Fibonacci retracement. The pair showed some signs of recovery in mid-April but was not able to hold on to those gains, the short and long-term moving averages crossed on April 19th and the pair continues losing ground since then reaching its lowest level since February 16th.
The Bollinger bands are wide and almost symmetrical, volatility should be higher in the upcoming trading sessions, the pair trades below the lower band, suggesting that the price is relatively low. Traders might see this as an opportunity to enter the market at a low price which is likely to push the price upwards. The resistance level is at $1,888 on our 23.6% Fibonacci retracement.
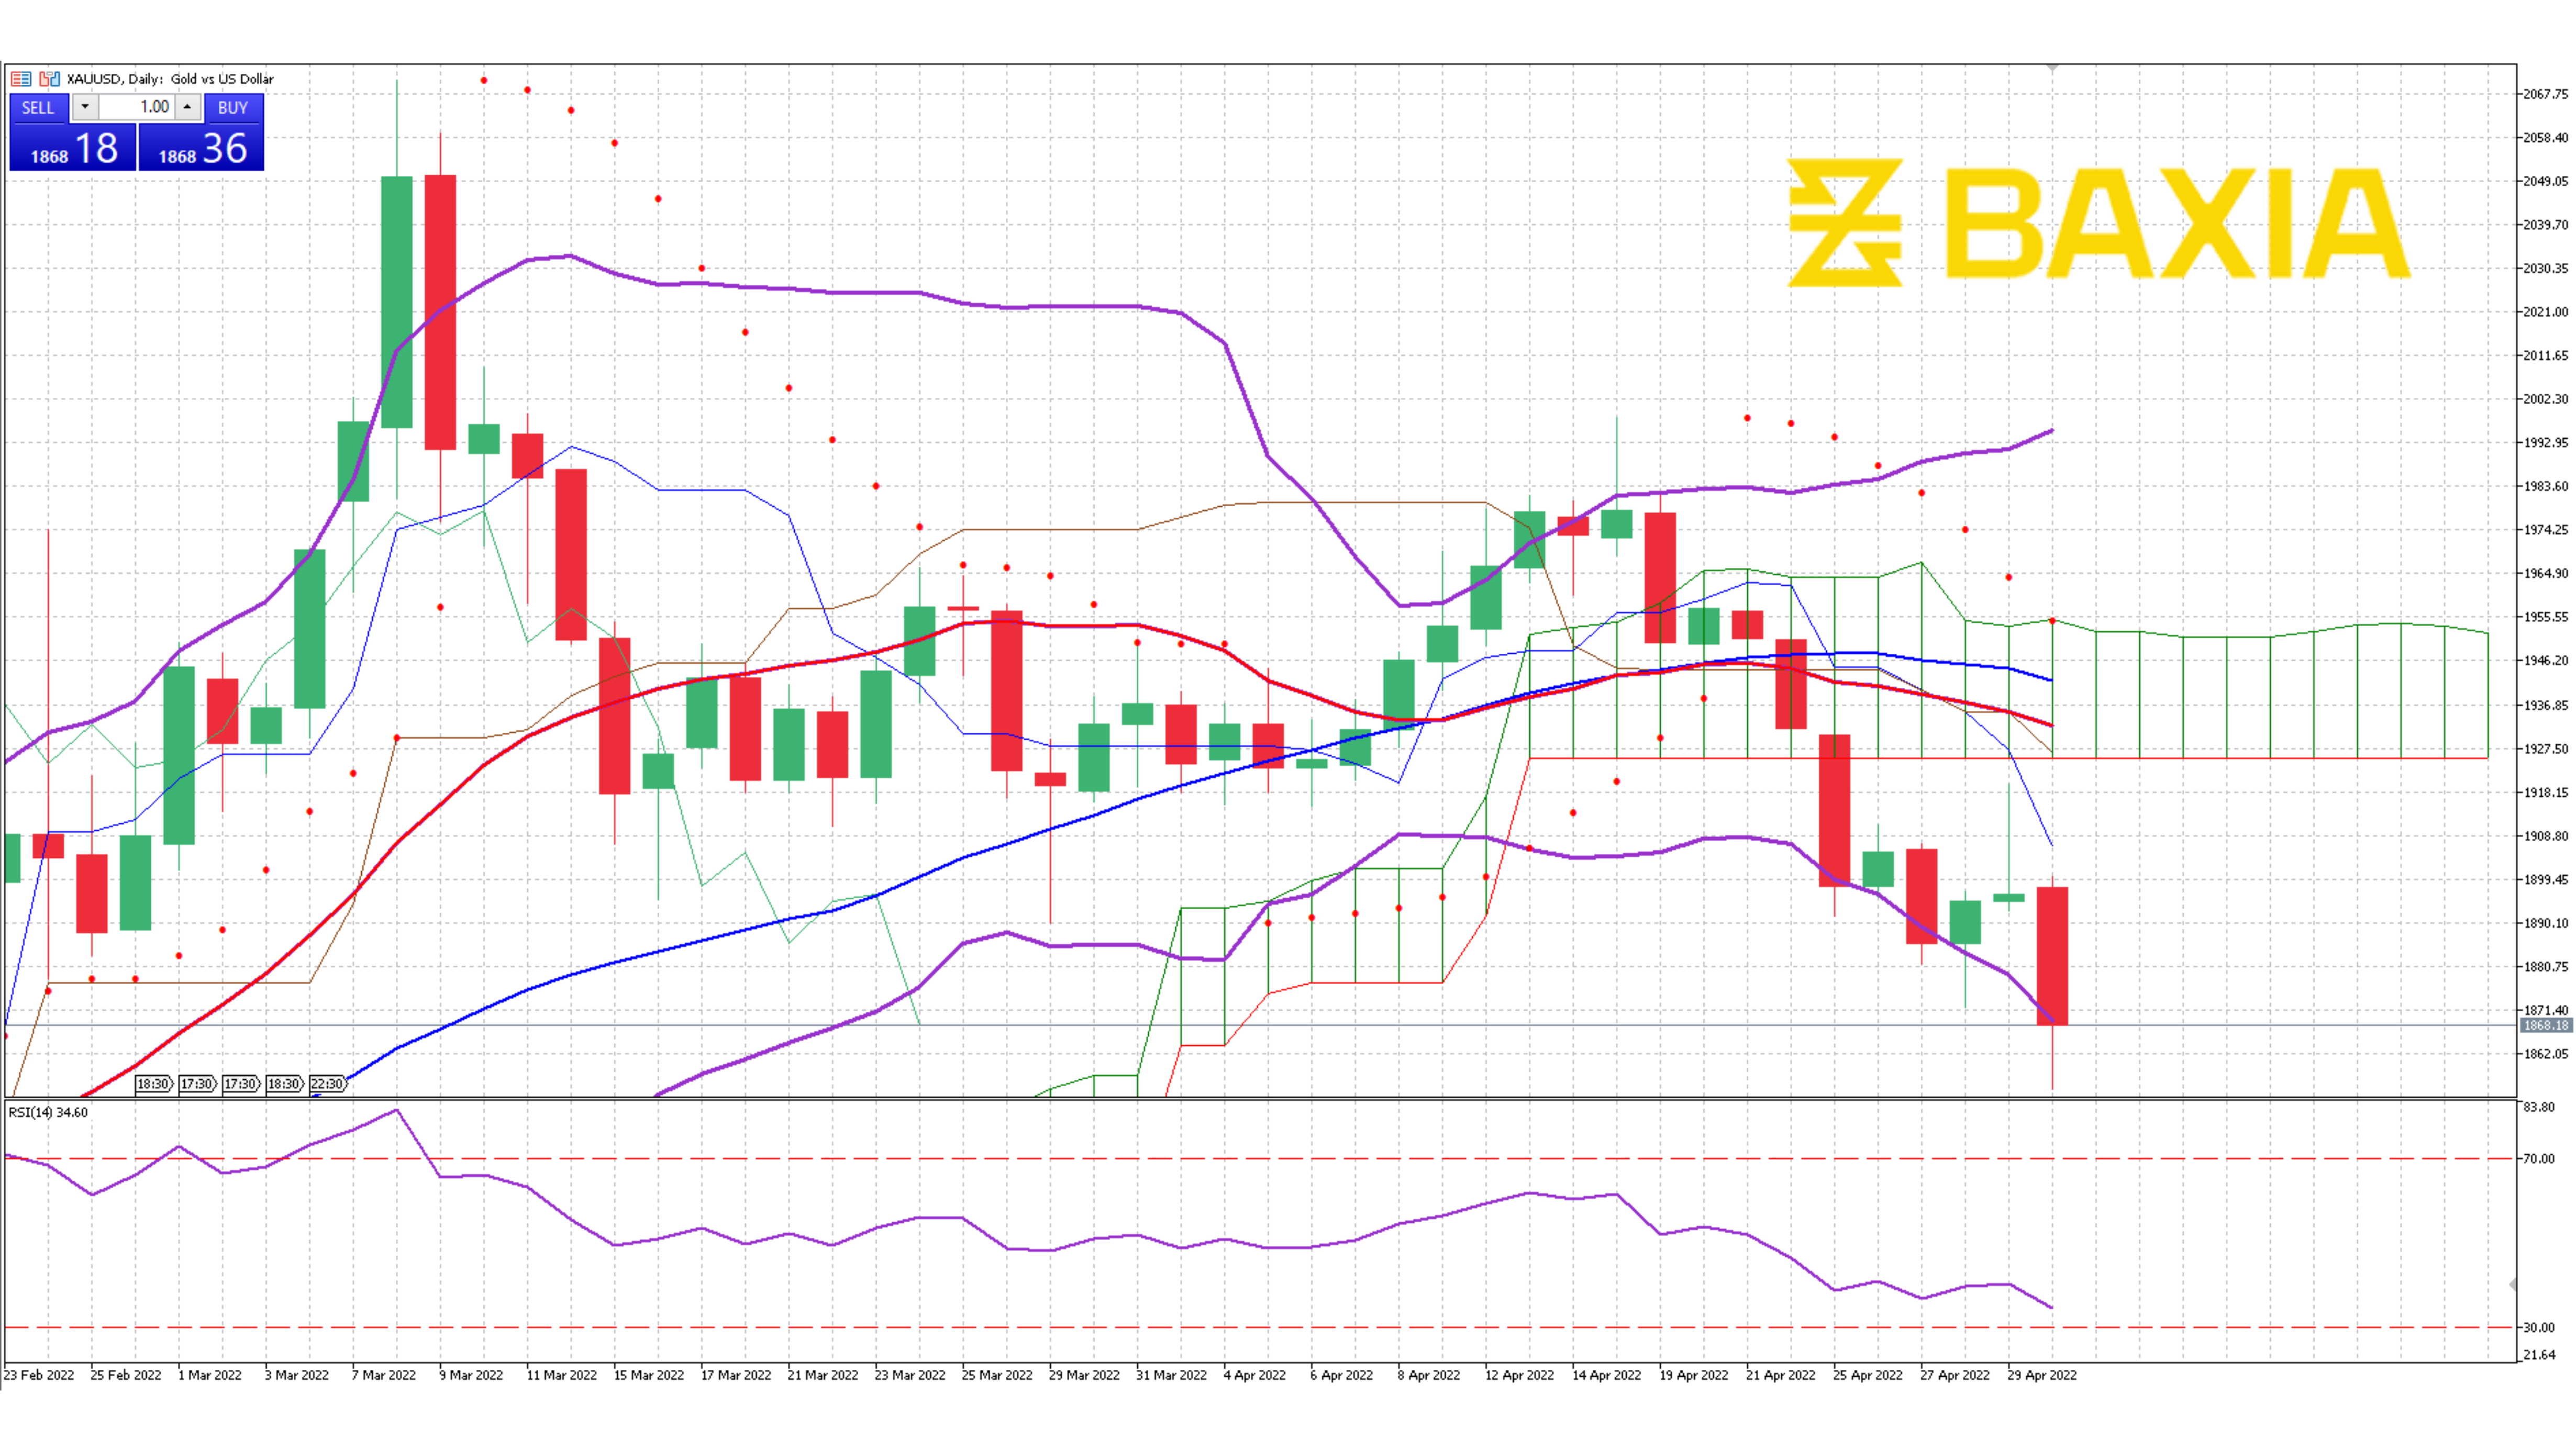
The relative strength index is at 34% which will not allow Gold to sink much more before we see the price bounce a bit. Our parabolic SAR indicator suggests that the price will continue to move downwards in the short term.
We love to hear new ideas from traders and want to know what you think!
If you like this topic and want to suggest future topics that you find helpful, let us know by clicking the ‘submit your feedback’ button below.

Trading foreign exchange on margin carries a high level of risk, and may not be suitable for all investors. Before deciding to trade foreign exchange you should carefully consider your investment objectives, level of experience, and risk appetite.
Nothing contained in this website should be construed as investment advice. Any reference to an investment's past or potential performance is not, and should not be construed as, a recommendation or as a guarantee of any specific outcome or profit.