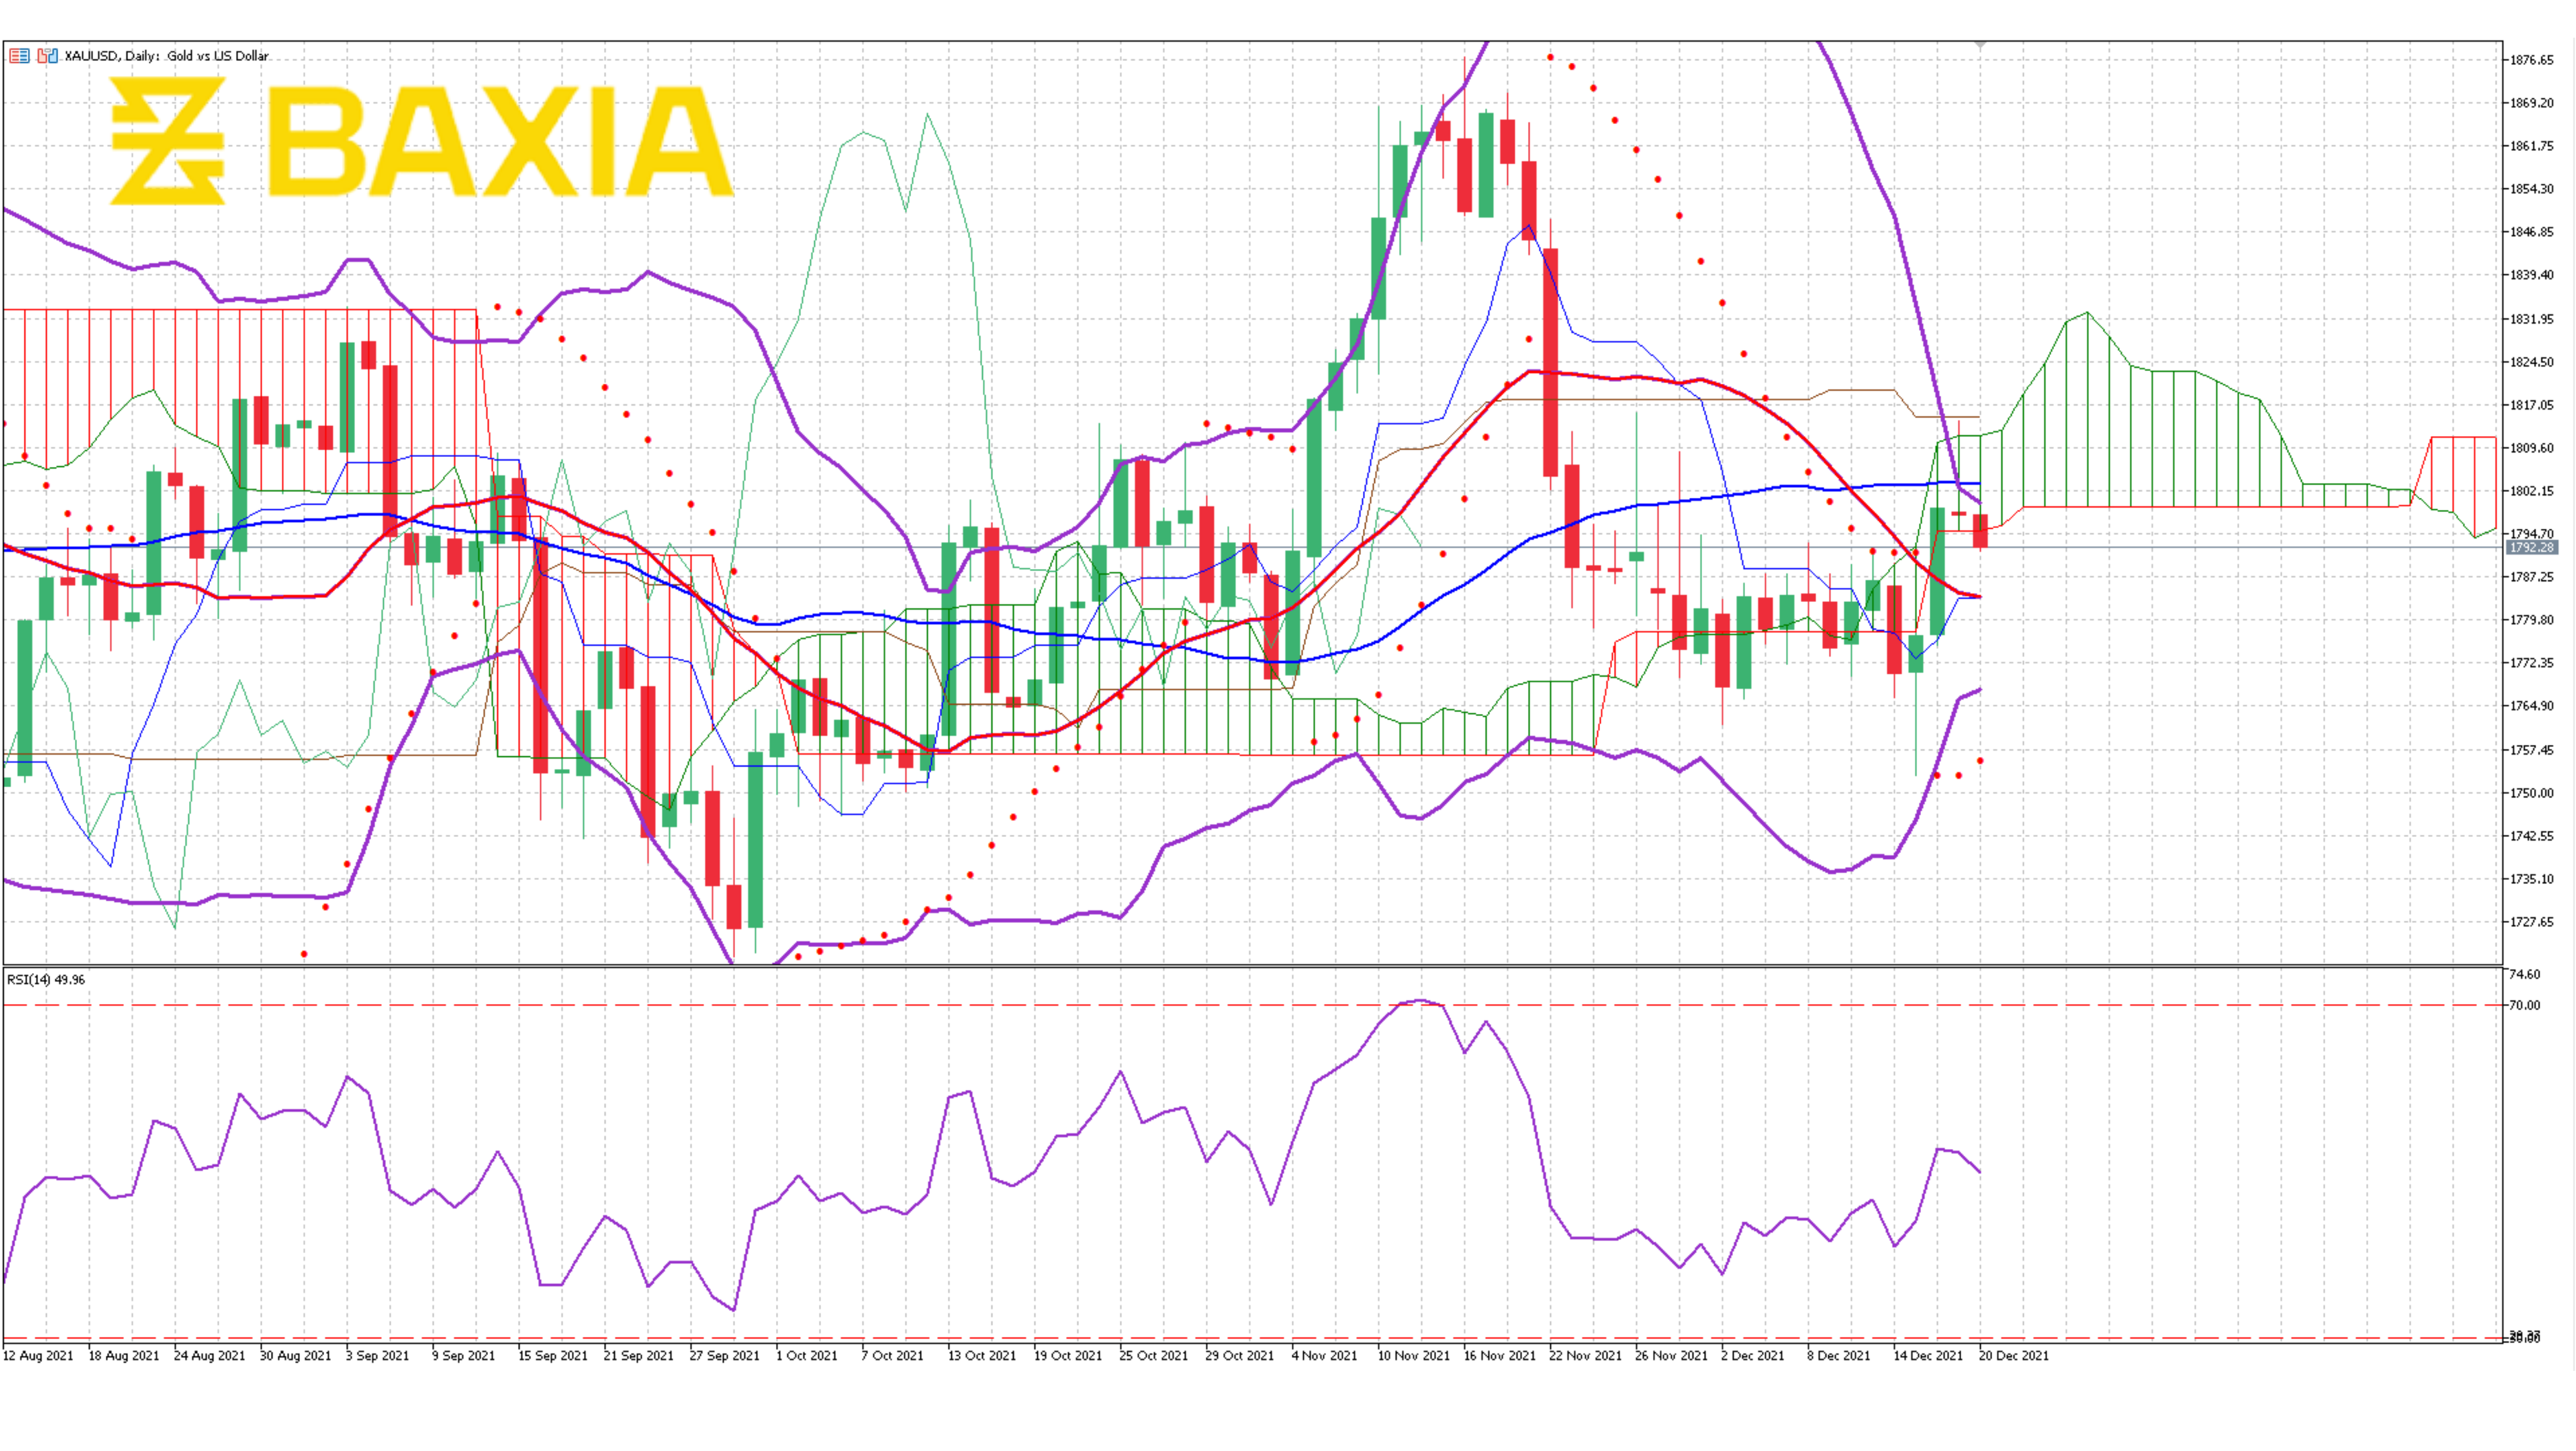

The precious metal made a slight recovery in the last five trading sessions, where it went from $1,761 to $1,792. The pair is on a five-day winning streak. There was a big gap on the session reopening, and the pair managed to bank those earlier earnings.
The Bollinger bands are closing up, but they are still very wide, and we can have high volatility in the short term. Most technical indicators suggest that a downtrend will start soon; however, it's hard to tell as there are some investors that continue buying the commodity amid inflation fears.
The relative strength index went to 30% last week, and since then, the pair has been recovering considerably and consistently. The RSI is now at 43%, allowing the price to continue its uptrend for the short term.
If the price can break the resistance level at $1,796, we would expect the price to continue railing and enter the Ichimoku cloud, which is very broad. There could be market uncertainty during this time, and the price can make it to the $ 1,810's shortly after.
Our parabolic SAR indicator suggests that an uptrend is on the way.
We love to hear new ideas from traders and want to know what you think!
If you like this topic and want to suggest future topics that you find helpful, let us know by clicking the ‘submit your feedback’ button below.

Trading foreign exchange on margin carries a high level of risk, and may not be suitable for all investors. Before deciding to trade foreign exchange you should carefully consider your investment objectives, level of experience, and risk appetite.
Nothing contained in this website should be construed as investment advice. Any reference to an investment's past or potential performance is not, and should not be construed as, a recommendation or as a guarantee of any specific outcome or profit.