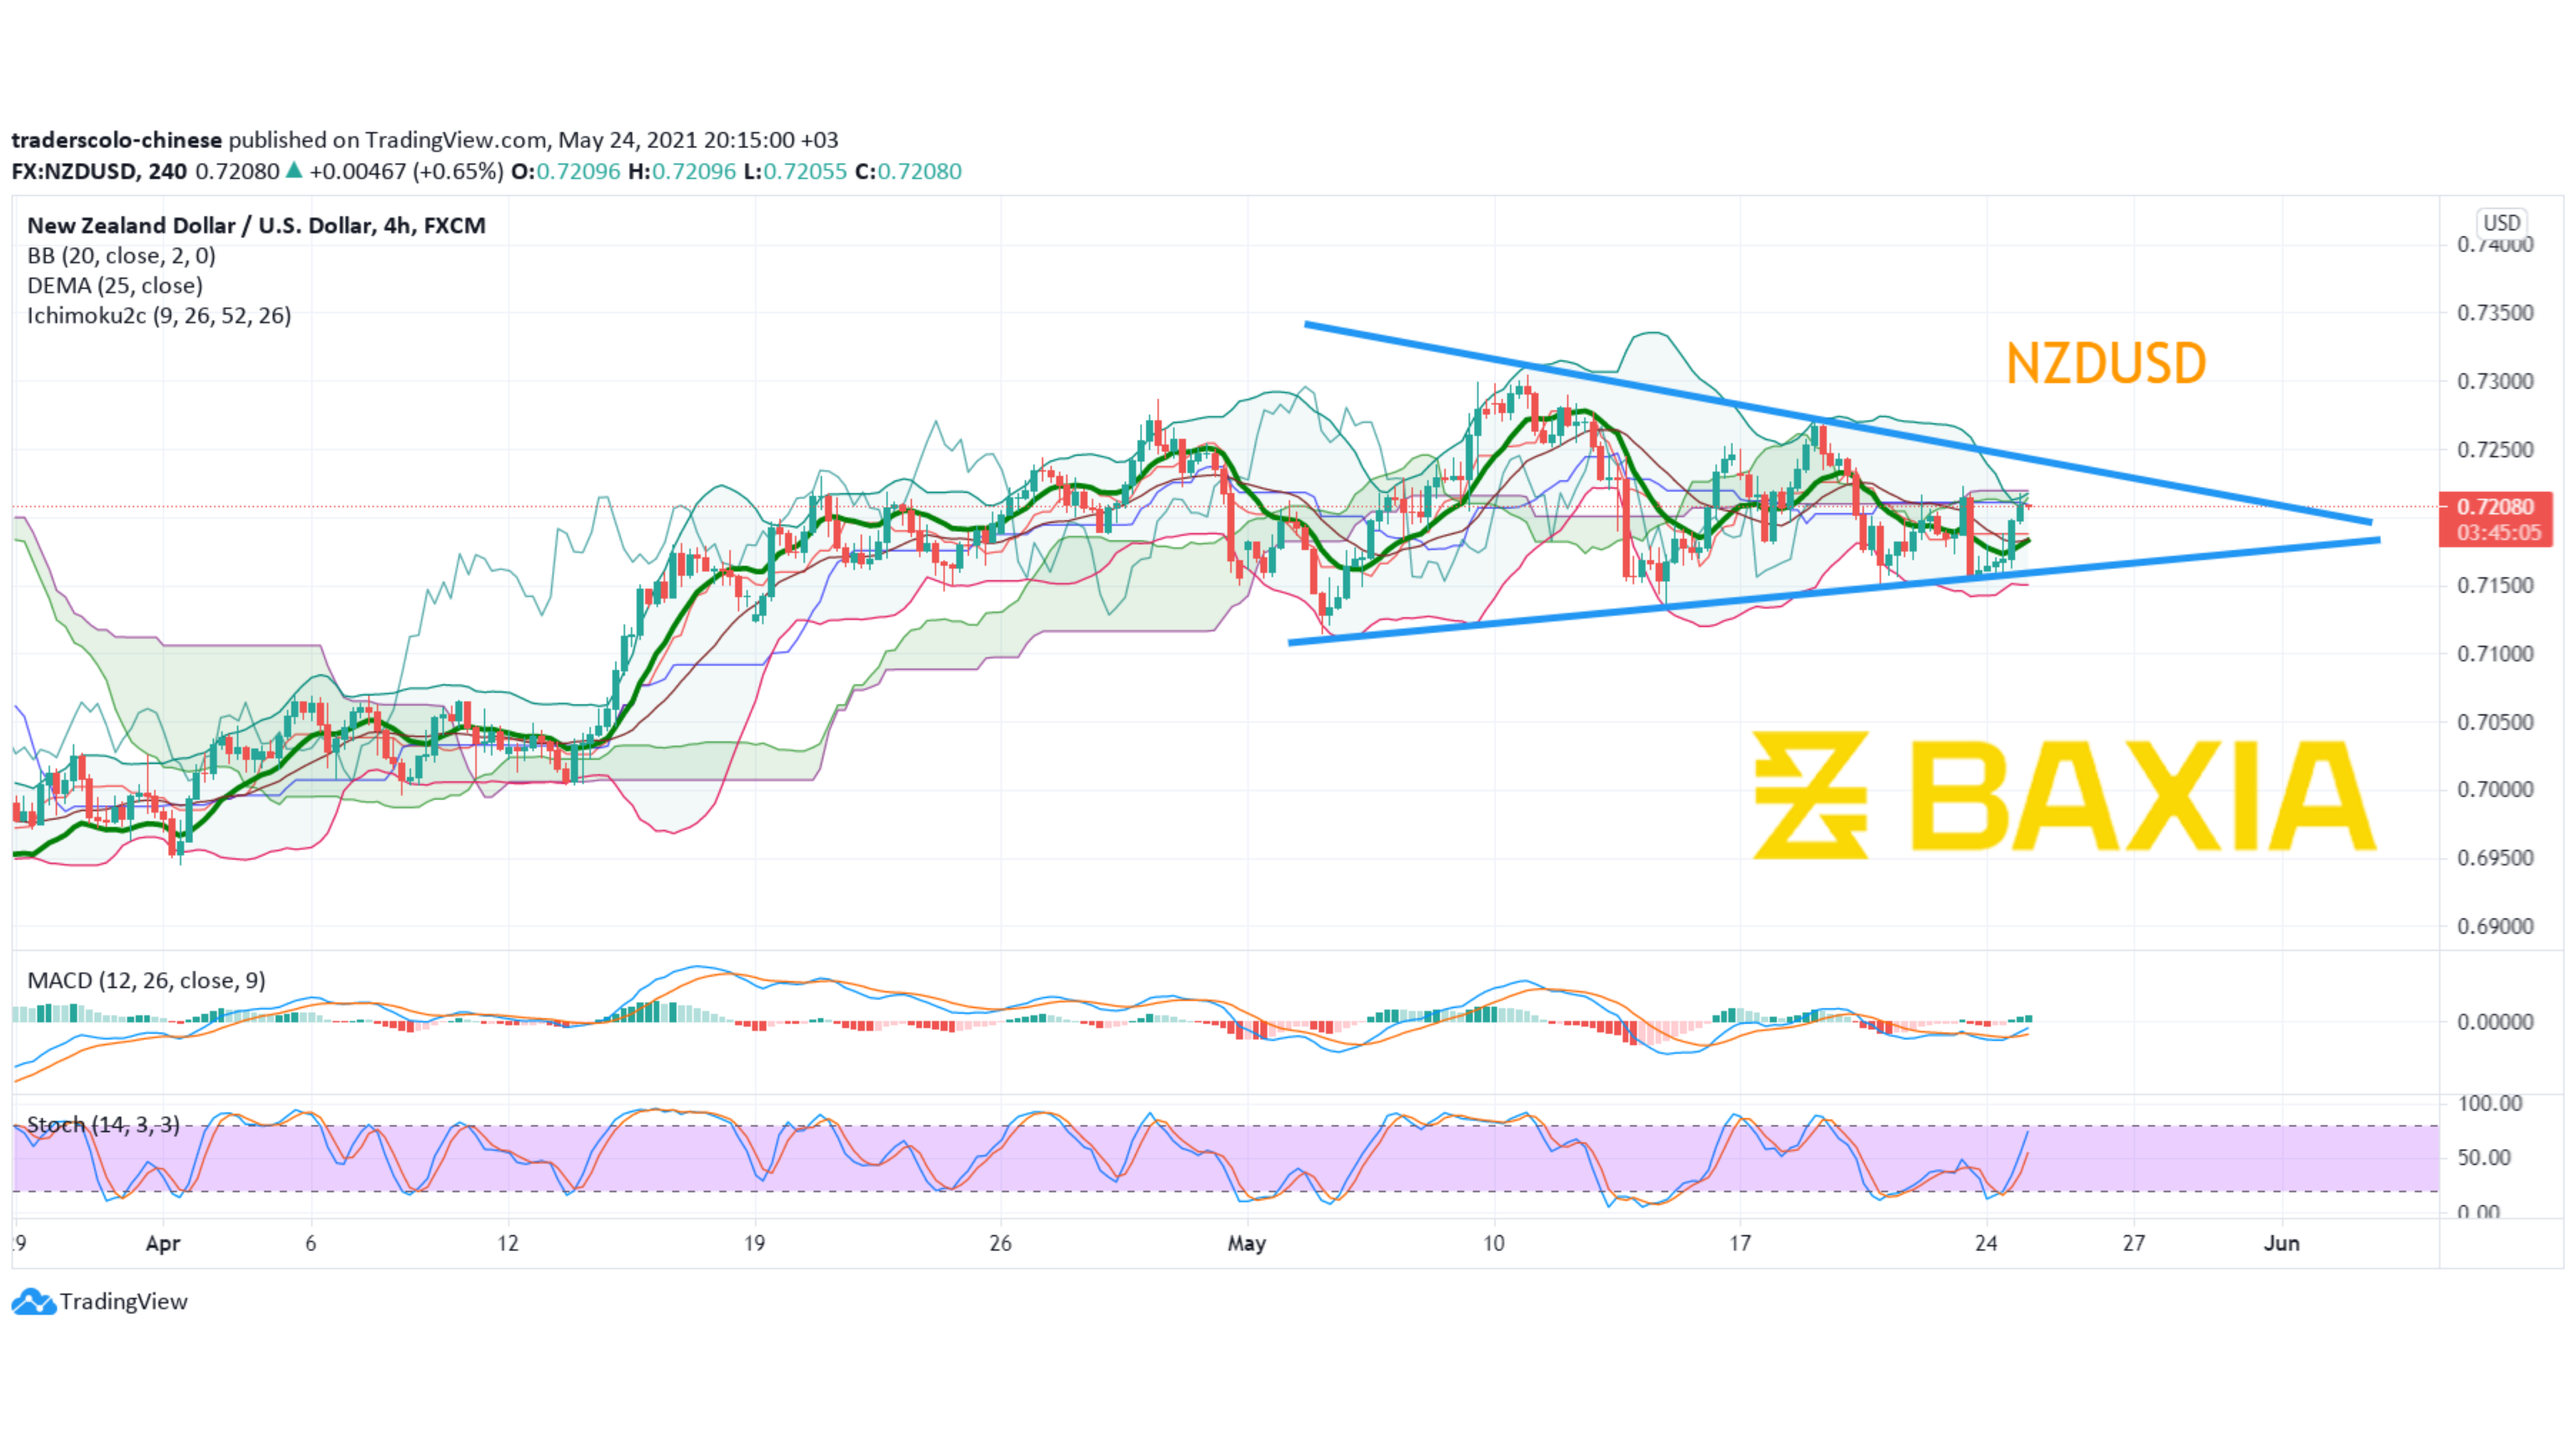

The price has been making this double bottom pattern since June 16th, which has lasted twenty days. During these twenty days, the price has made two bottoms, which is the characteristic of the double bottom pattern, and with them are three peaks. Now, the price touches the pattern's upper trend line, which should be a signal of a break up; however, the price turned down soon.
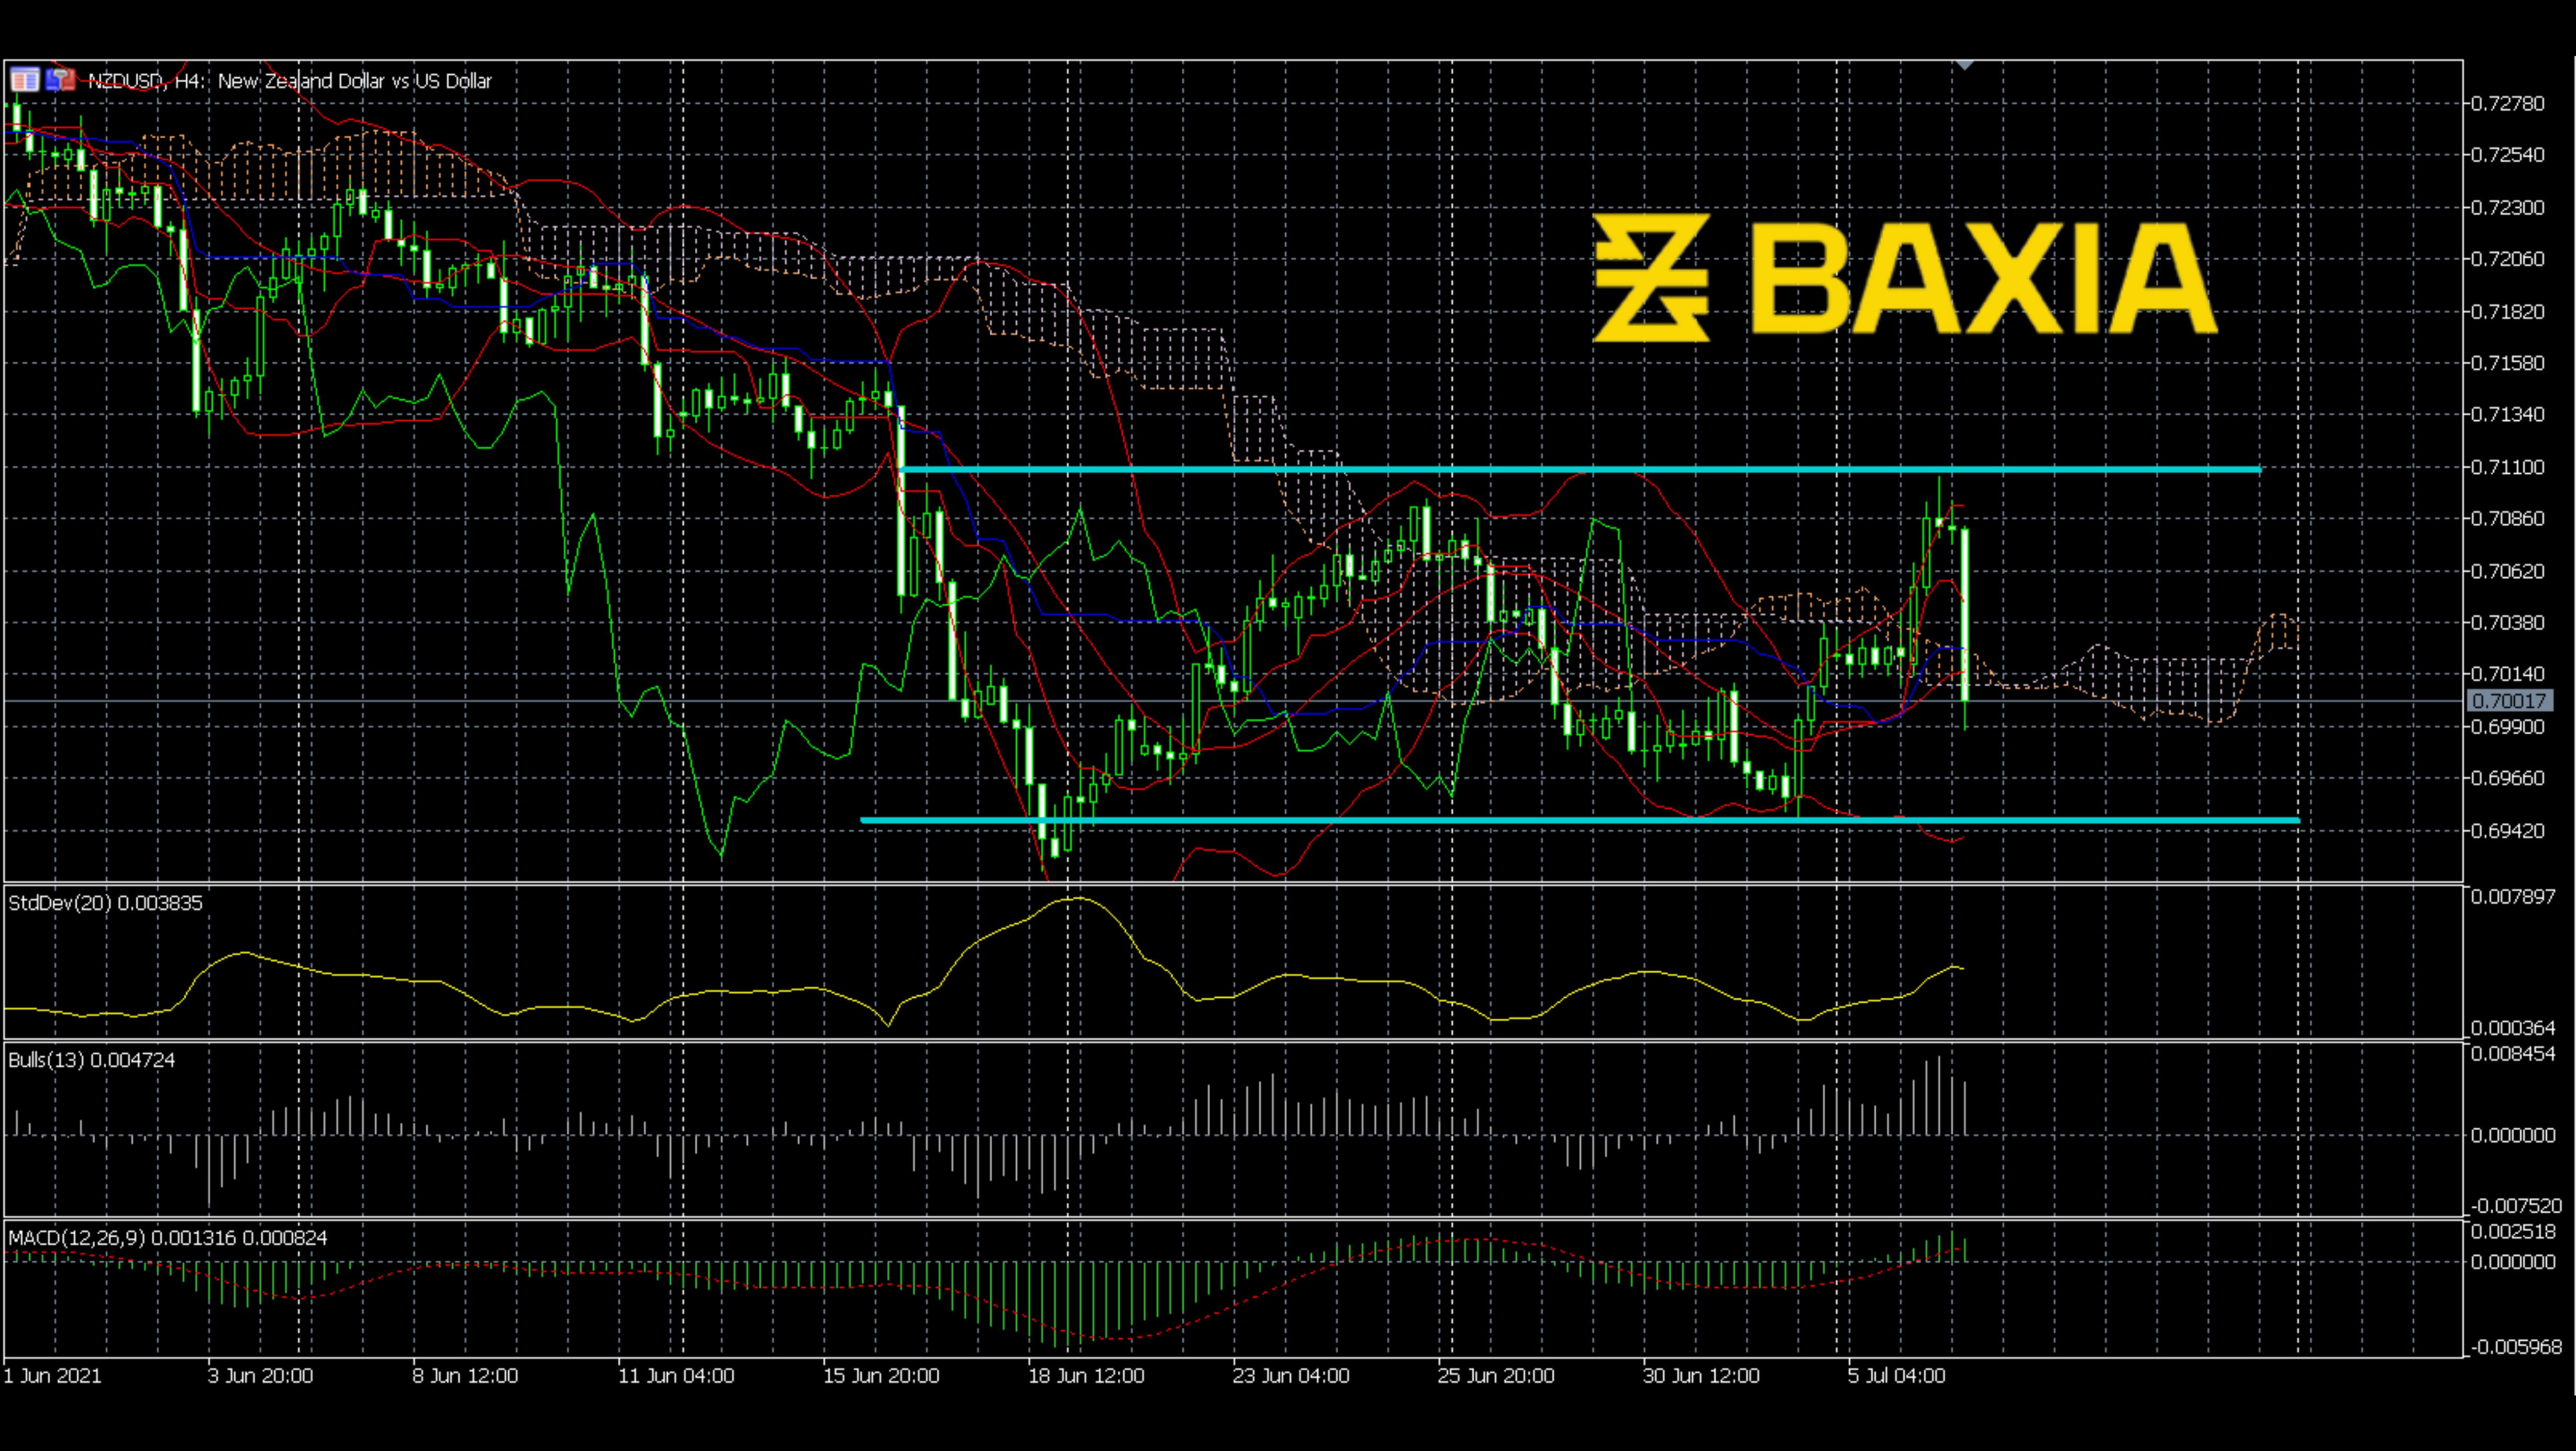
Should we still trust this pattern? I would say we should give it another chance. The latest downward candle is no doubt a retracement. We can also see the price touched the Ichimoku again due to this downward candle; this is a bearish candle; however, the bull power is still positive and powerful. And the MACD shows a bullish signal; a bullish cross was just made. Standard deviation is going up; the price is becoming more and more unstable.
The double bottom pattern is still in progress for NZDUSD. This retracement could pass. The final breakout could be coming soon.
We love to hear new ideas from traders and want to know what you think!
If you like this topic and want to suggest future topics that you find helpful, let us know by clicking the ‘submit your feedback’ button below.

Trading foreign exchange on margin carries a high level of risk, and may not be suitable for all investors. Before deciding to trade foreign exchange you should carefully consider your investment objectives, level of experience, and risk appetite.
Nothing contained in this website should be construed as investment advice. Any reference to an investment's past or potential performance is not, and should not be construed as, a recommendation or as a guarantee of any specific outcome or profit.