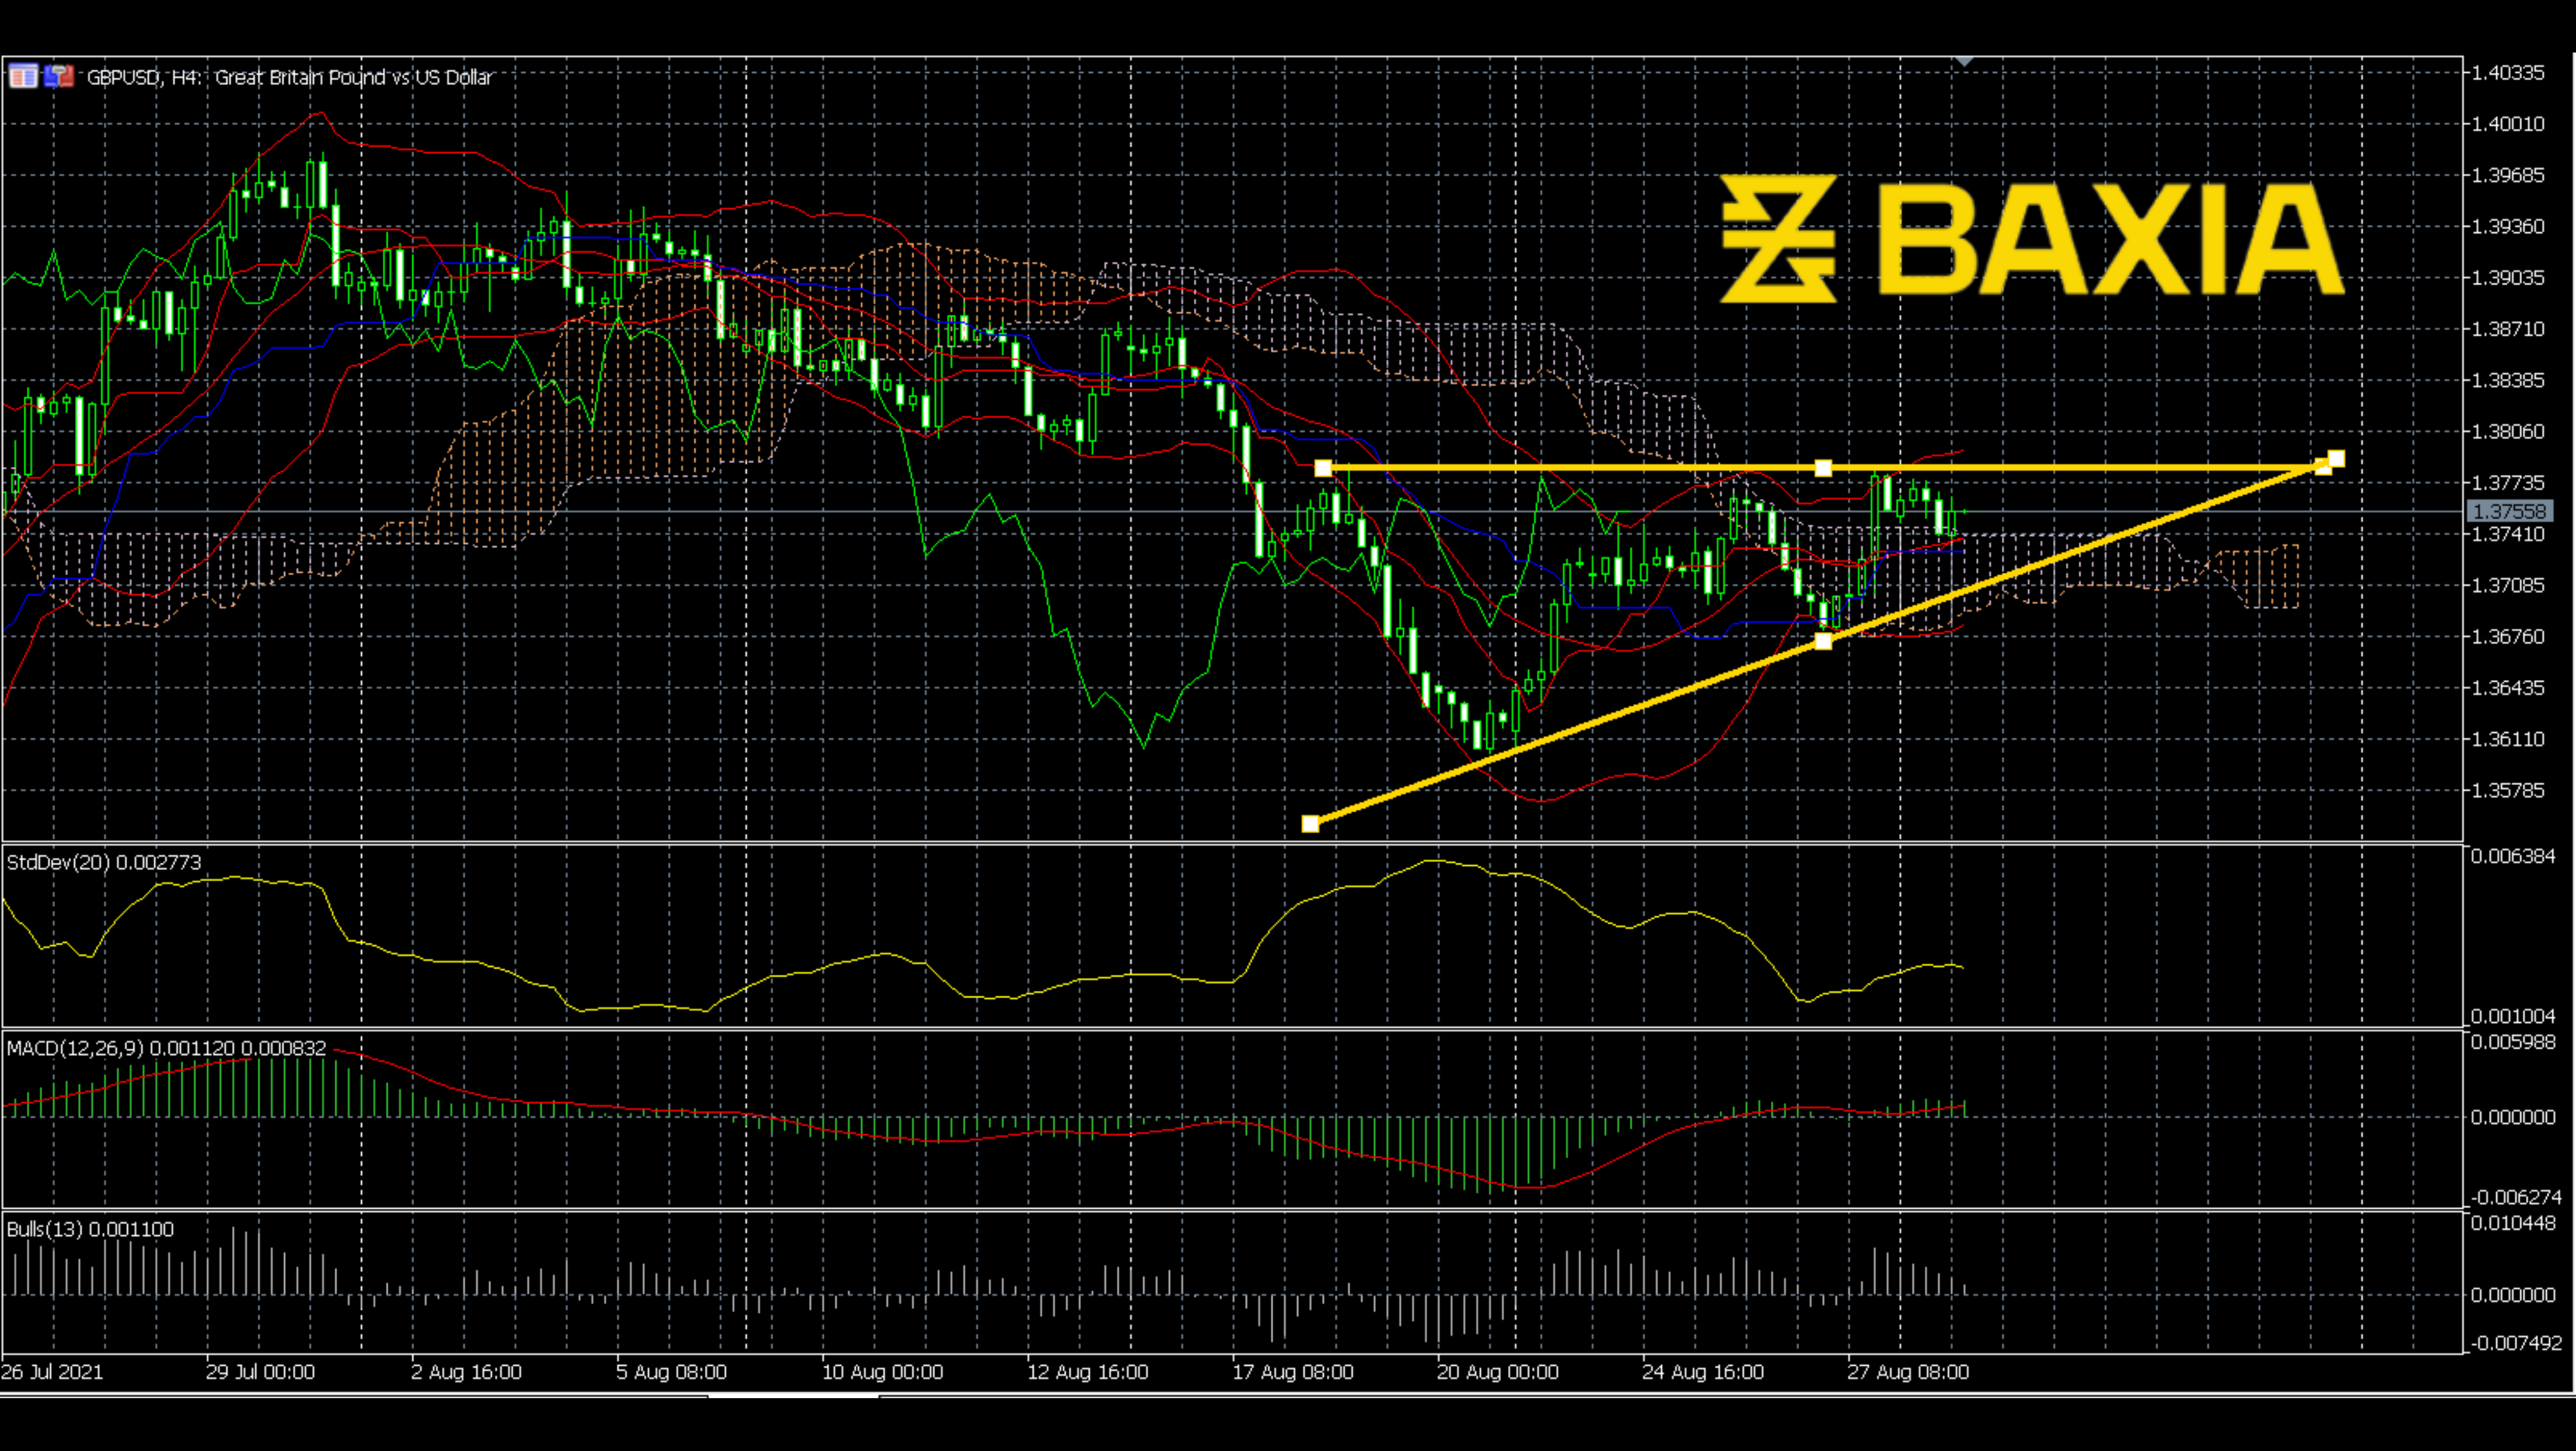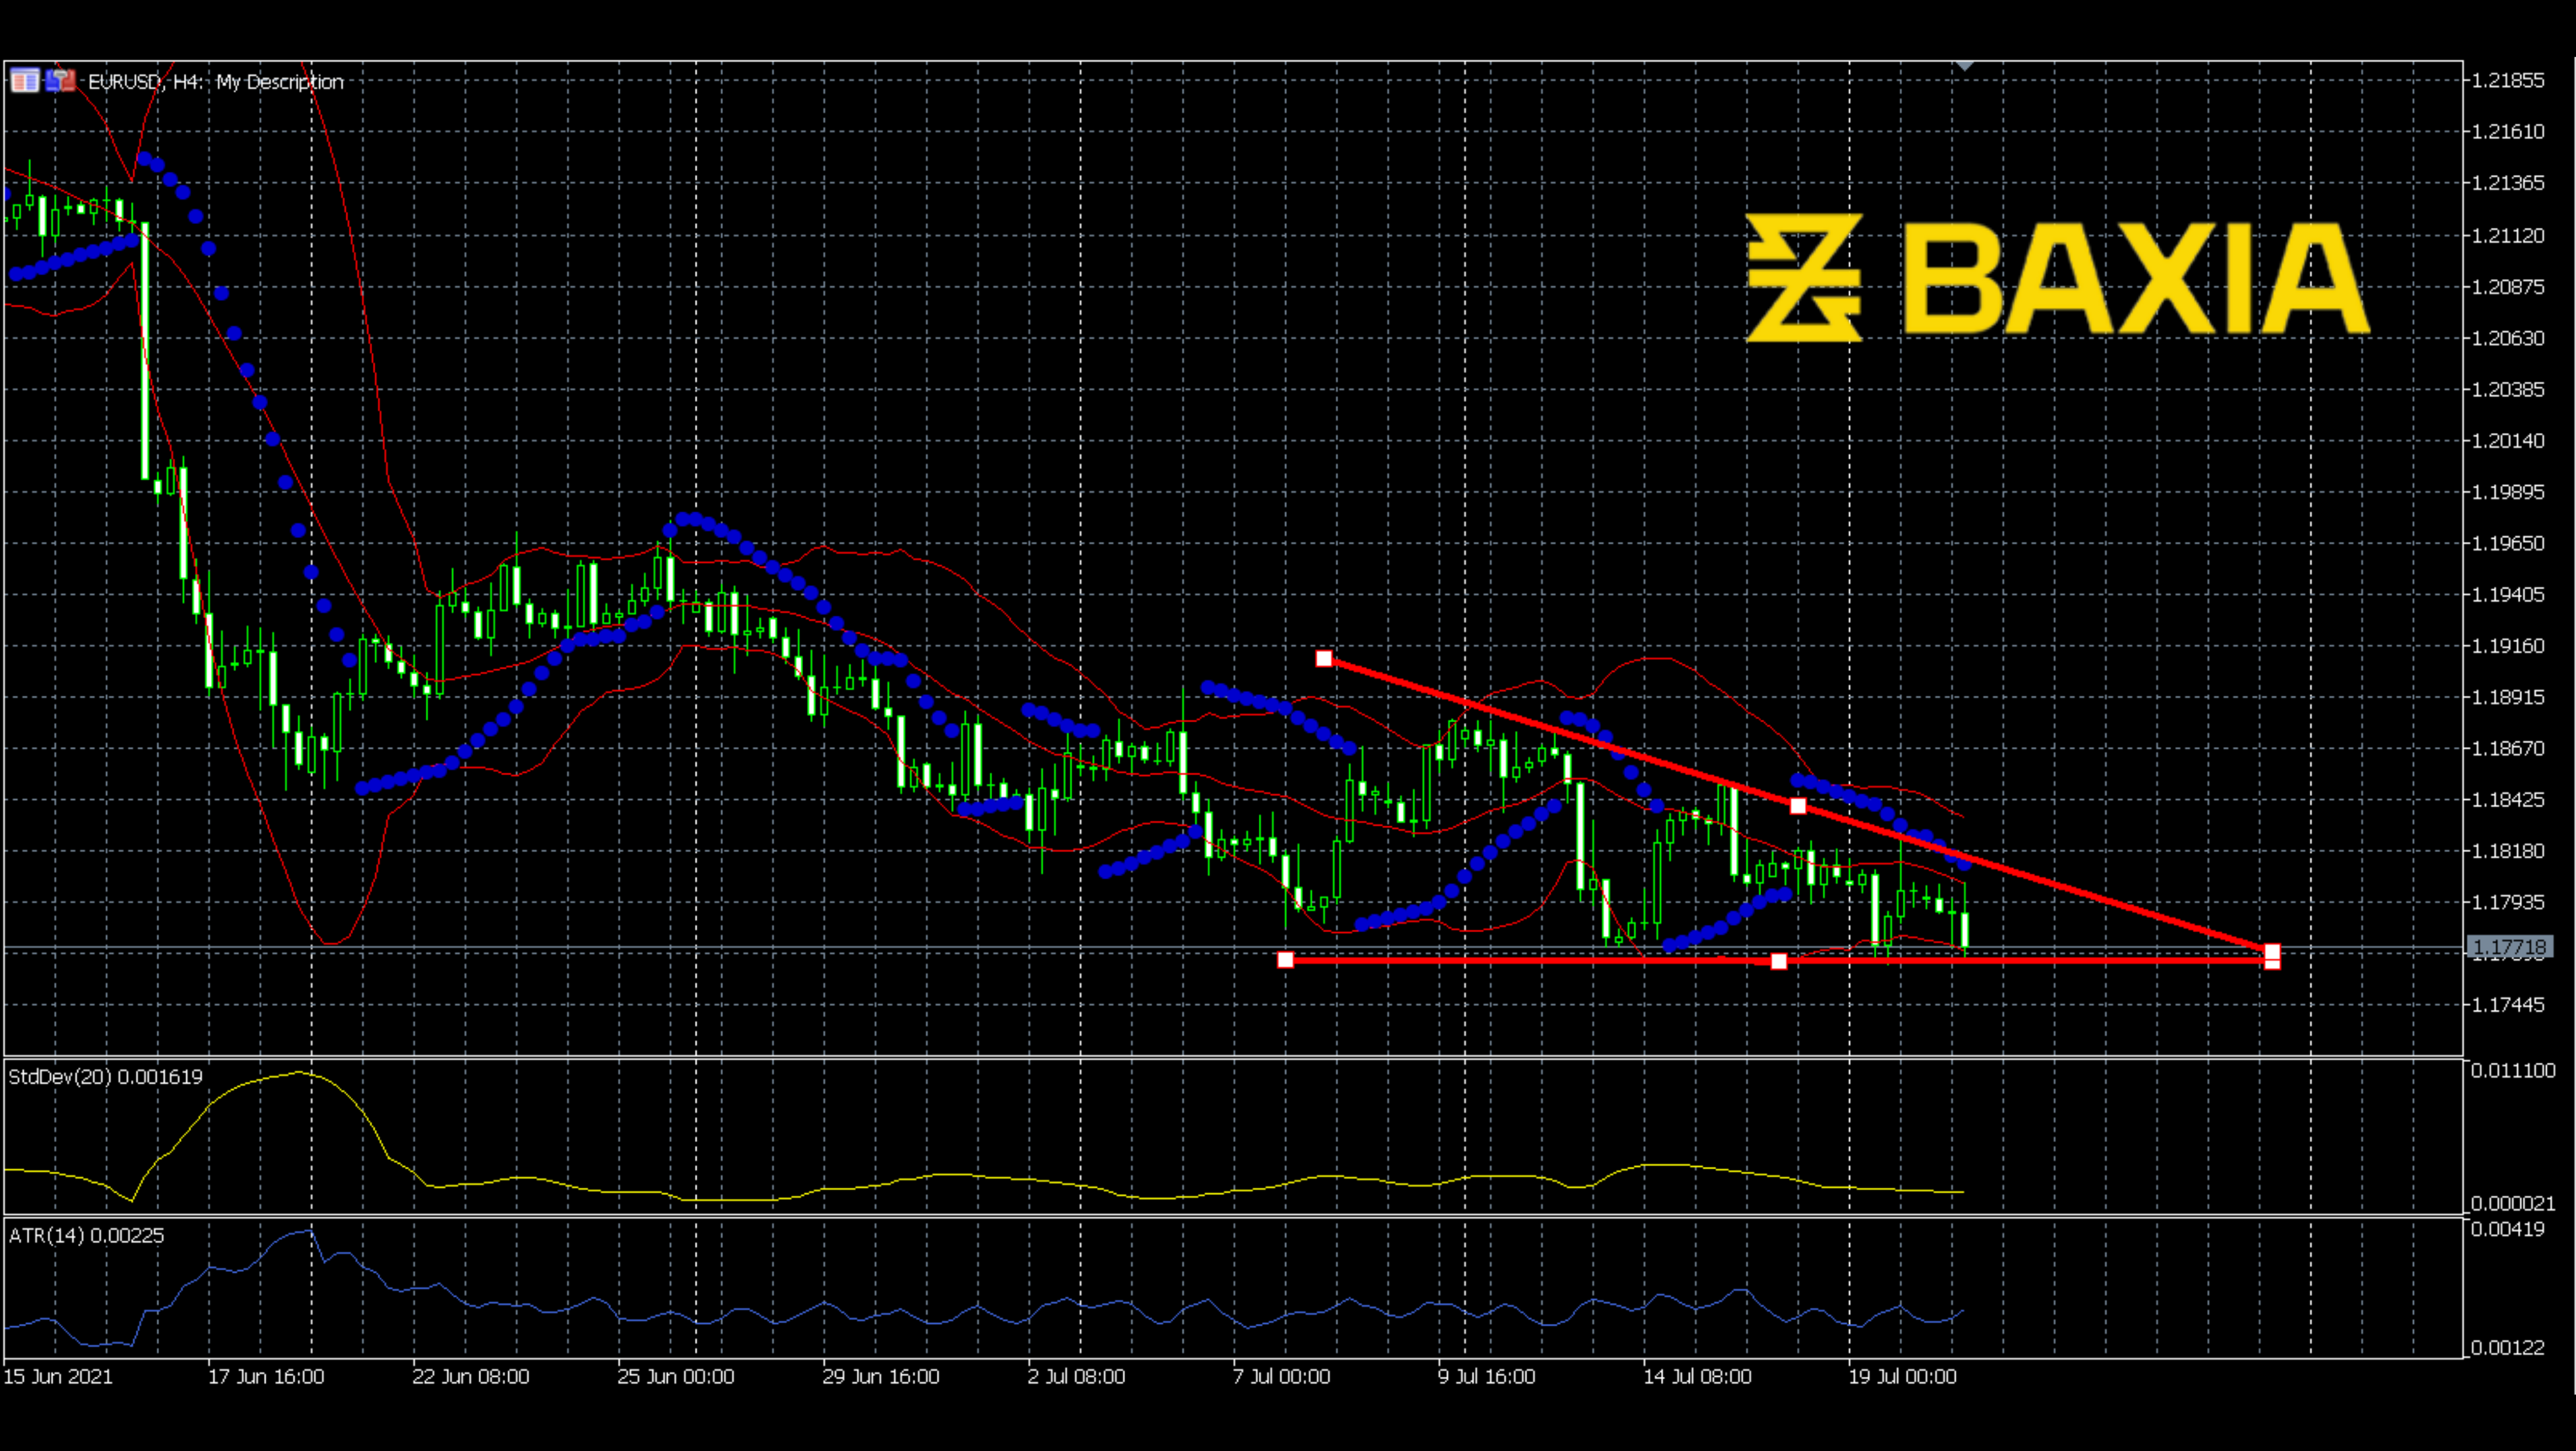

The price had been hovering around 1.414 for about 45 days; this flat channel was stable with an unchanged Bollinger Band and a comparatively unchanged mean. Recently, the price broke down on June 16th. The breakout was sharp and decisive. How far will this downward trend go?
As can be seen, this breakout stopped at 1.378 and bounced back, making a new wave. Now, the price touches 1.378 again. After the two waves, it is obvious that the price is building a descending triangle; this triangle is almost finished, and the price line is getting to the end of the triangle. Will the price break out?
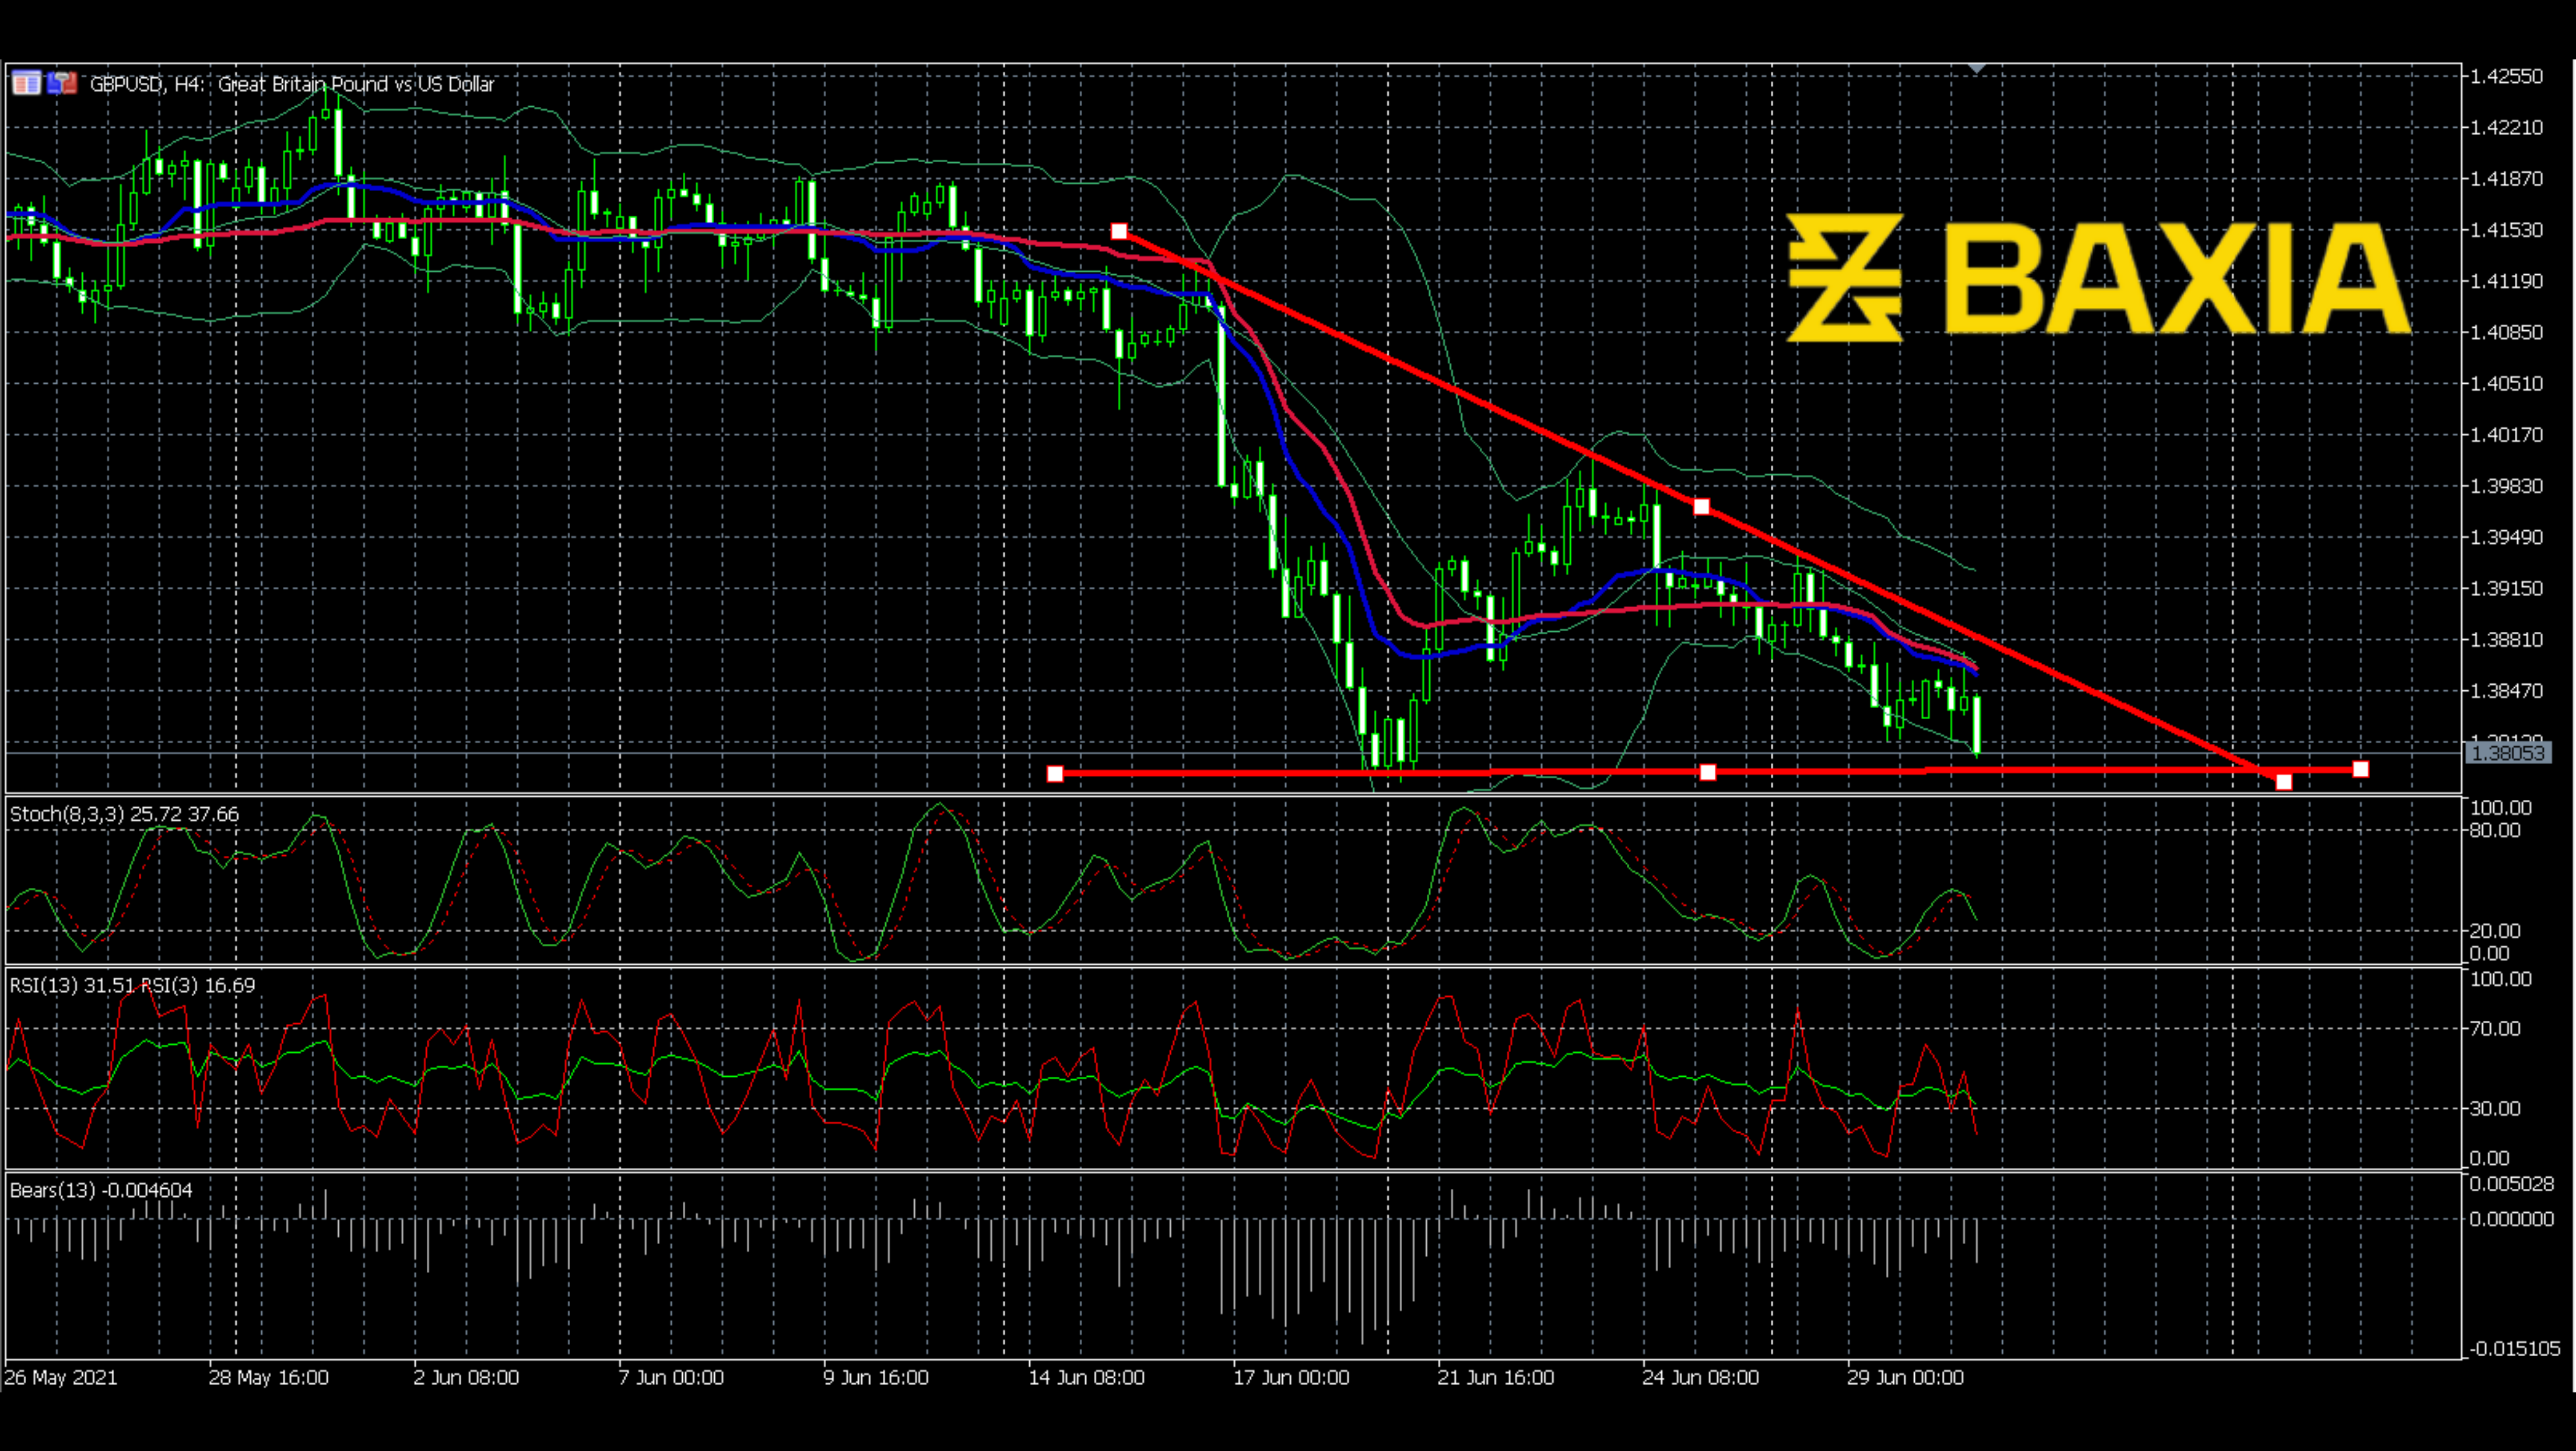
Stochastics and RSI both go down in a normal range. Although the RSI seems to touch the oversold area, it is still in a downward trend. We can trust this bearish signal. Even the RSI enters into the oversold area; the situation could last for a while, which means the oversold situation could be longer than we think. Bear power shows a consistent bearish signal. Although the signal is not strong, it is constant. We could expect more bearish signals to show up soon.
We love to hear new ideas from traders and want to know what you think!
If you like this topic and want to suggest future topics that you find helpful, let us know by clicking the ‘submit your feedback’ button below.

Trading foreign exchange on margin carries a high level of risk, and may not be suitable for all investors. Before deciding to trade foreign exchange you should carefully consider your investment objectives, level of experience, and risk appetite.
Nothing contained in this website should be construed as investment advice. Any reference to an investment's past or potential performance is not, and should not be construed as, a recommendation or as a guarantee of any specific outcome or profit.