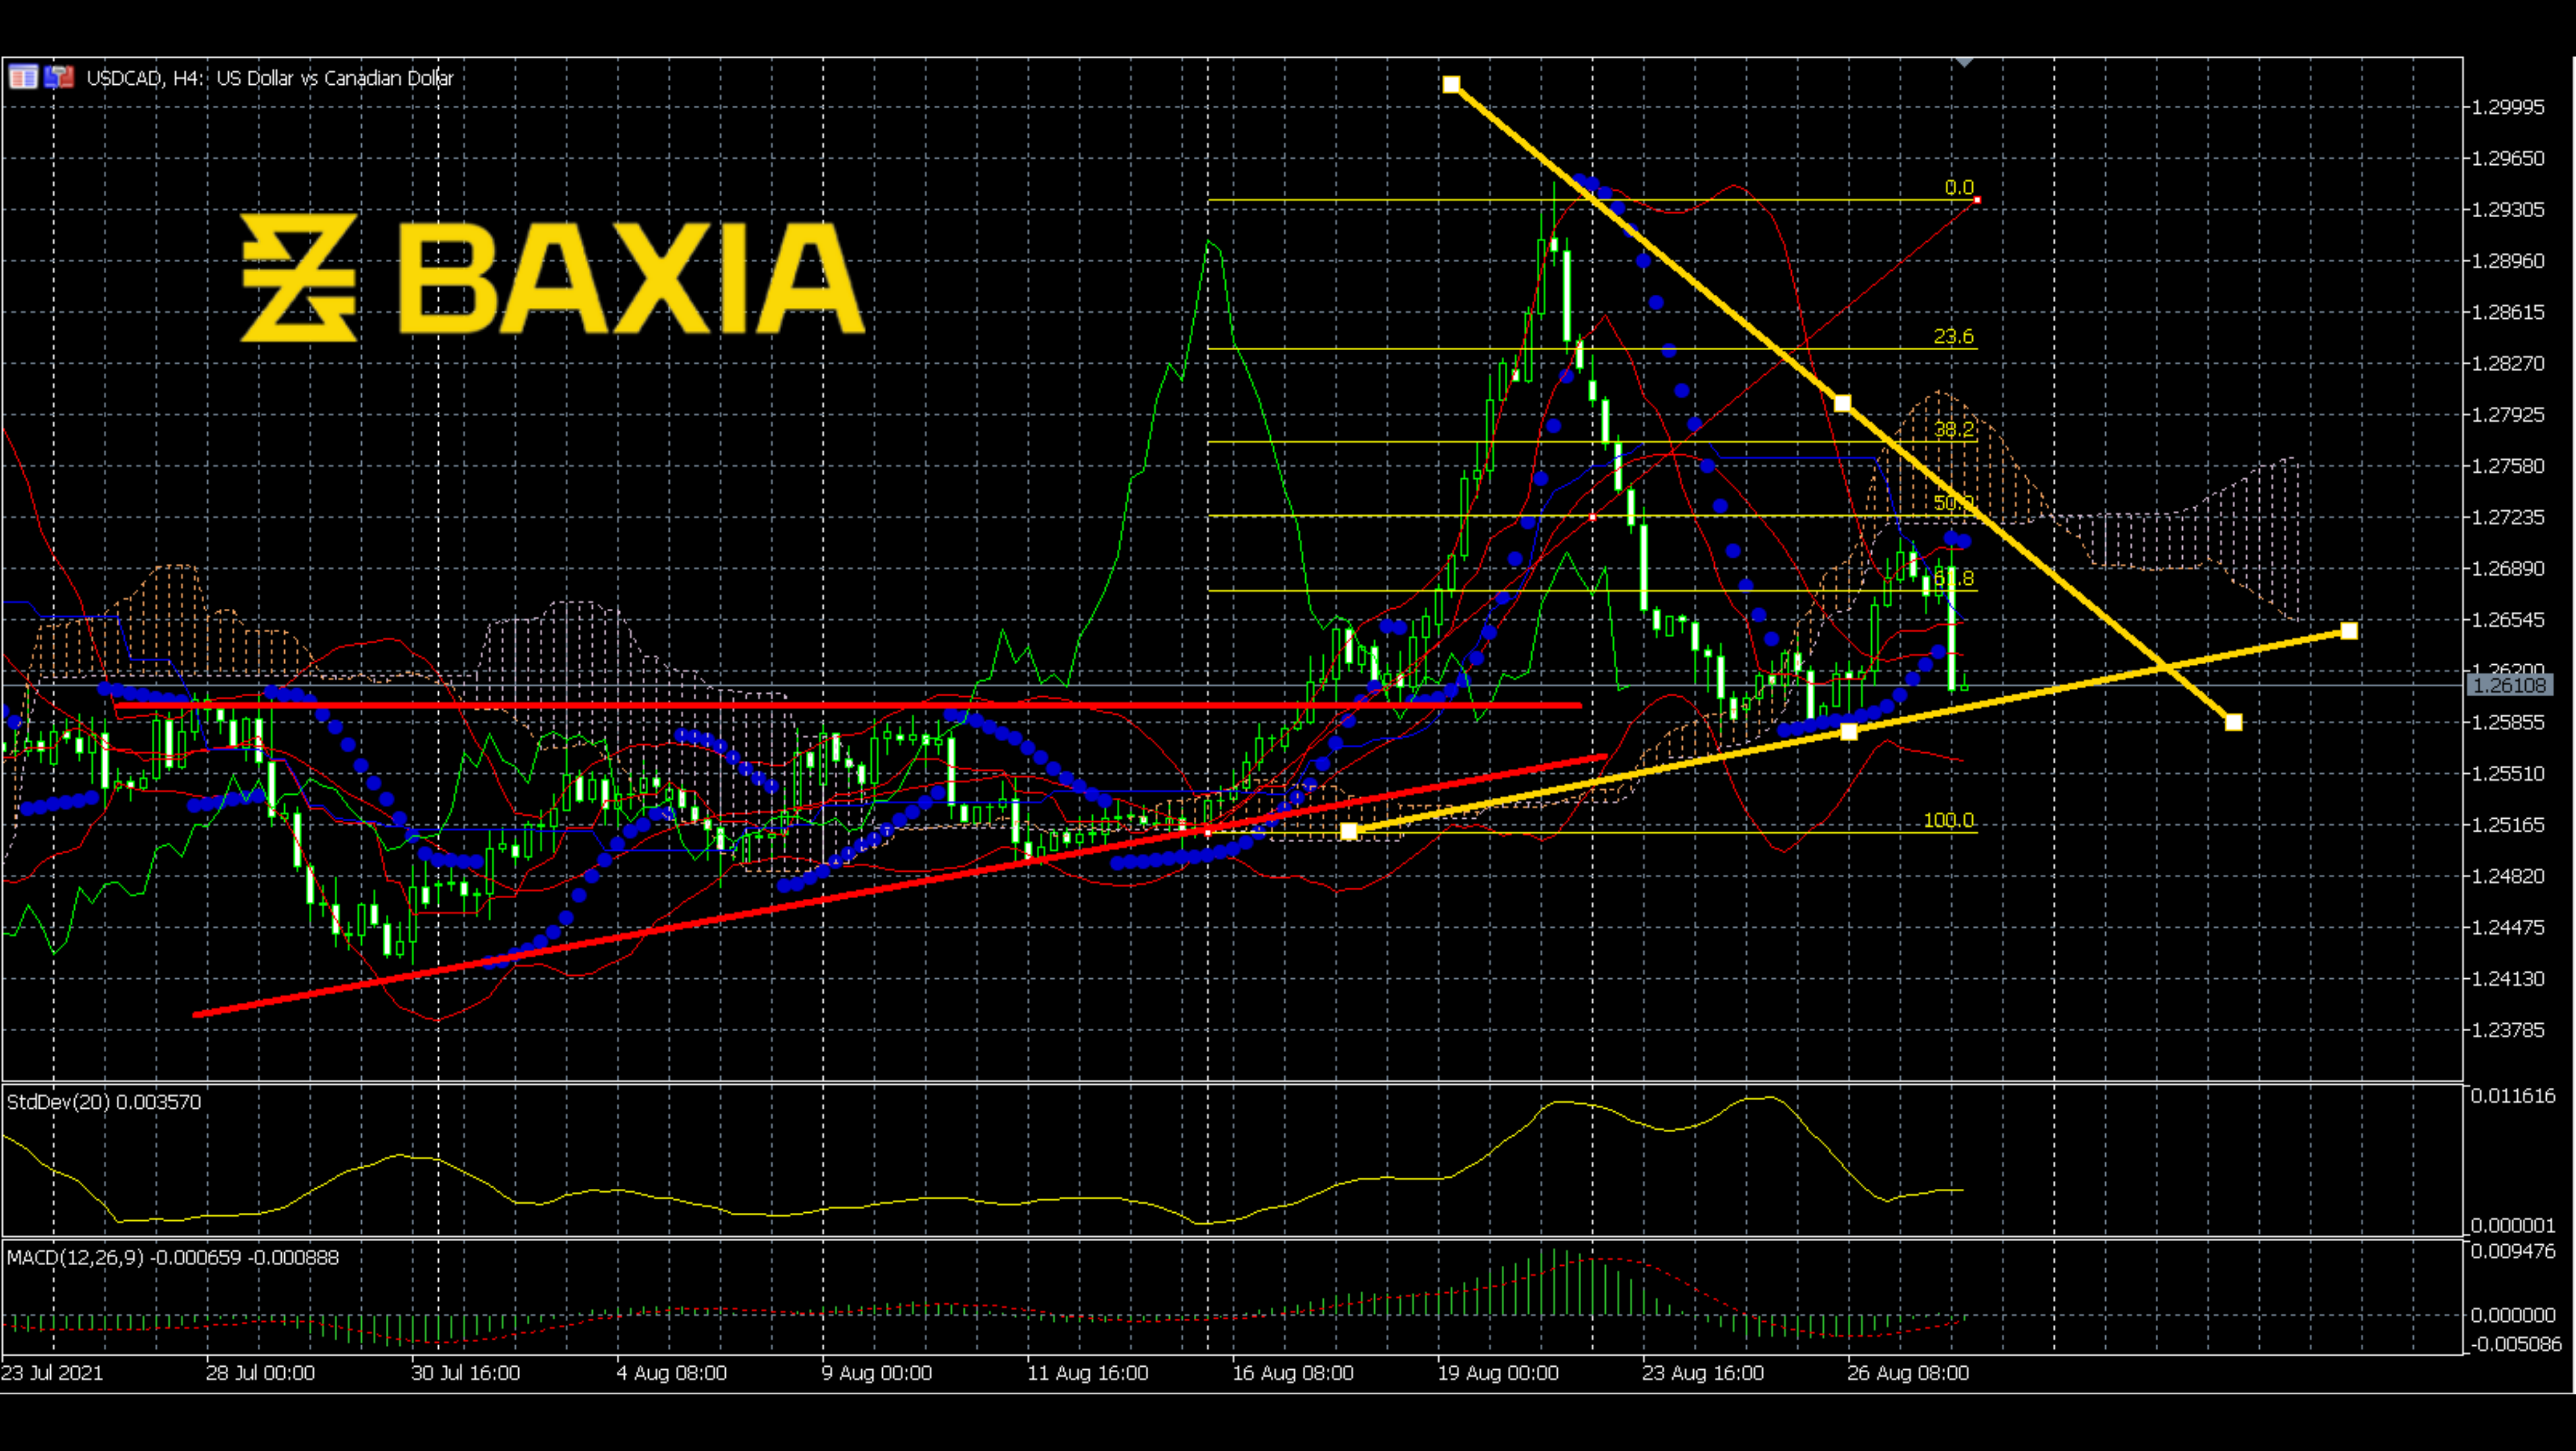

The downward trend on the price line of EURUSD has made some big waves, and it has lasted for more than 20 days. Although these fluctuations were steep, the price was not down too much, 1.42%, 1750 points. Recently, the price stopped going down; a support area stopped it. The Fibonacci retracement chart shows that the price already touched the 23.6% Fibonacci level after it met the support area. Will the price continue to go down?
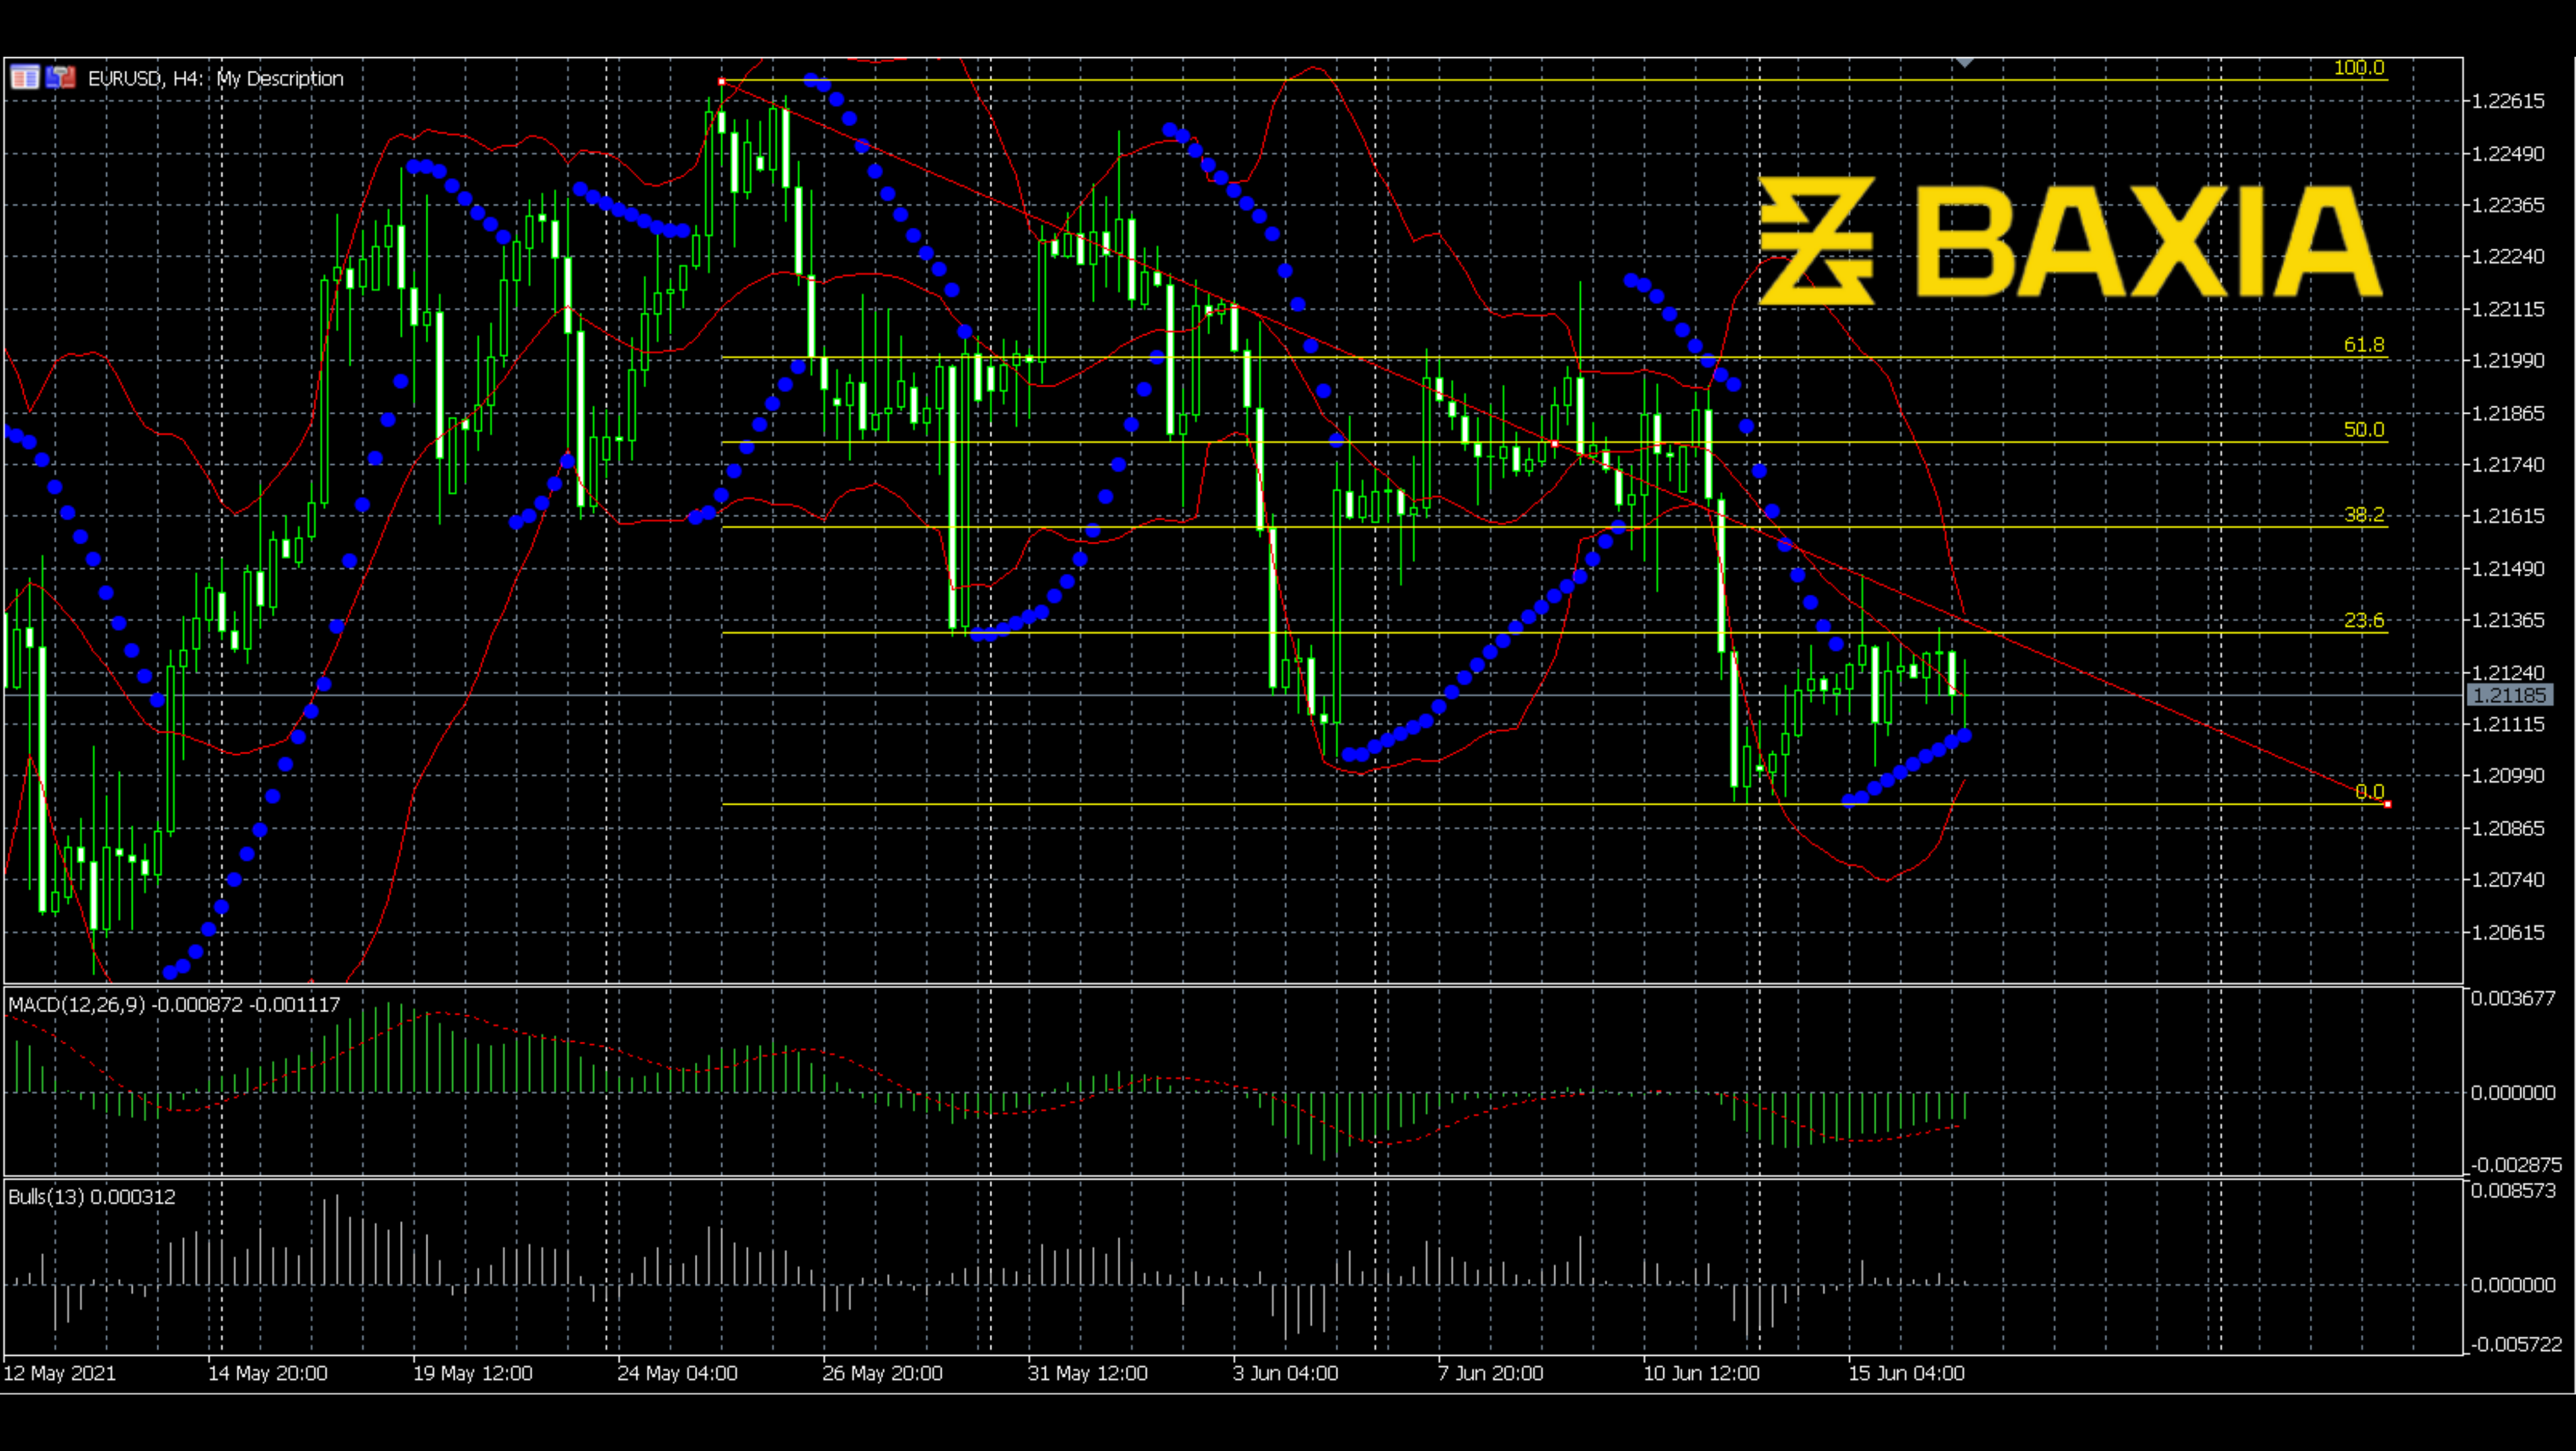
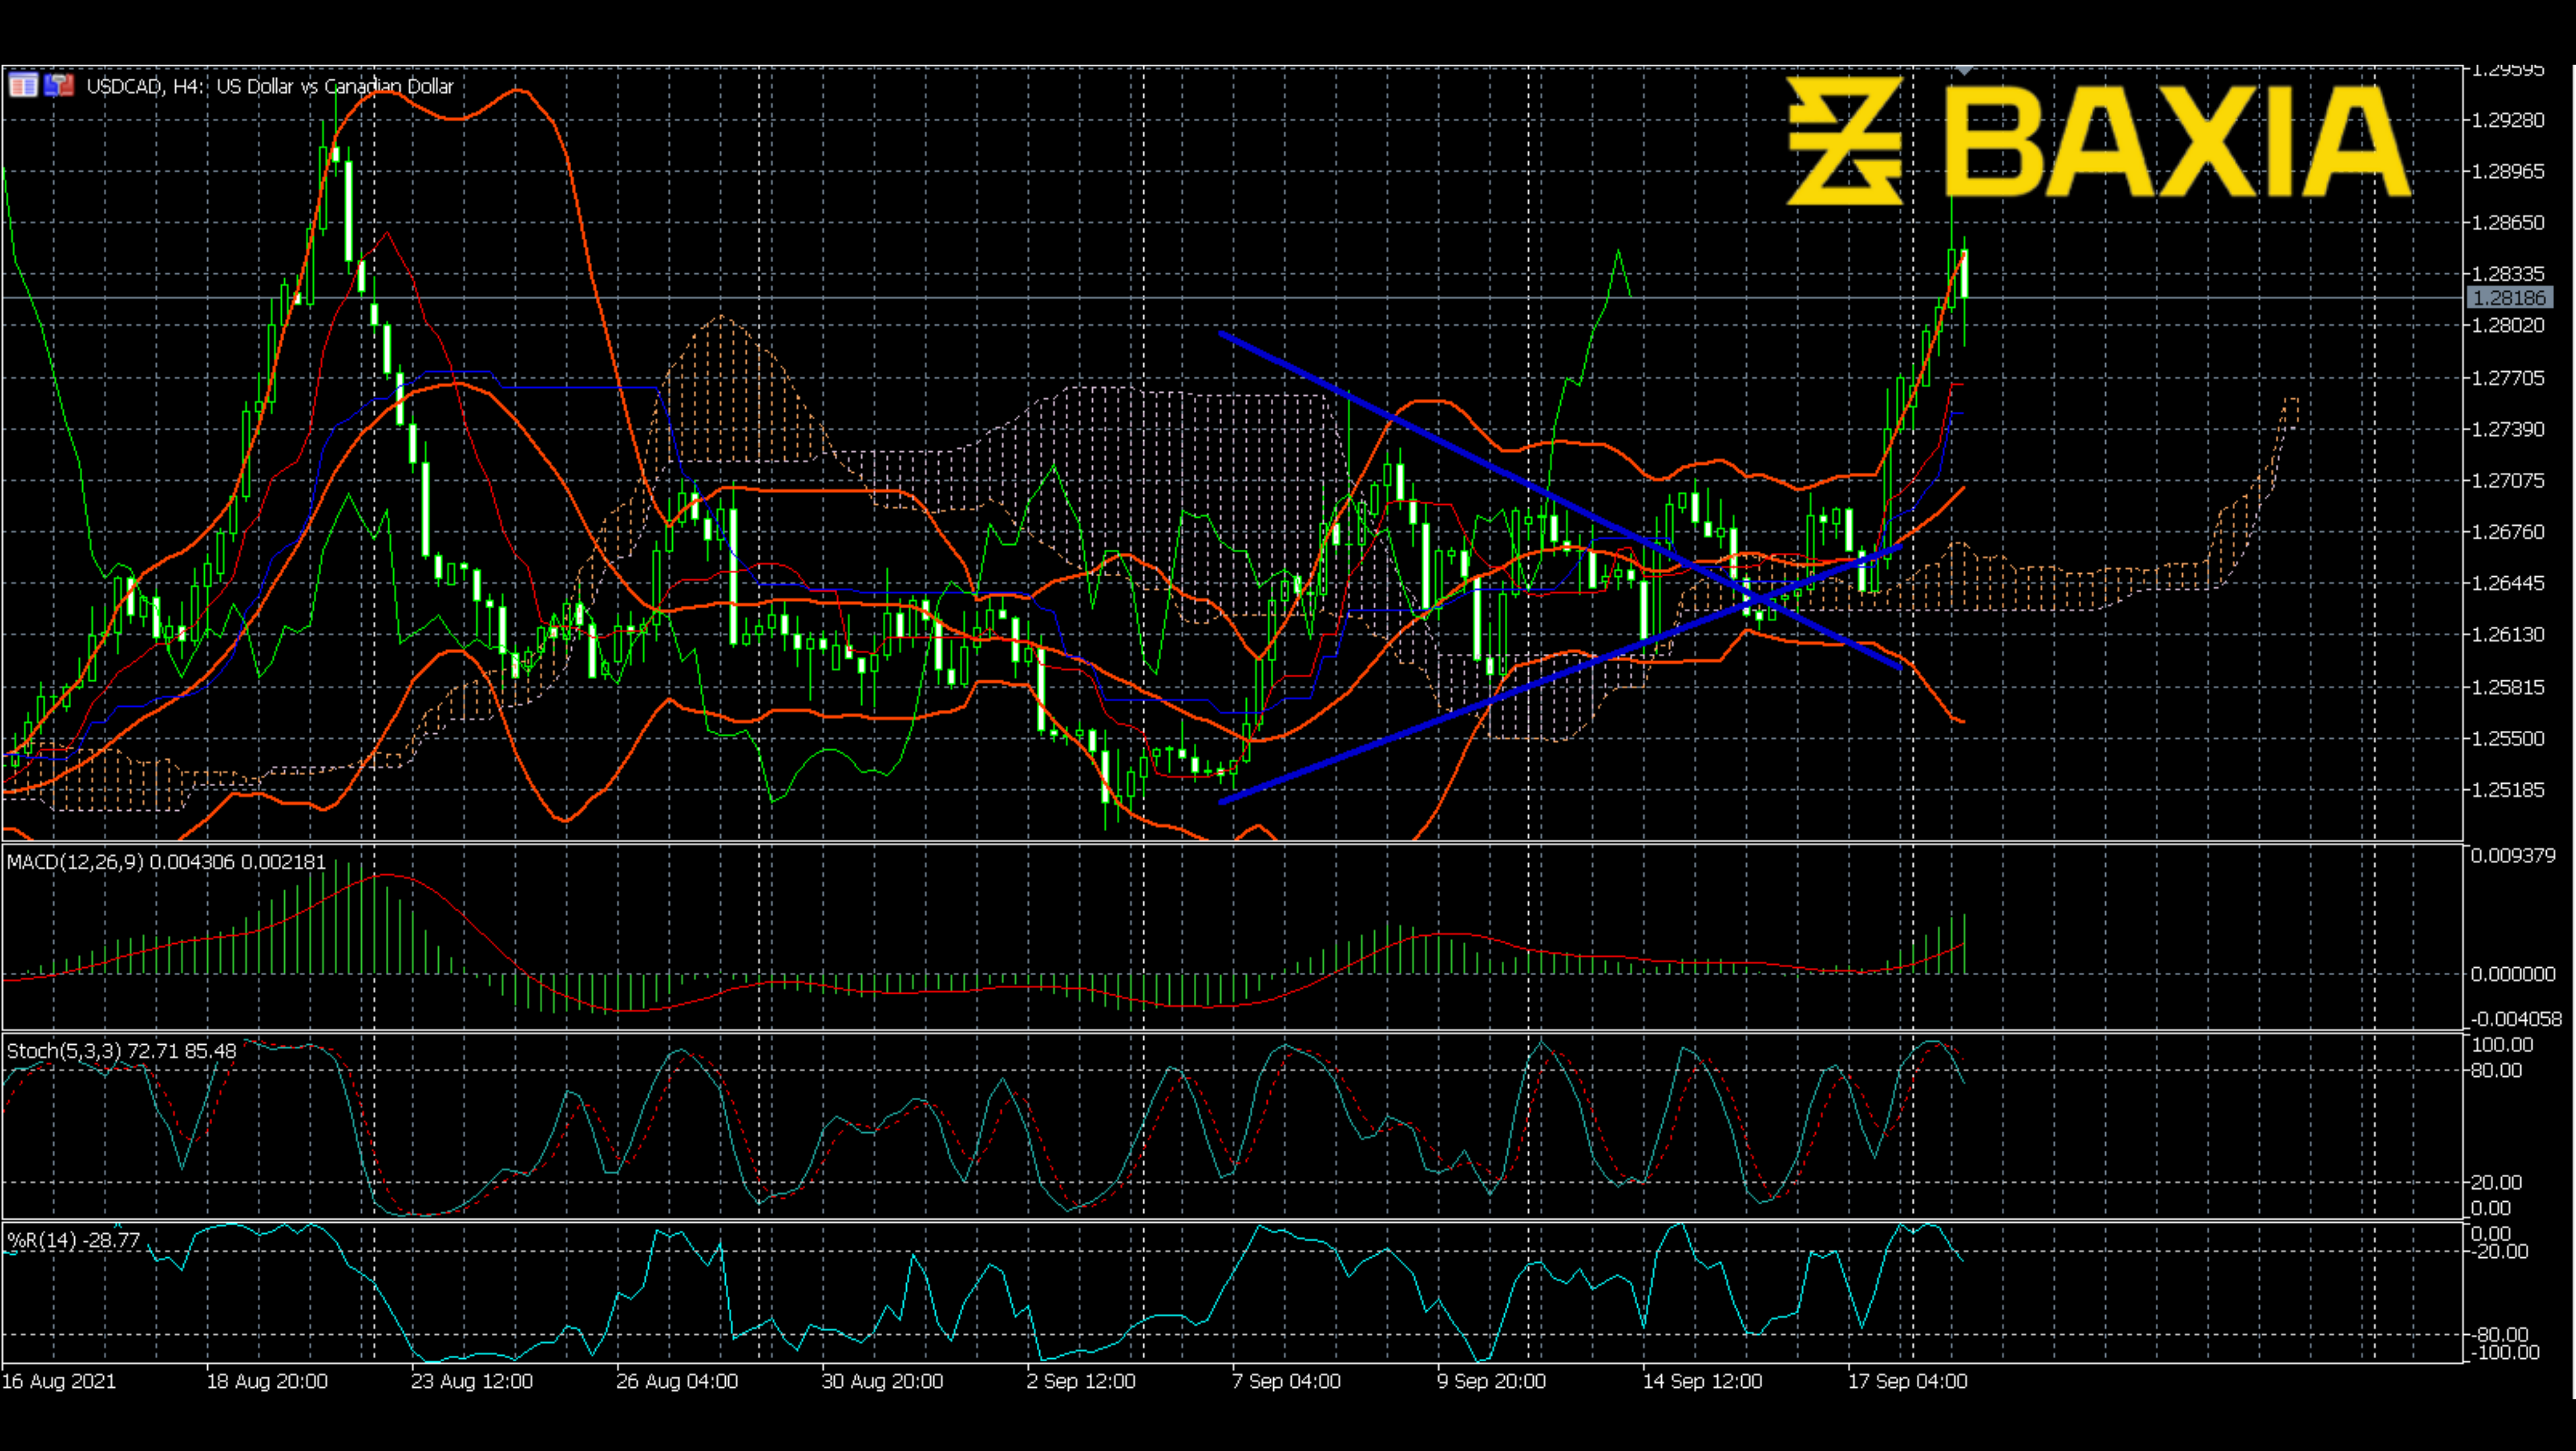
As seen on the chart, the Bollinger Bands have shrunk. Previously, the price went down after the Bollinger Bands shrunk and the wave came to an end. Will it happen again this time?
Although the MACD is going up, it is still lower than the middle level, which means the upward power is still weak. Also, the bullish power does not show any strong signal or changes here. SAR does make a new trend; however, with dots squeezed together, there is not enough momentum to make the angle steeper.
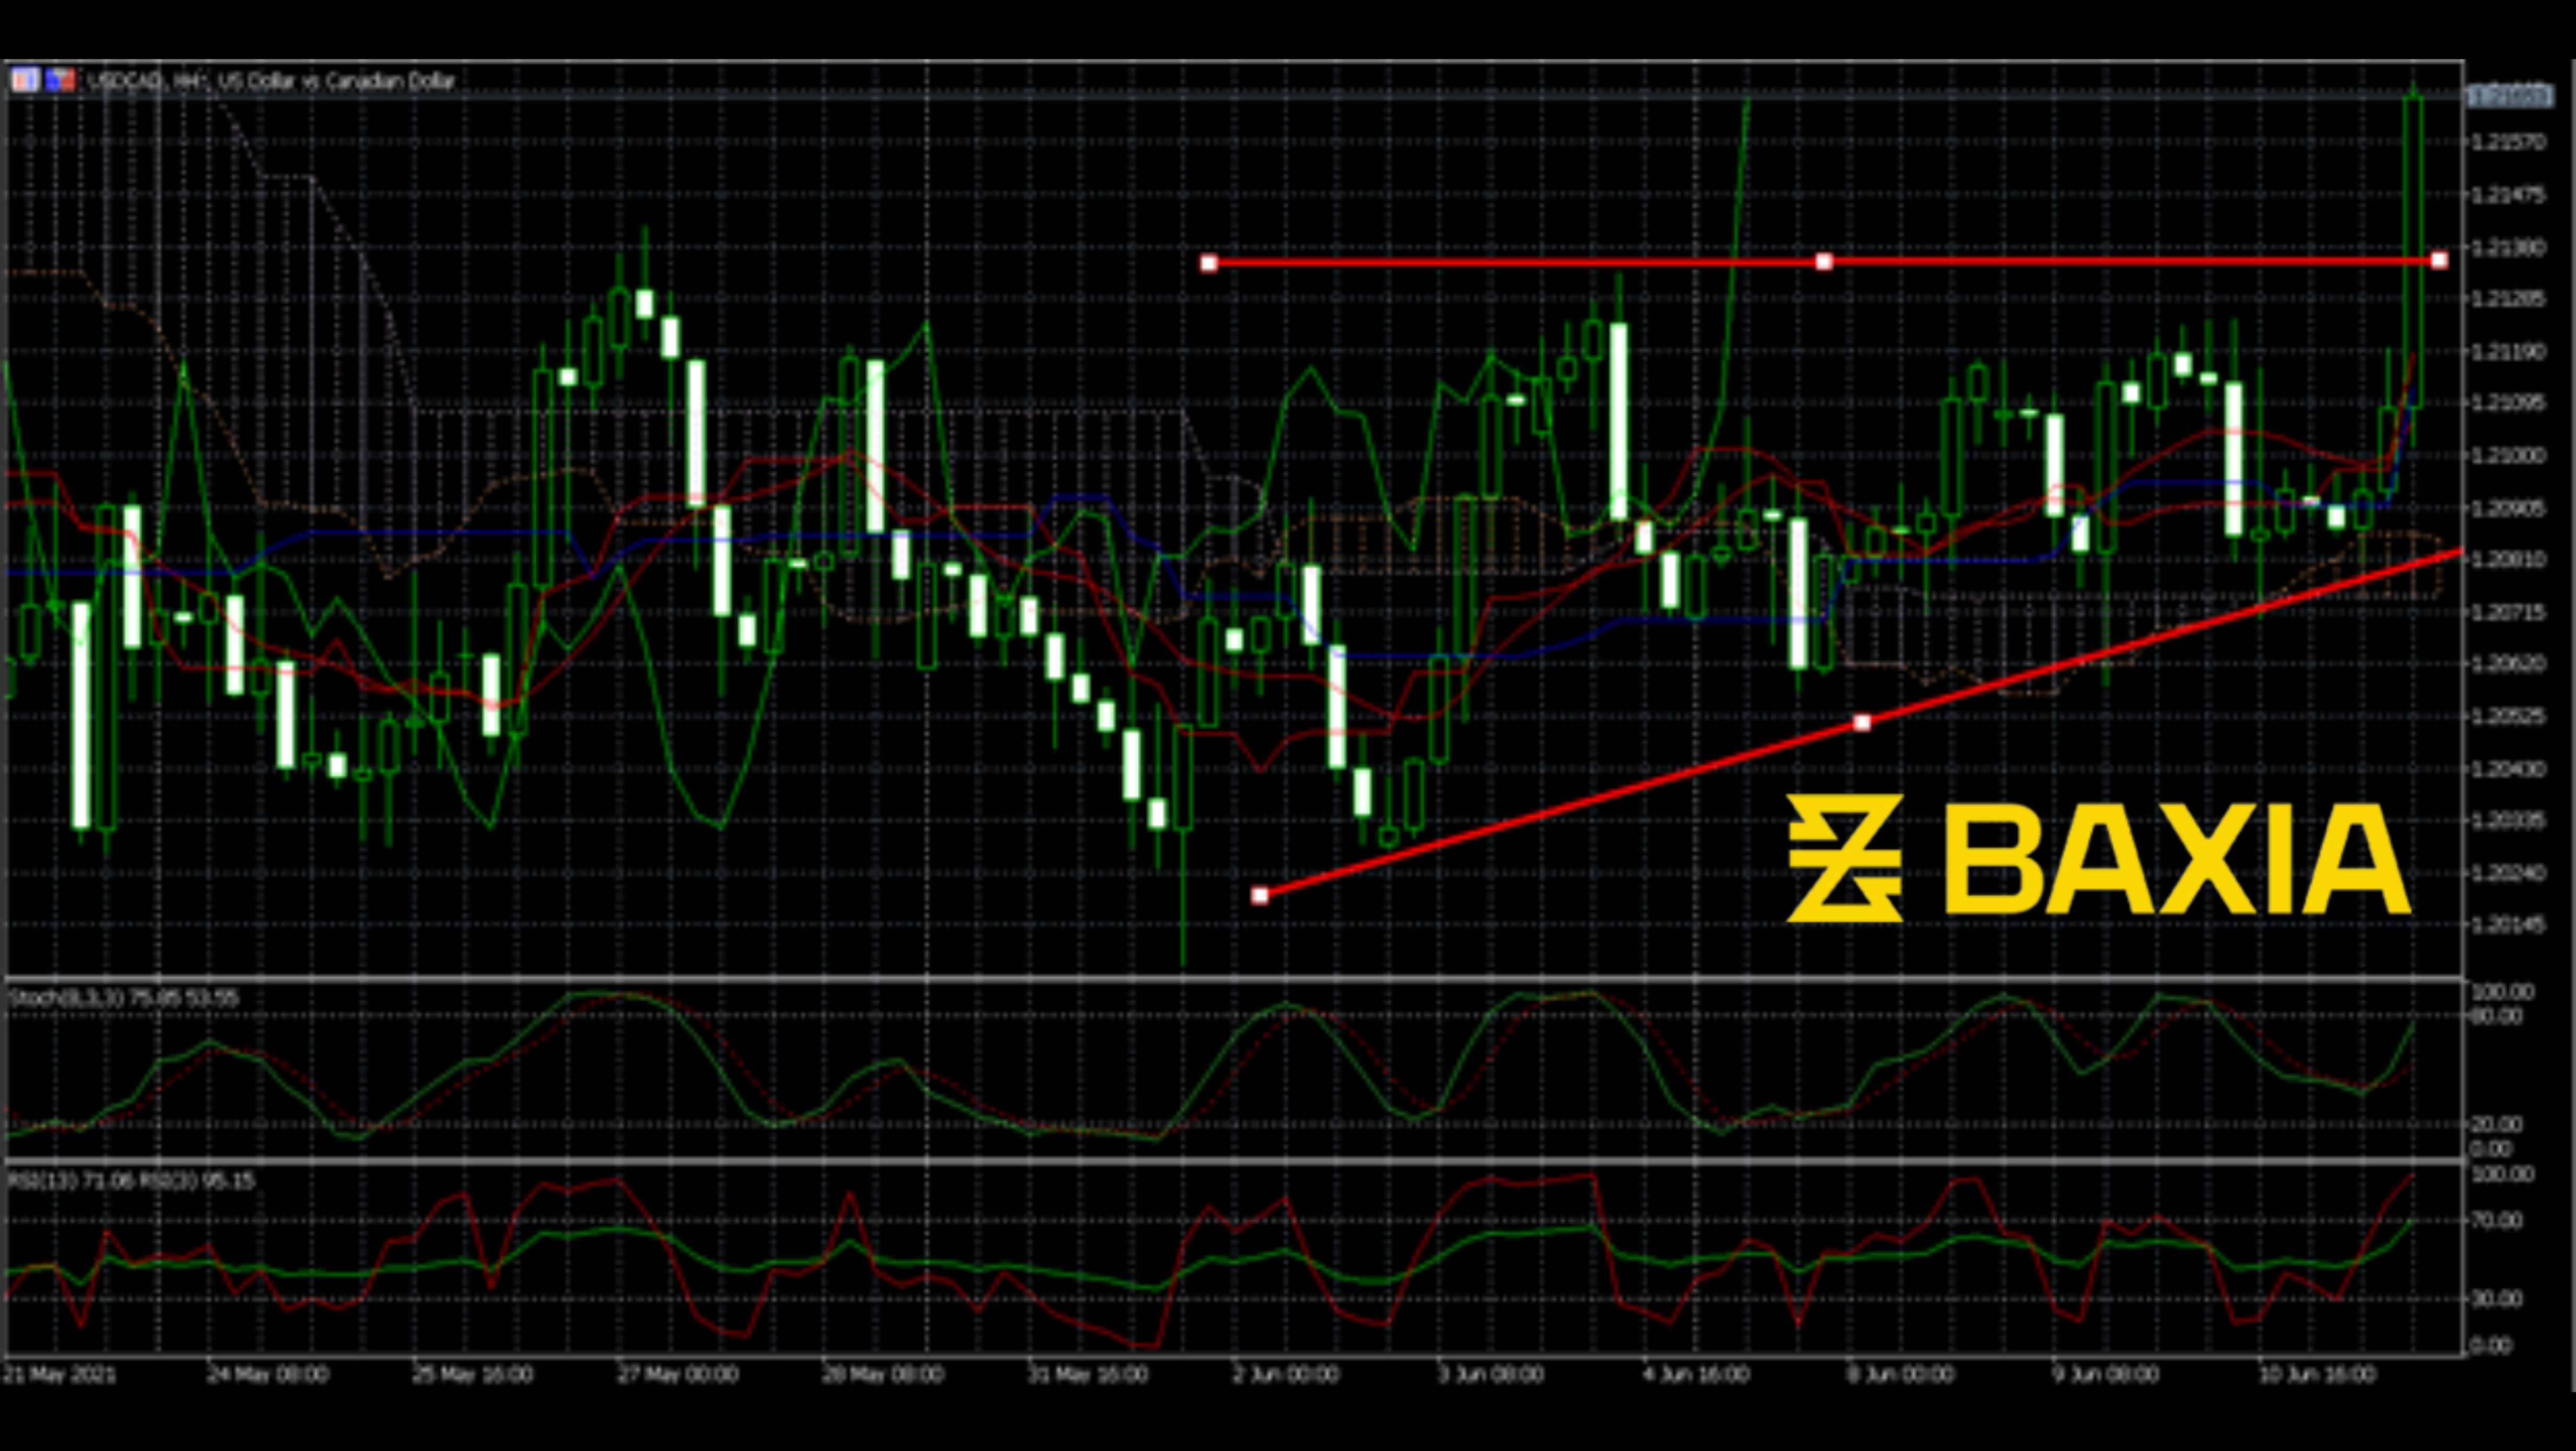
Can this support level change the direction of the price? I don’t think so. The push-up power is not strong enough. The price could break down again.
We love to hear new ideas from traders and want to know what you think!
If you like this topic and want to suggest future topics that you find helpful, let us know by clicking the ‘submit your feedback’ button below.

Trading foreign exchange on margin carries a high level of risk, and may not be suitable for all investors. Before deciding to trade foreign exchange you should carefully consider your investment objectives, level of experience, and risk appetite.
Nothing contained in this website should be construed as investment advice. Any reference to an investment's past or potential performance is not, and should not be construed as, a recommendation or as a guarantee of any specific outcome or profit.