
The ascending triangle had formed for two weeks, since Sep 29th; it was a longer period compared to other triangles. The triangle made three waves, and each of them broke out the lower Bollinger Bands. Next, on Oct 12, the Bollinger Bands shrunk, and then expansion came; we can see the price line moved up on the upper Bollinger Band. The upward trend was steep, and we have not seen any resistance yet.
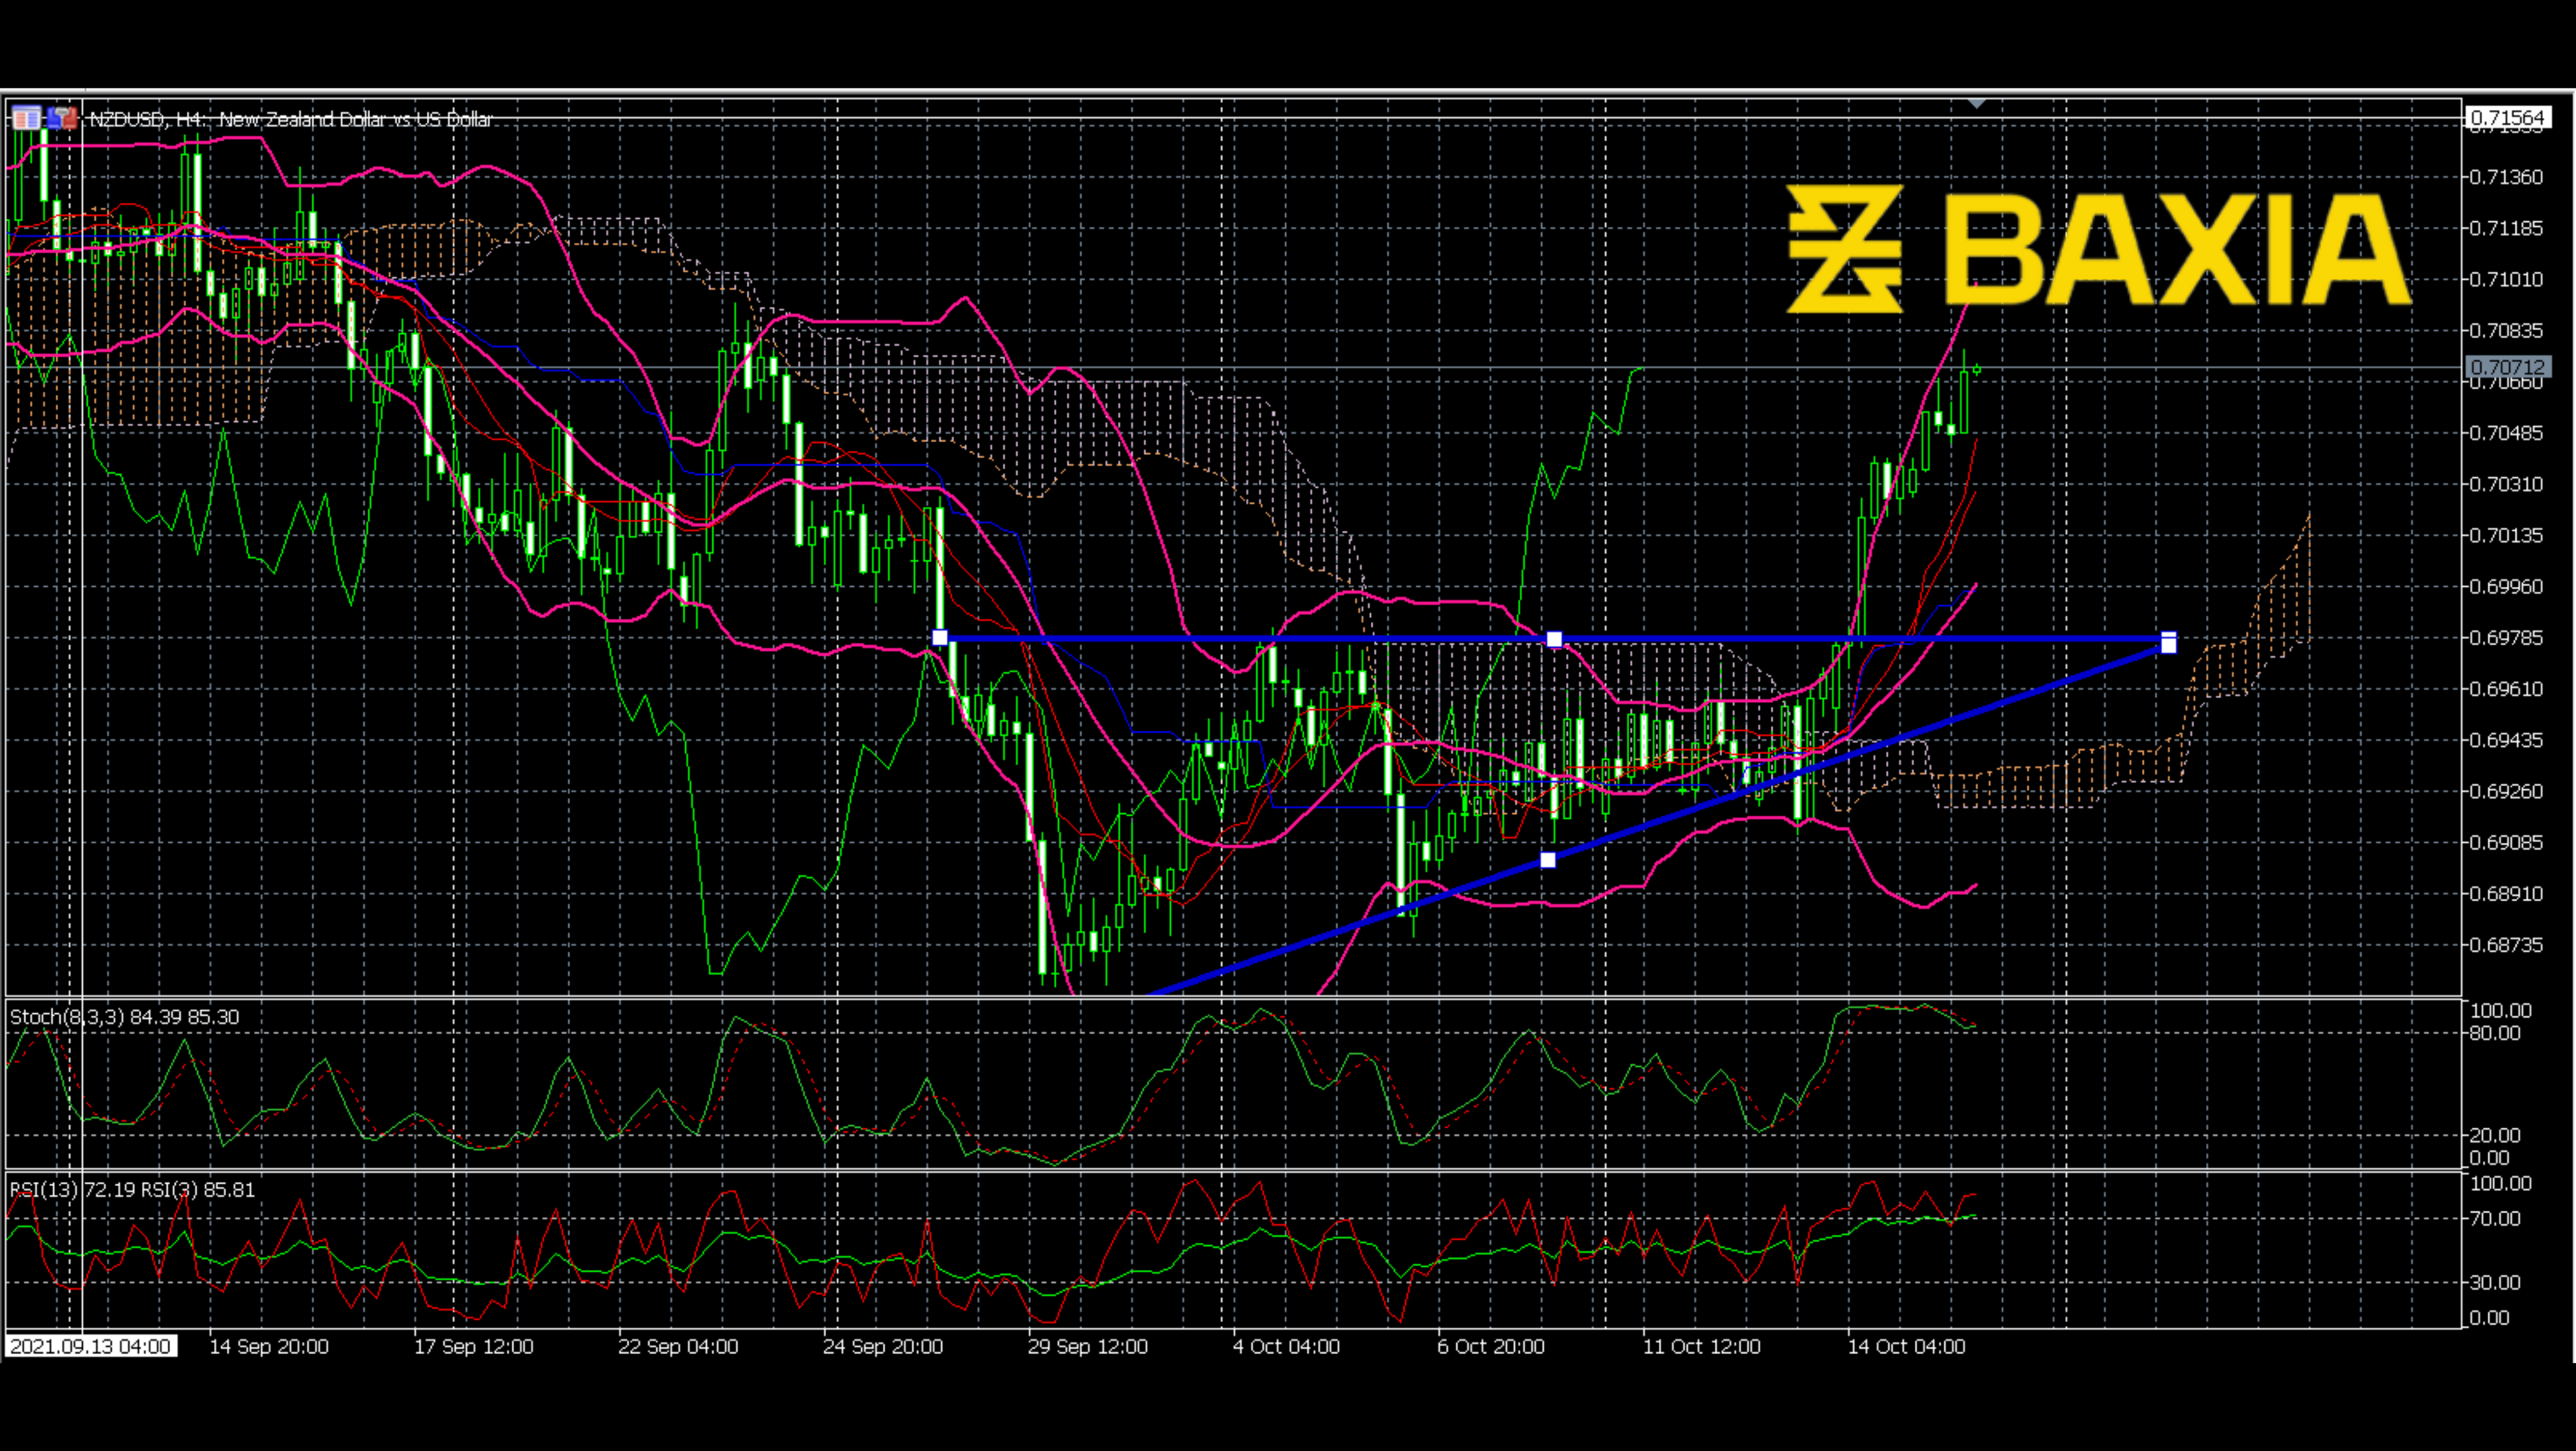
Although the upward trend looks solid, there are still some reverse signals. The Stochastics and RSI have already entered the overbought area since Oct 14th, which was the beginning of the breakout. As we know, the overbought condition is precarious. The price could crash anytime. Also, as can be seen, the price has overlapped with the upper Bollinger band since the beginning of the breakout. The Bollinger bands always push the price back to the middle line, so the price is under pressure now.
We love to hear new ideas from traders and want to know what you think!
If you like this topic and want to suggest future topics that you find helpful, let us know by clicking the ‘submit your feedback’ button below.

Trading foreign exchange on margin carries a high level of risk, and may not be suitable for all investors. Before deciding to trade foreign exchange you should carefully consider your investment objectives, level of experience, and risk appetite.
Nothing contained in this website should be construed as investment advice. Any reference to an investment's past or potential performance is not, and should not be construed as, a recommendation or as a guarantee of any specific outcome or profit.