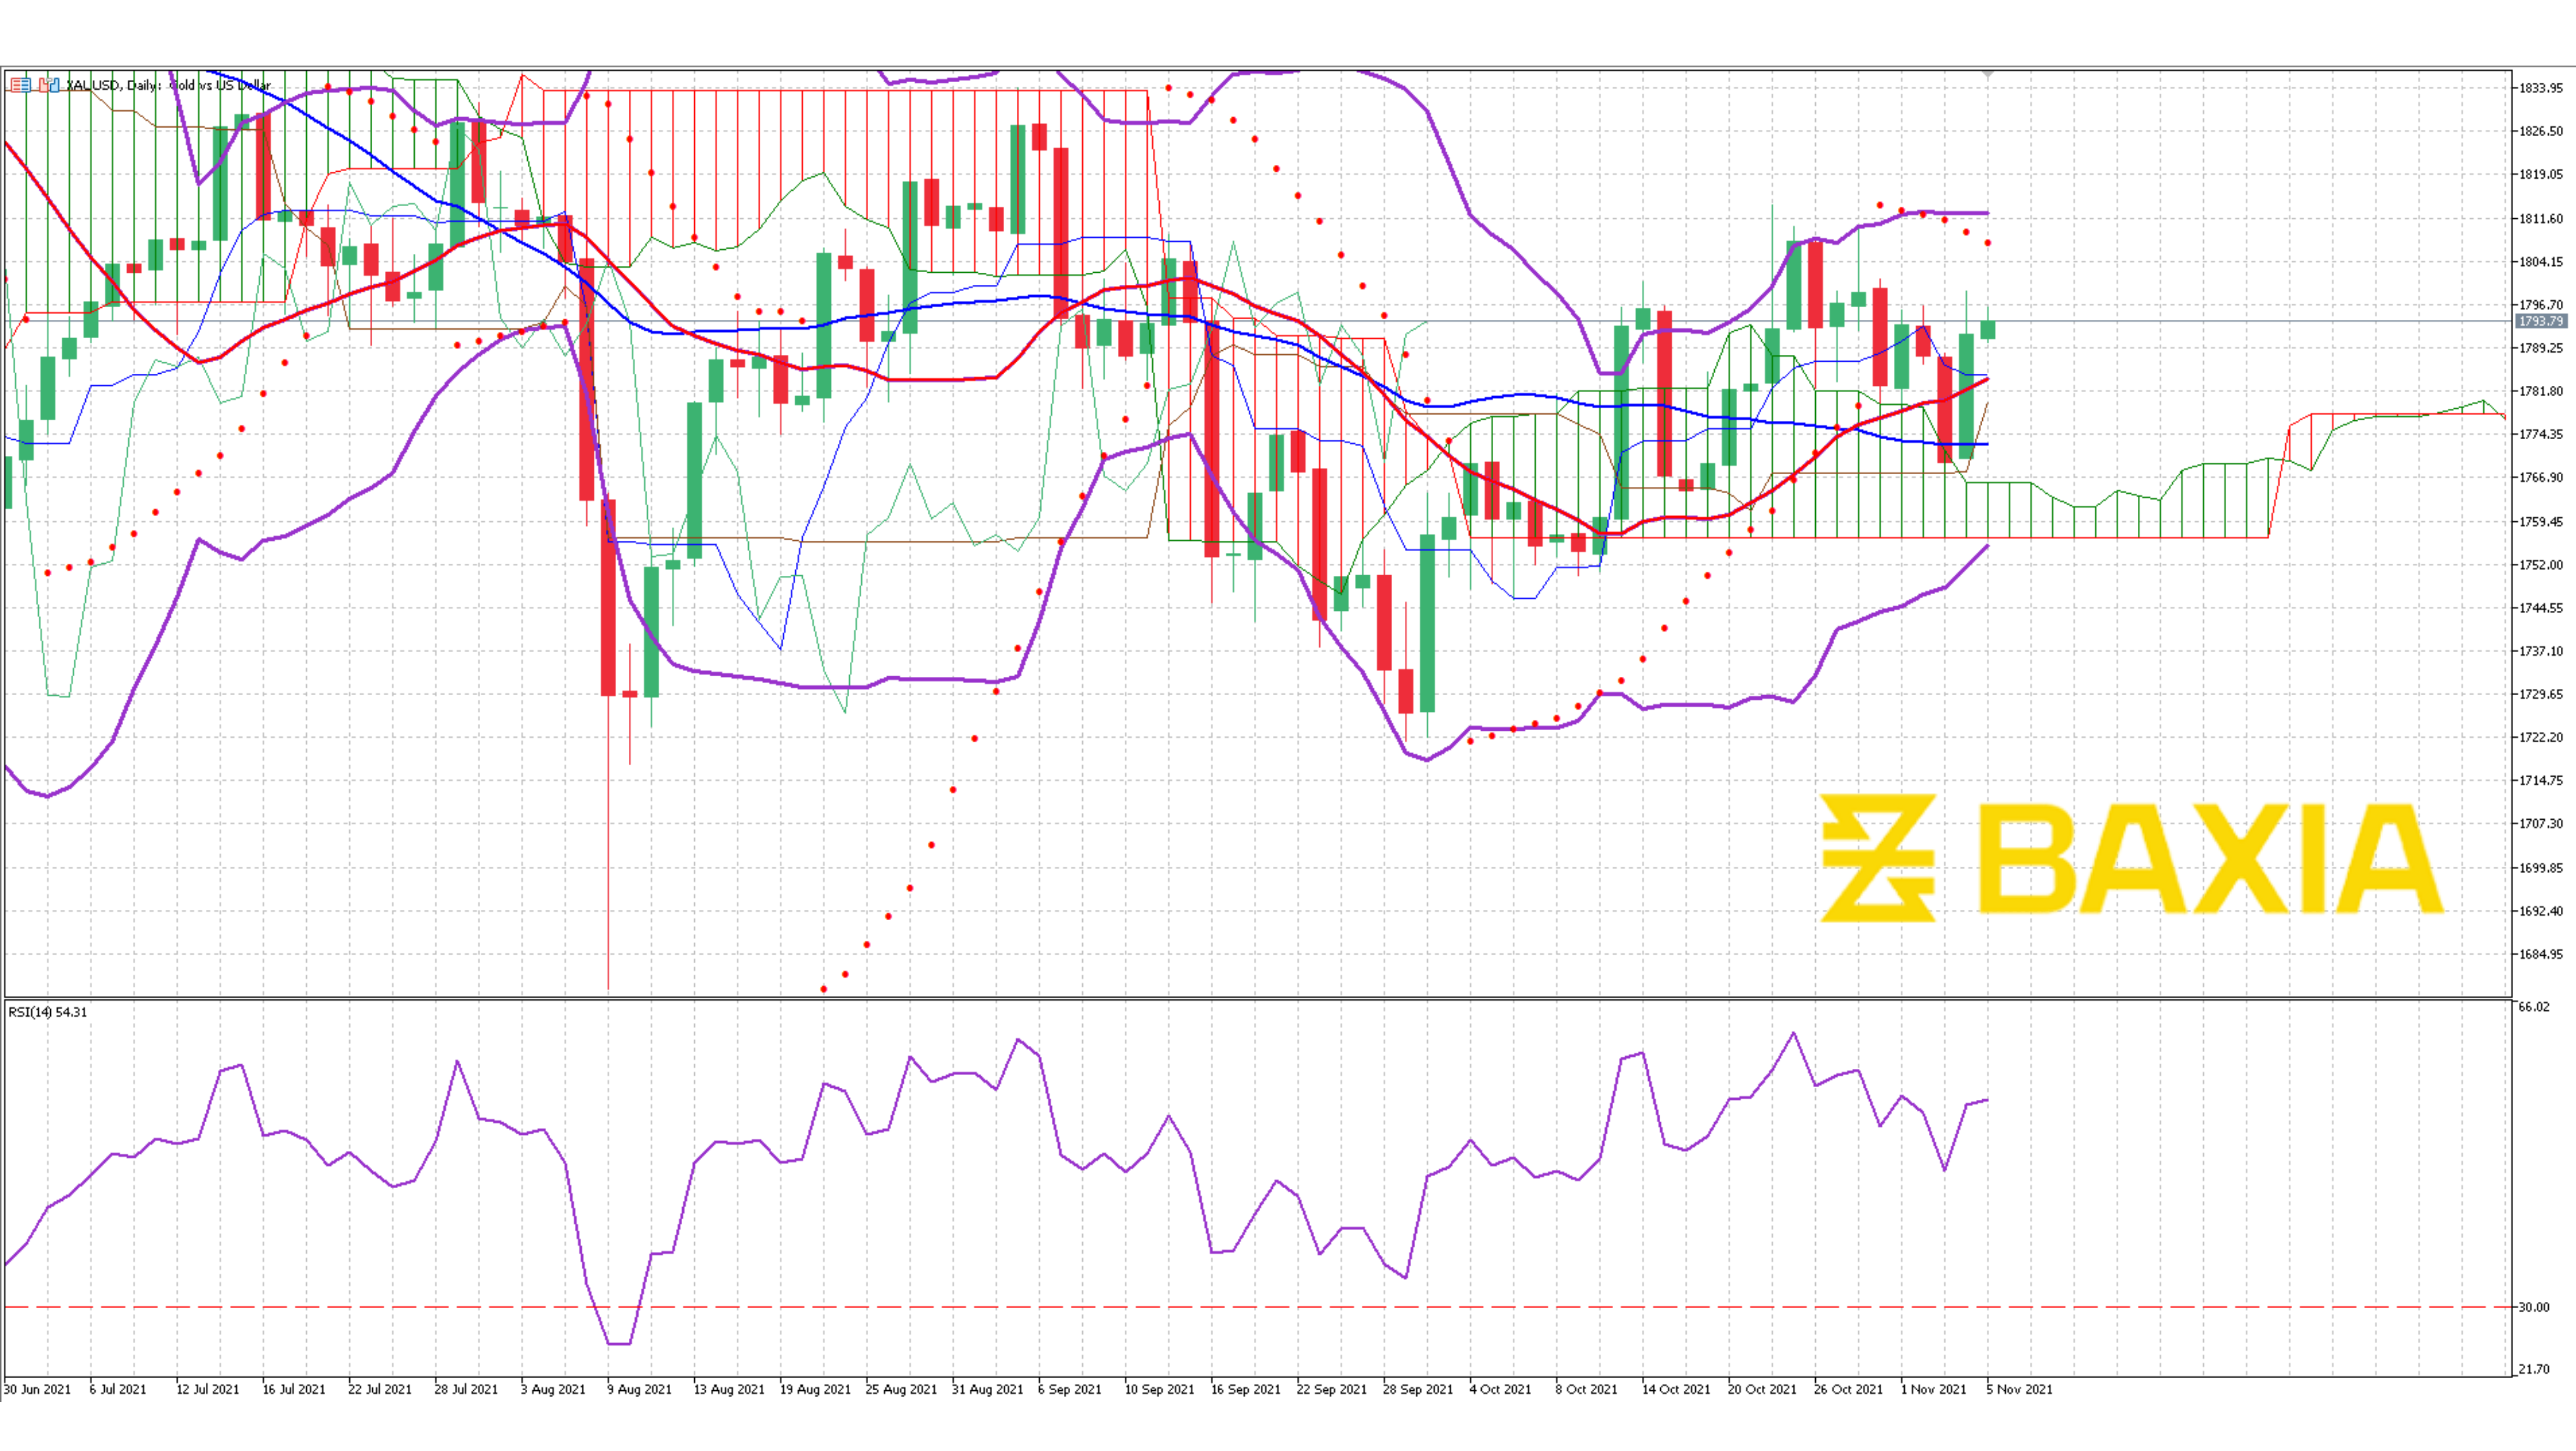

The precious metal made 2.58% profits in only three trading sessions but found strong resistance at 1768.49 on our 61.8% Fibonacci retracement. The price currently trades inside the Ichimoku cloud suggesting that markets are uncertain.
The Bollinger bands are wide but closing up slightly; we should have high volatility and possibly a stronger retracement in the upcoming sessions as the bands are pointing down. The price trades in between the bands, suggesting that it is currently at a fair level.
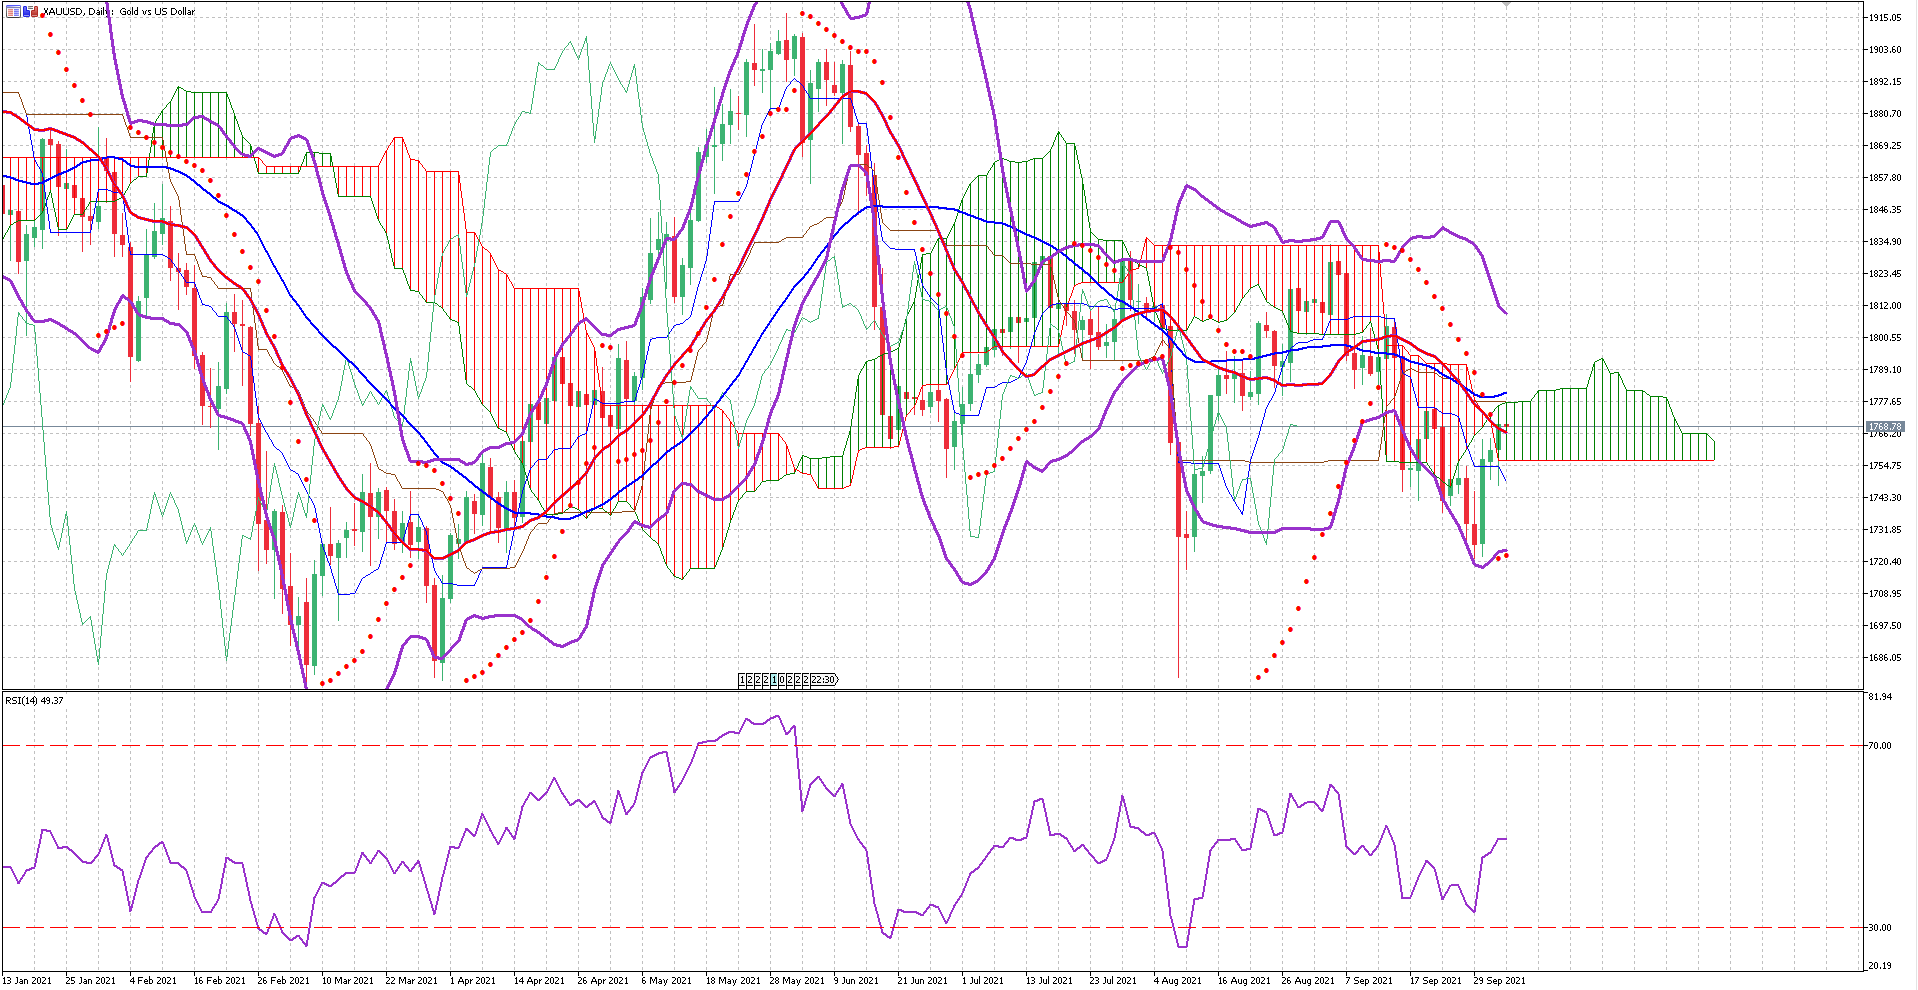
The relative strength index is at 46%, allowing the price to move in either direction before entering an oversold or overbought status. The following support level for Gold is at 1728.13, which corresponds to the 78.6% retracement.
The short and long-term moving averages have been crossing in the last 48 sessions; the markets were uncertain; buyers and sellers are still competing to see who's got the strongest hand.
Our parabolic SAR indicator suggests that the price will continue to increase, but we don't have more technical indicators that signal an uptrend.
We love to hear new ideas from traders and want to know what you think!
If you like this topic and want to suggest future topics that you find helpful, let us know by clicking the ‘submit your feedback’ button below.

Trading foreign exchange on margin carries a high level of risk, and may not be suitable for all investors. Before deciding to trade foreign exchange you should carefully consider your investment objectives, level of experience, and risk appetite.
Nothing contained in this website should be construed as investment advice. Any reference to an investment's past or potential performance is not, and should not be construed as, a recommendation or as a guarantee of any specific outcome or profit.