
The gold market has recently demonstrated stability, with prices hovering above the 61.8% Fibonacci level. However, a closer market chart analysis reveals significant overhead noise, presenting challenges for a breakout. In this article, we will delve into the current state of the gold market, highlighting key price levels and potential scenarios for traders and investors.
.jpg?width=1291&height=732&name=gold(3).jpg)
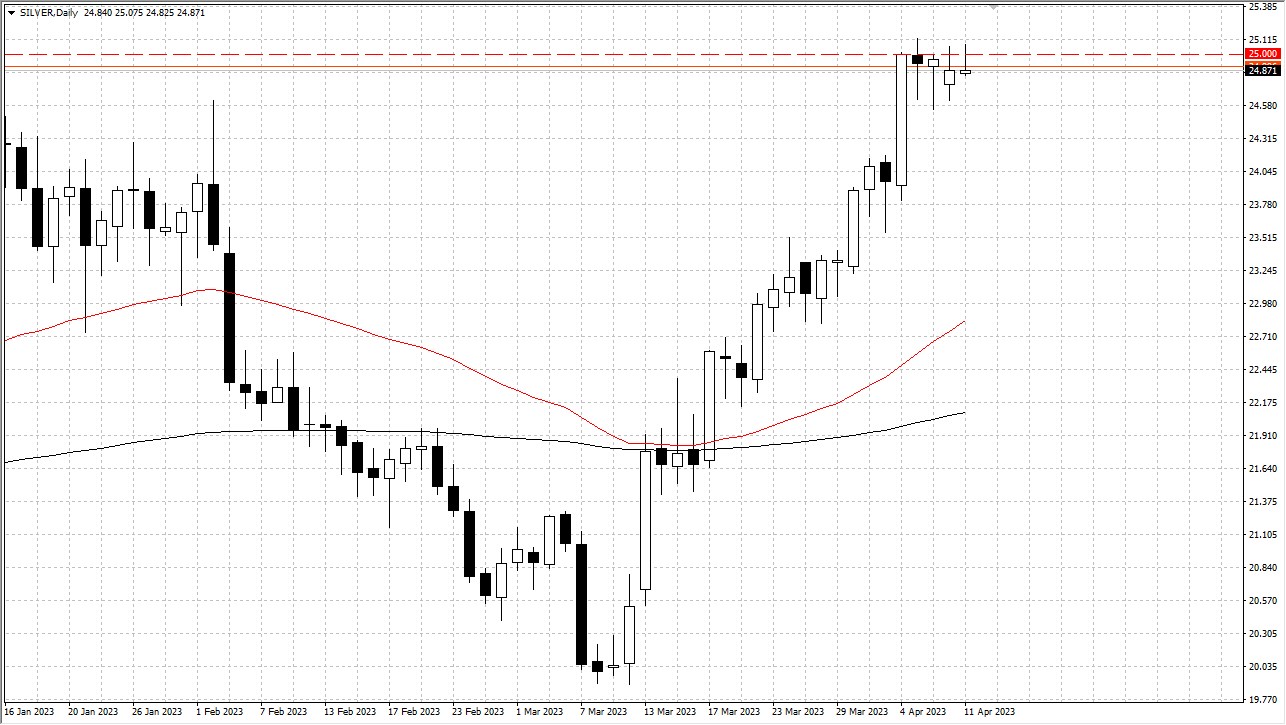
One of the notable price levels in the gold market is $1950, which attracts significant attention from market participants. If gold surpasses this level, the focus will shift to the 50-Day EMA (Exponential Moving Average). Beyond that, the $2000 level becomes an important target for the market. However, breaking through these resistance levels may be formidable, given the current market conditions.
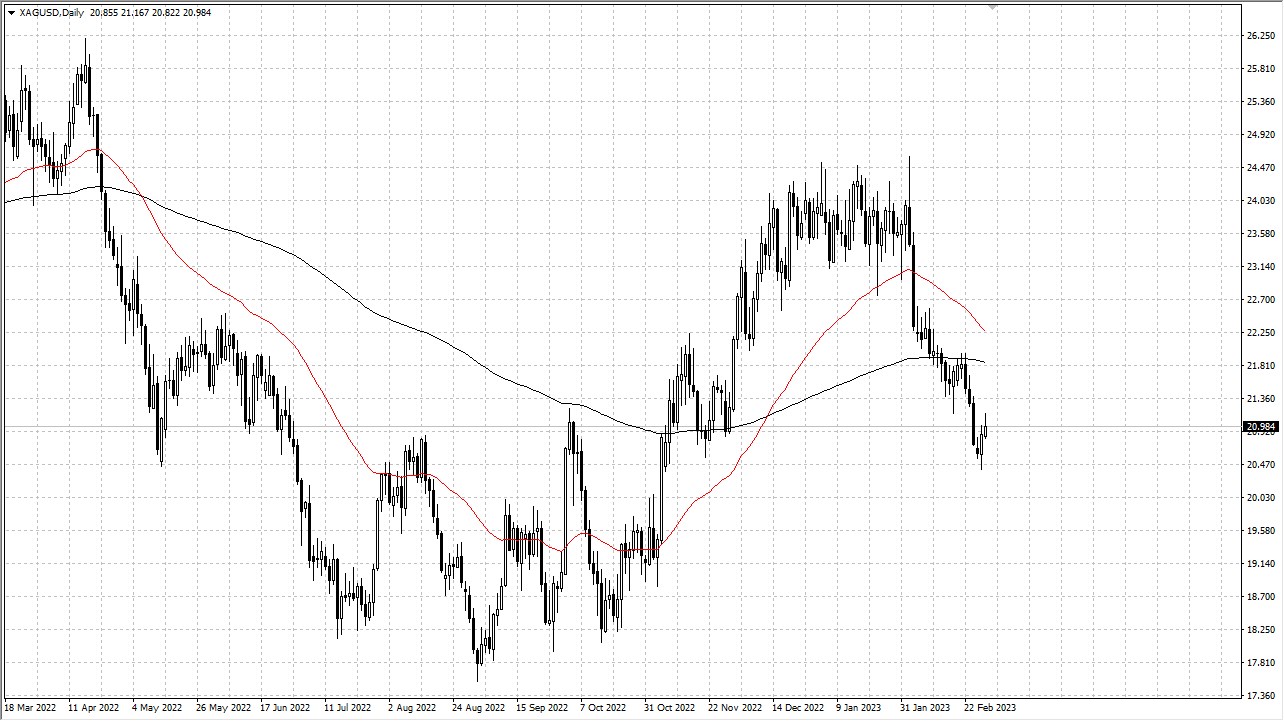
On the other hand, the 200-Day EMA, positioned just below the 61.8% Fibonacci level, acts as a potential floor for the market. A breach below this level could trigger further selling pressure, potentially leading to a decline toward the $1800 level. However, it is crucial to note that such a scenario is not currently anticipated. Gold recently experienced an upward gap in the futures market, suggesting potential upward momentum.
The relationship between the US dollar and gold has shown recent significance, although it remains subject to constant flux. The interplay between these two assets is likely to vary over time. Consequently, relying solely on one factor can be misleading, yet many retail traders fall into this thinking pattern. While the US dollar can exert a major influence on gold, it is important to acknowledge that both assets can rise concurrently, particularly in scenarios involving demand for wealth preservation or safety.
The 200-Day EMA continues to be an essential technical indicator that traders closely monitor. Its proximity to the current price levels enhances its significance as a potential support zone. Market participants will watch for signs of a bounce from this level, as it presents opportunities to capitalize on potential price reversals.
At the end of the day, the gold market has recently demonstrated stability, although overhead noise hinders a clear breakout. Traders and investors should closely observe the $1950 and 50-Day EMA as key resistance areas. Conversely, the 200-Day EMA acts as a potential floor, and a breach below it requires careful consideration.
While the relationship between the US dollar and gold remains influential, it is crucial to acknowledge the multifaceted nature of market dynamics. Factors such as wealth preservation and safety concerns can independently affect gold prices. Additionally, the 200-Day EMA retains its significance as an essential indicator for identifying potential trading opportunities.

Trading foreign exchange on margin carries a high level of risk, and may not be suitable for all investors. Before deciding to trade foreign exchange you should carefully consider your investment objectives, level of experience, and risk appetite.
Nothing contained in this website should be construed as investment advice. Any reference to an investment's past or potential performance is not, and should not be construed as, a recommendation or as a guarantee of any specific outcome or profit