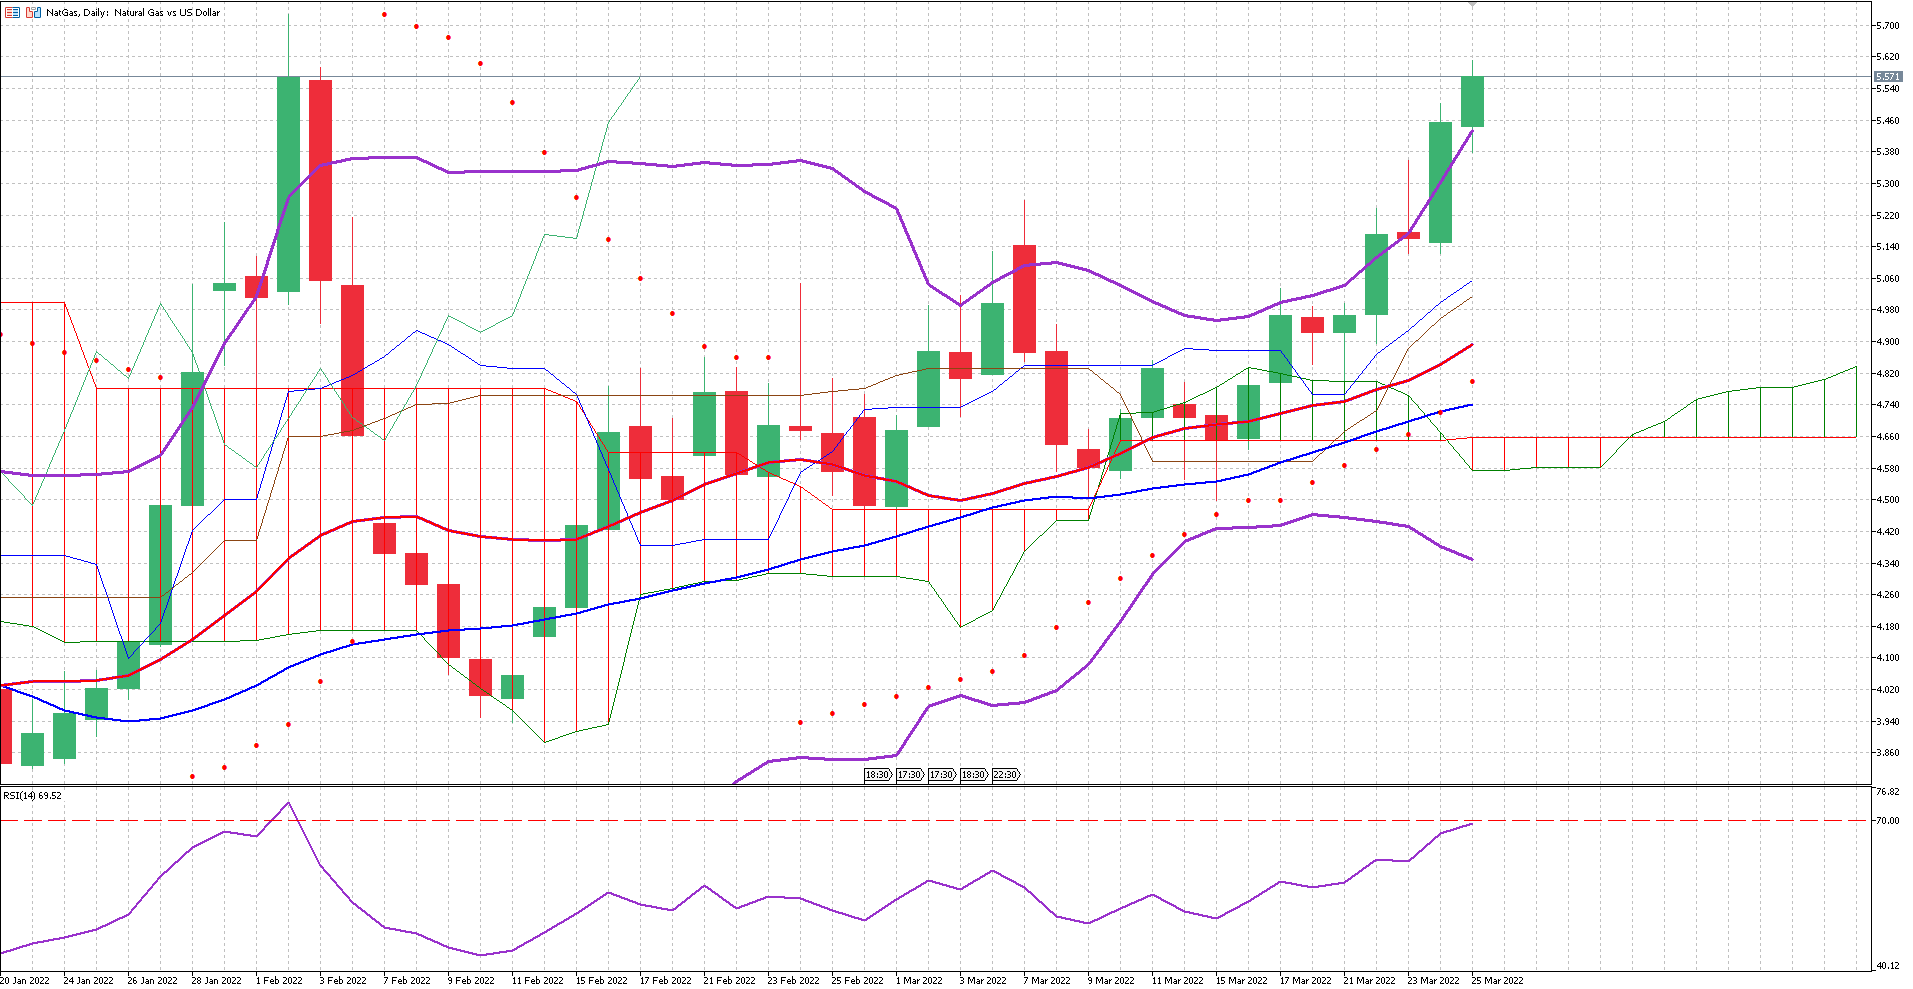

The energy commodity managed to reach 6.771 which was previously reached in December 2008. XNGUSD started a rally in mid-March and has only found five pullbacks since. The short and long-term moving averages continue moving upward, and the gap between the lines is increasing.
The Bollinger bands are very wide, which will allow the pair to continue moving upwards, however, the pair is currently trading above the upper band, suggesting that the price is relatively high. From a technical analysis perspective, the pair should retrace in the short term, but there are fundamental factors influencing the price spike.
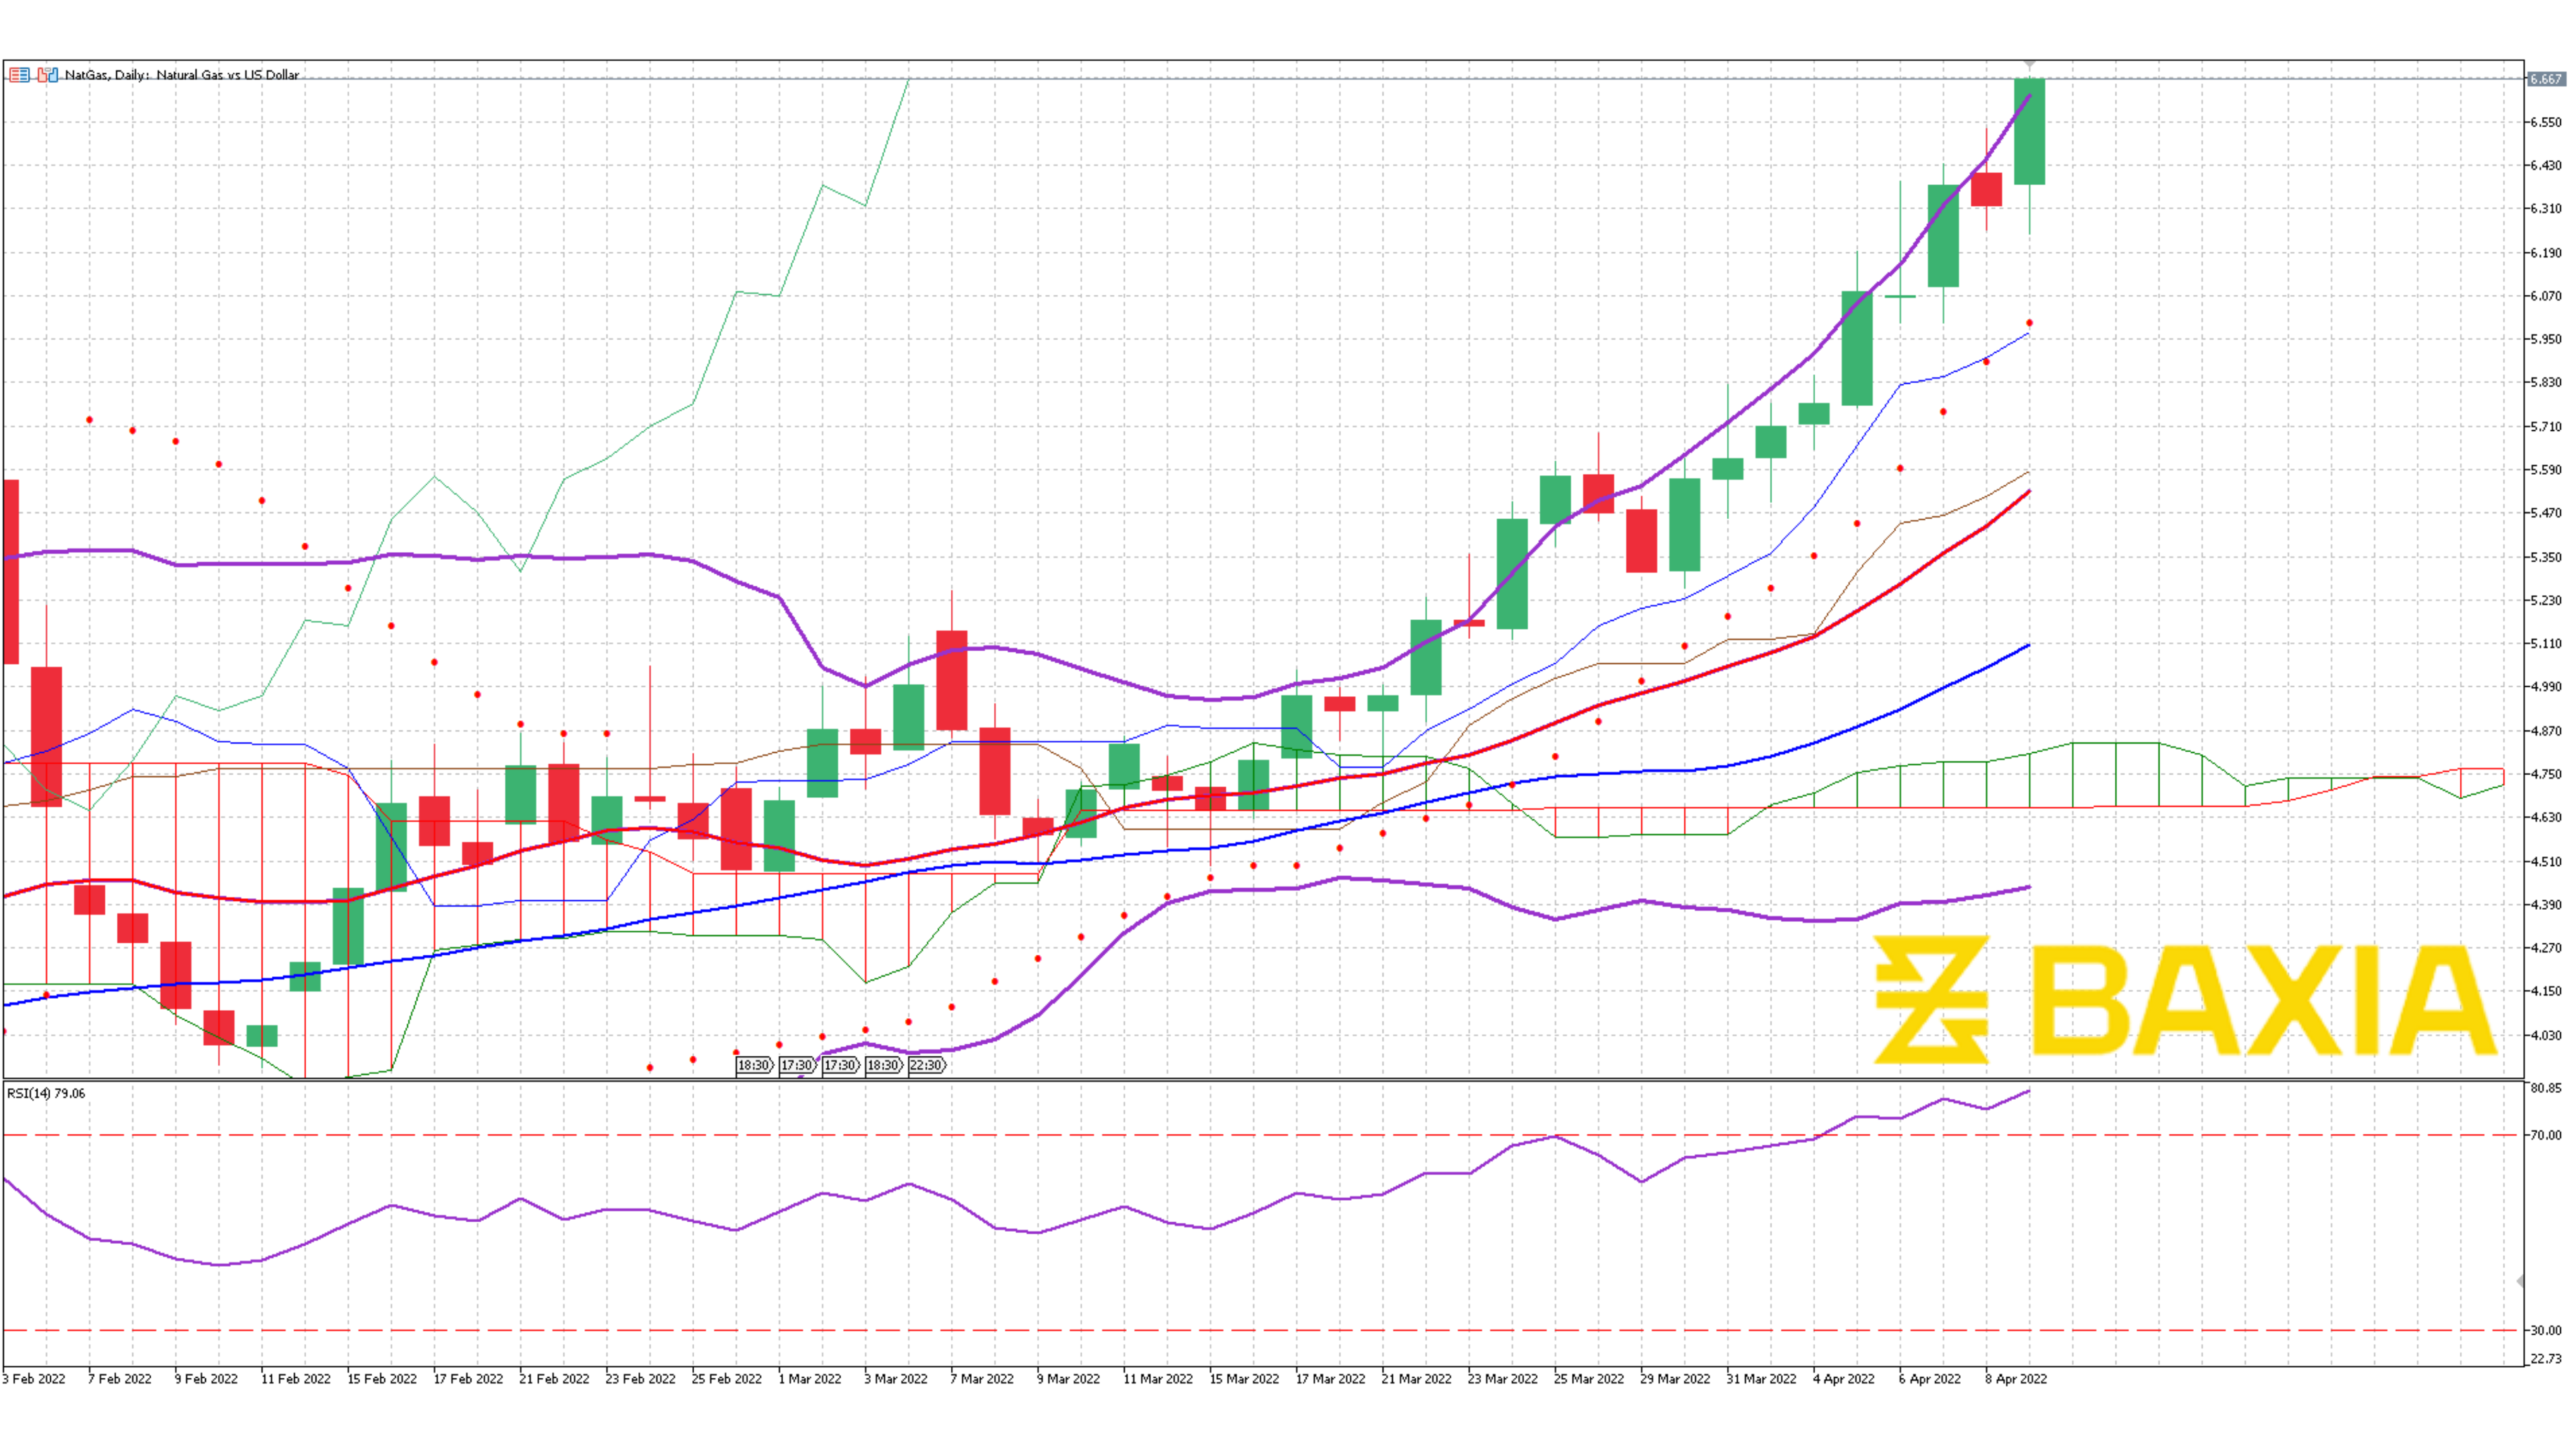
The relative strength index is at 79% which is already overbought, usually, we would see the price drop after a few sessions of being overbought, but Natural Gas has been overbought for the last five trading sessions as the rally continues. Our parabolic SAR indicator suggests that the price will continue to move upwards.
We love to hear new ideas from traders and want to know what you think!
If you like this topic and want to suggest future topics that you find helpful, let us know by clicking the ‘submit your feedback’ button below.

Trading foreign exchange on margin carries a high level of risk, and may not be suitable for all investors. Before deciding to trade foreign exchange you should carefully consider your investment objectives, level of experience, and risk appetite.
Nothing contained in this website should be construed as investment advice. Any reference to an investment's past or potential performance is not, and should not be construed as, a recommendation or as a guarantee of any specific outcome or profit.