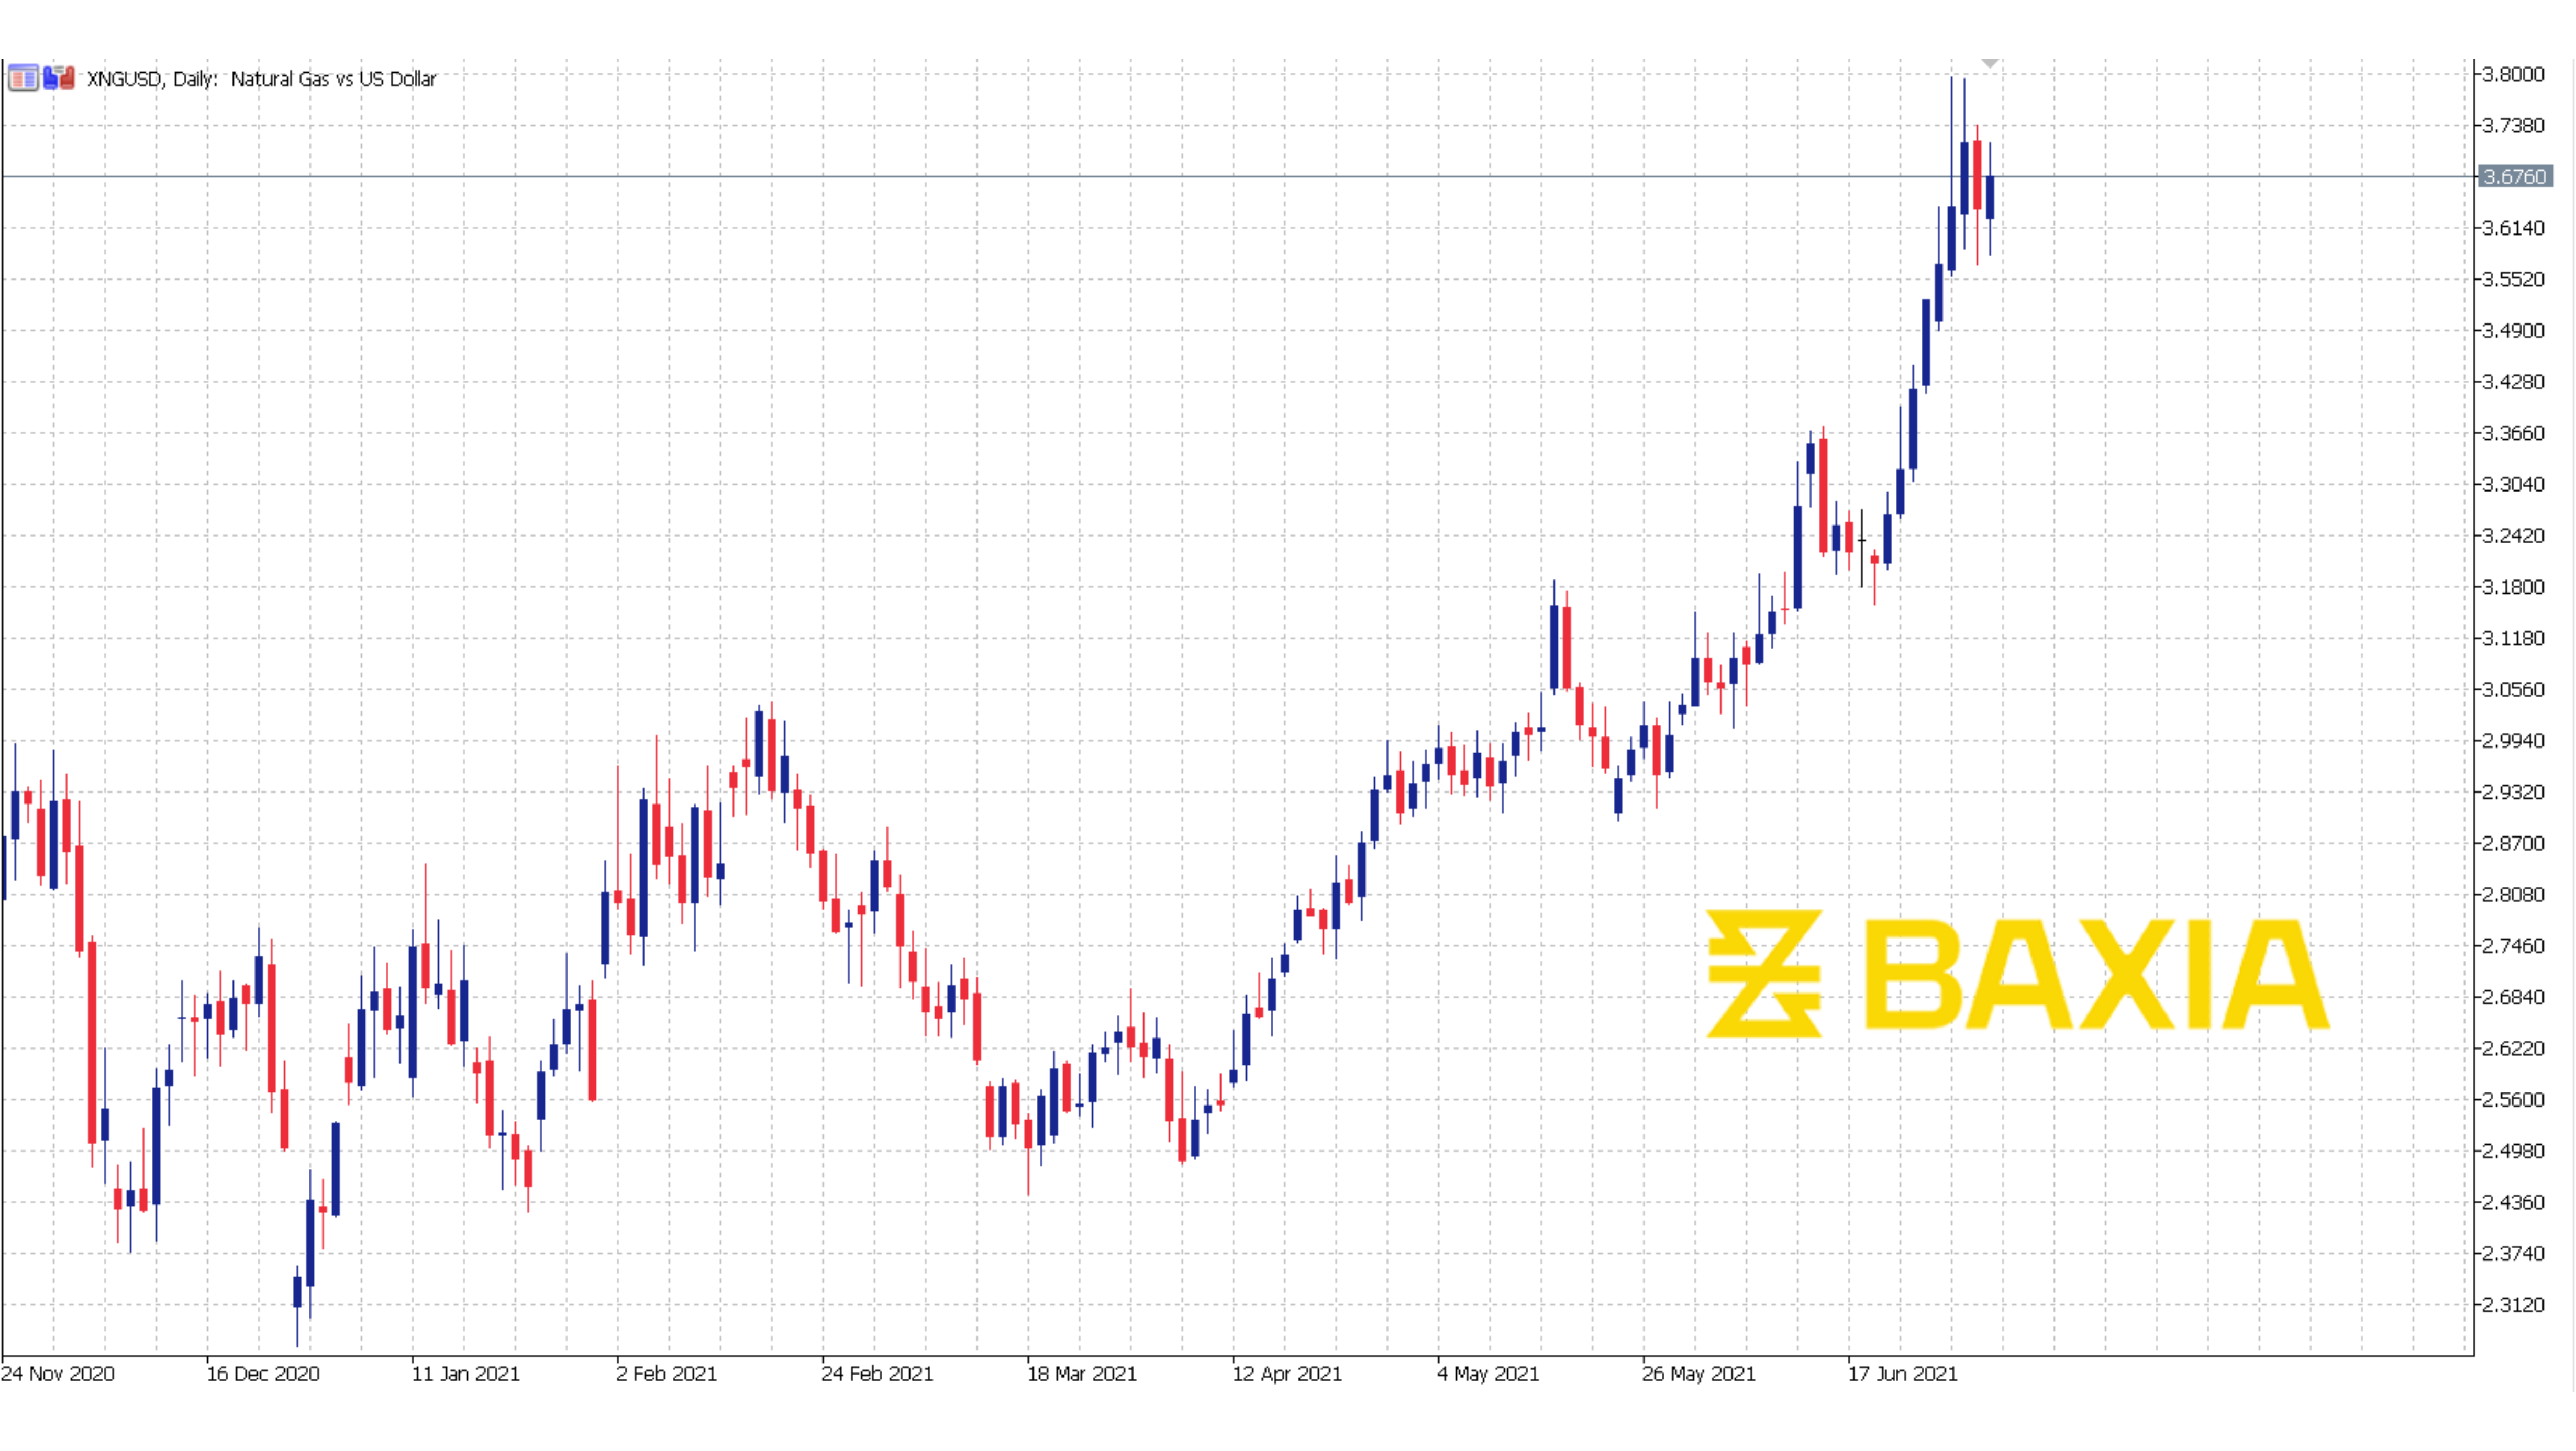

Could this be the beginning of a downtrend for Natural Gas? Five sessions ago Natural Gas reached its highest level since early November. The fine commodity has since lost 6.94% and managed to break the support level found at our 23.2% Fibonacci retracement at $3.027.
The Bollinger bands are shrinking and this means that volatility could be lower in the upcoming trading sessions. The price trades below the short term moving averages suggesting that the downtrend would continue. The relative strength index is currently at 53% which would allow the pair to continue falling. Our parabolic SAR indicator tells us that a downtrend is to be expected.
.png?width=4920&name=Graph%20Template%20(28).png)
The next support level for Natural Gas is at $2.924. We would expect the price to reach this level next week, then we would have to wait and see if the price is able to break the support or bounce back.
We love to hear new ideas from traders and want to know what you think!
If you like this topic and want to suggest future topics that you find helpful, let us know by clicking the ‘submit your feedback’ button below.

Trading foreign exchange on margin carries a high level of risk, and may not be suitable for all investors. Before deciding to trade foreign exchange you should carefully consider your investment objectives, level of experience, and risk appetite.
Nothing contained in this website should be construed as investment advice. Any reference to an investment's past or potential performance is not, and should not be construed as, a recommendation or as a guarantee of any specific outcome or profit.