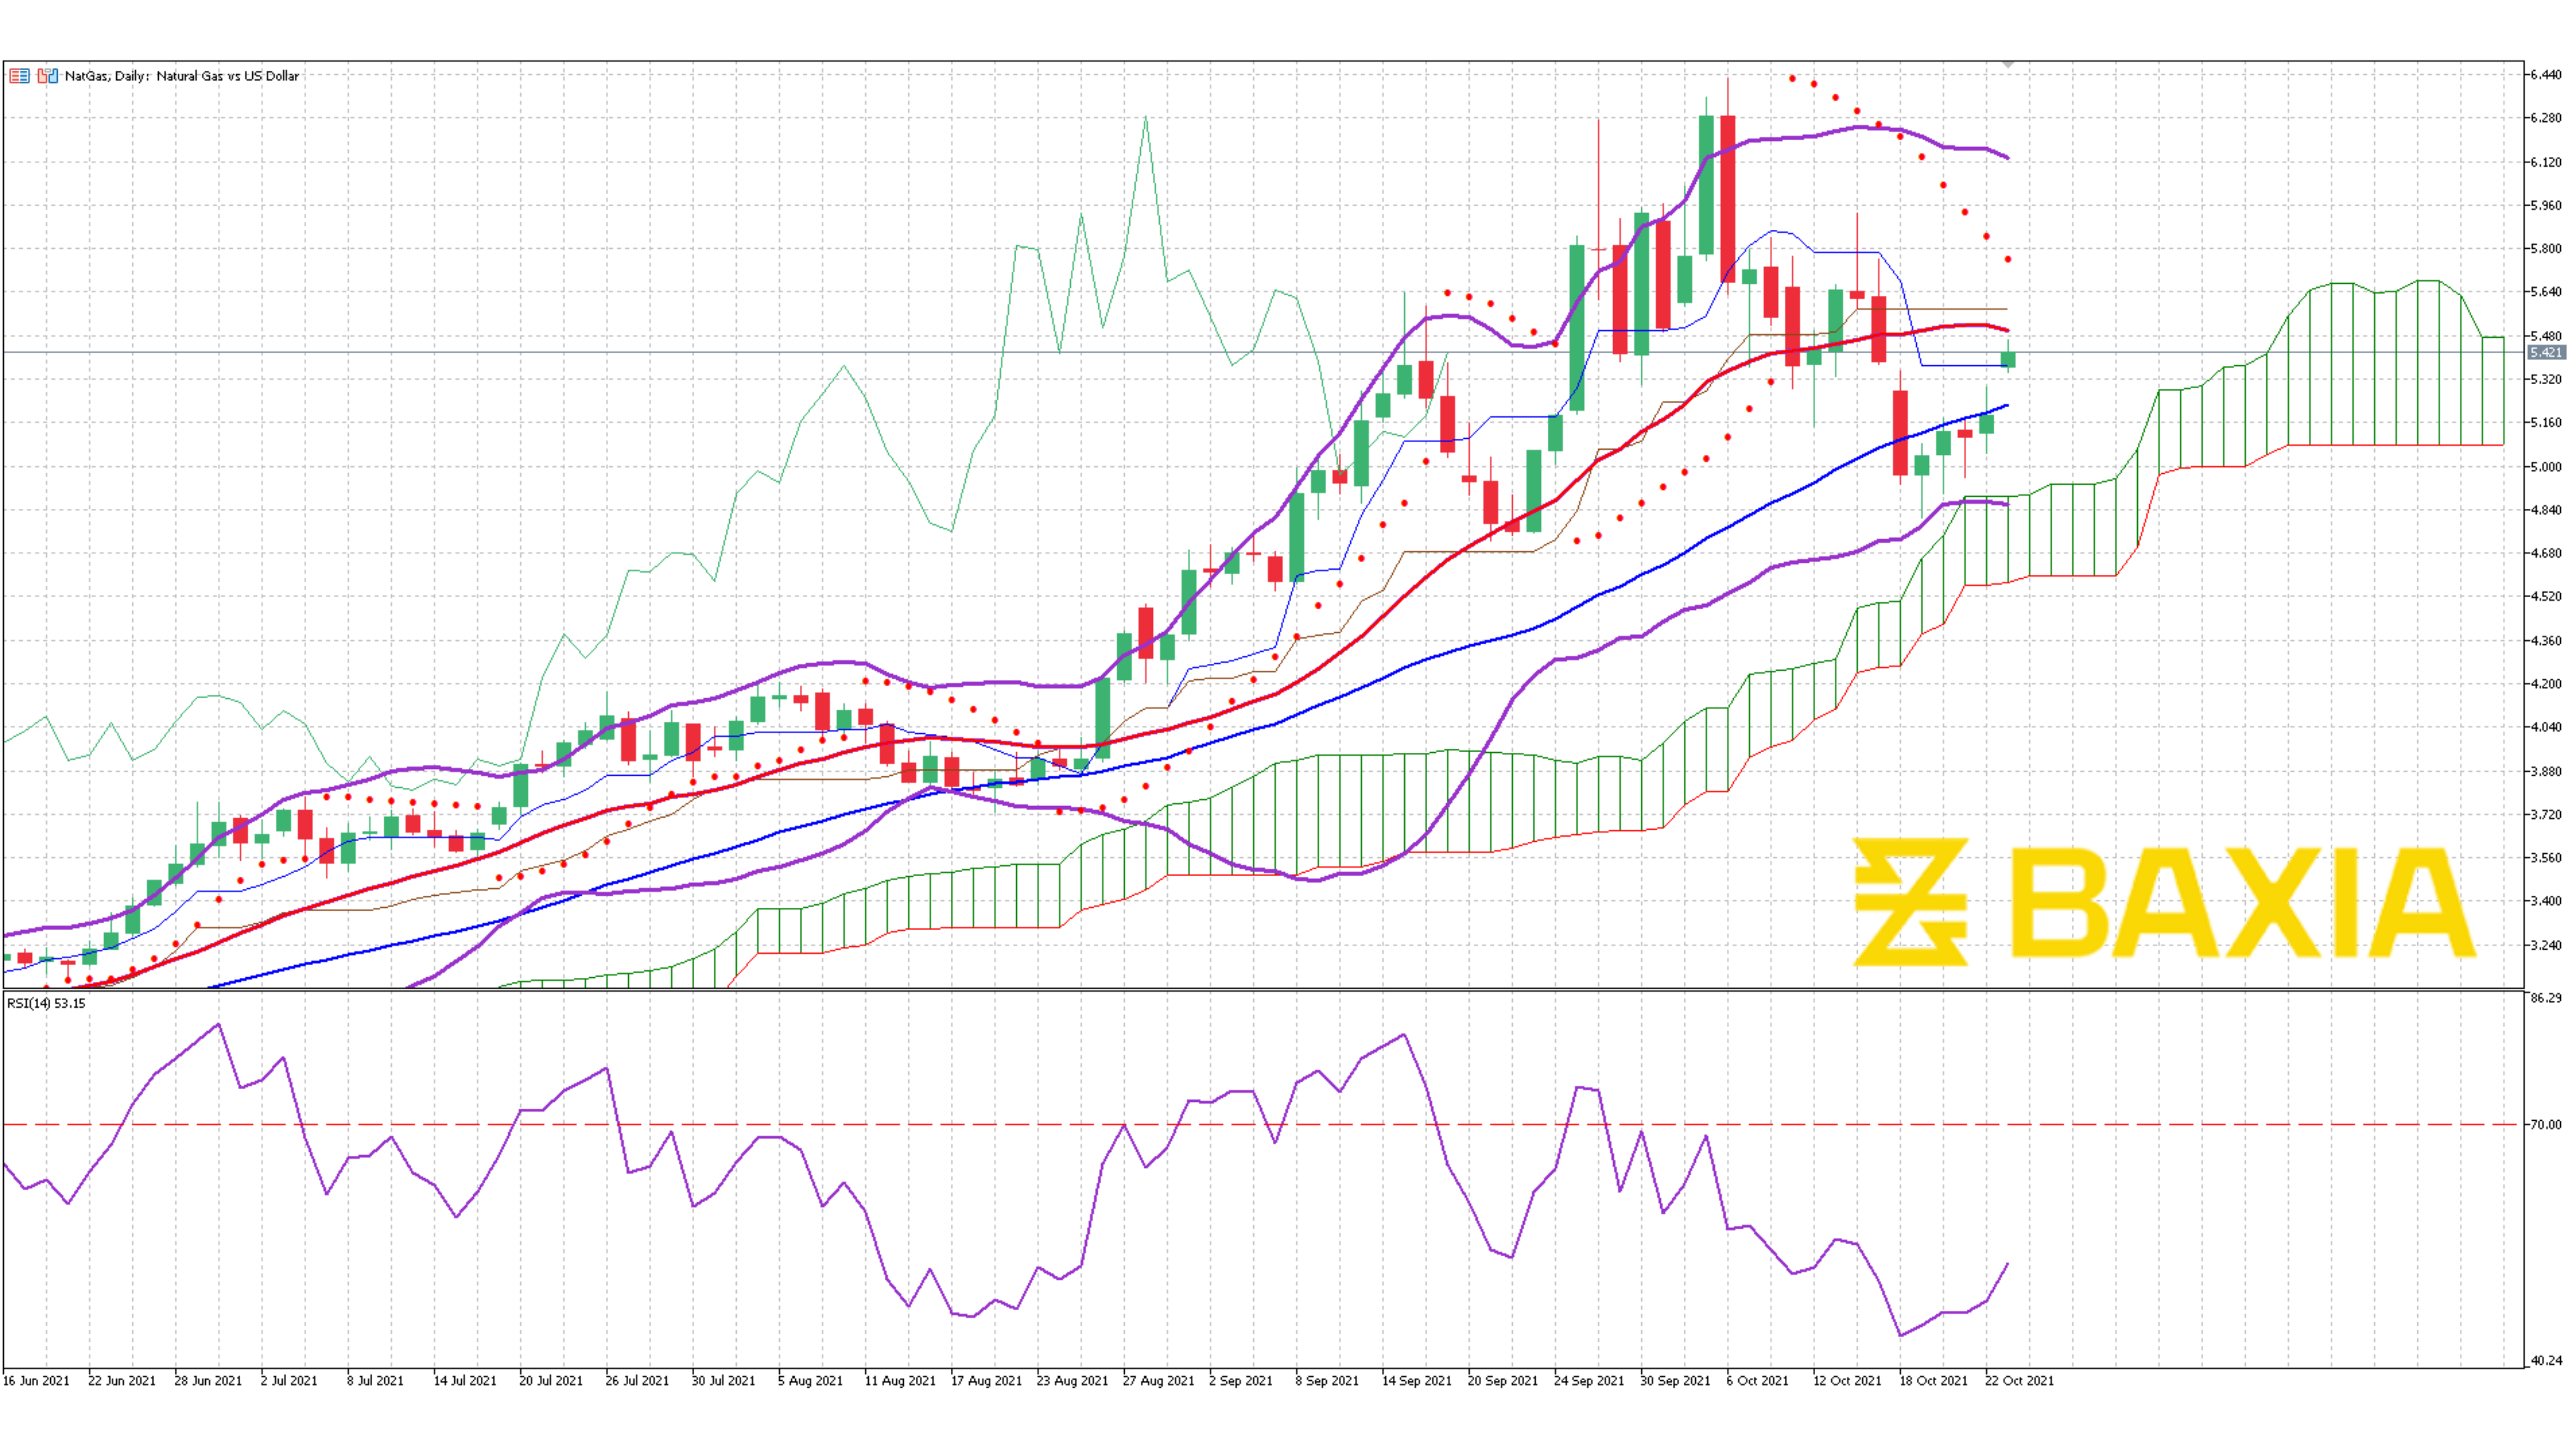

The energy commodity has been on a sharp decline for the last four trading sessions; it broke the support level at the 23.6% Fibonacci retracement on $5.569. We believe this pullback is only temporary as the asset is recovering from an overbought status. The demand for energy commodities will continue to rise in the upcoming months.
The Bollinger bands are wide, and high volatility is expected; the price is currently trading in between the bands, suggesting it's at a fair level; this is, of course, after taking the 16% loss. The short and long-term moving averages continue moving up, and the gap between the lines increases, suggesting that the uptrend will continue after the retracement.
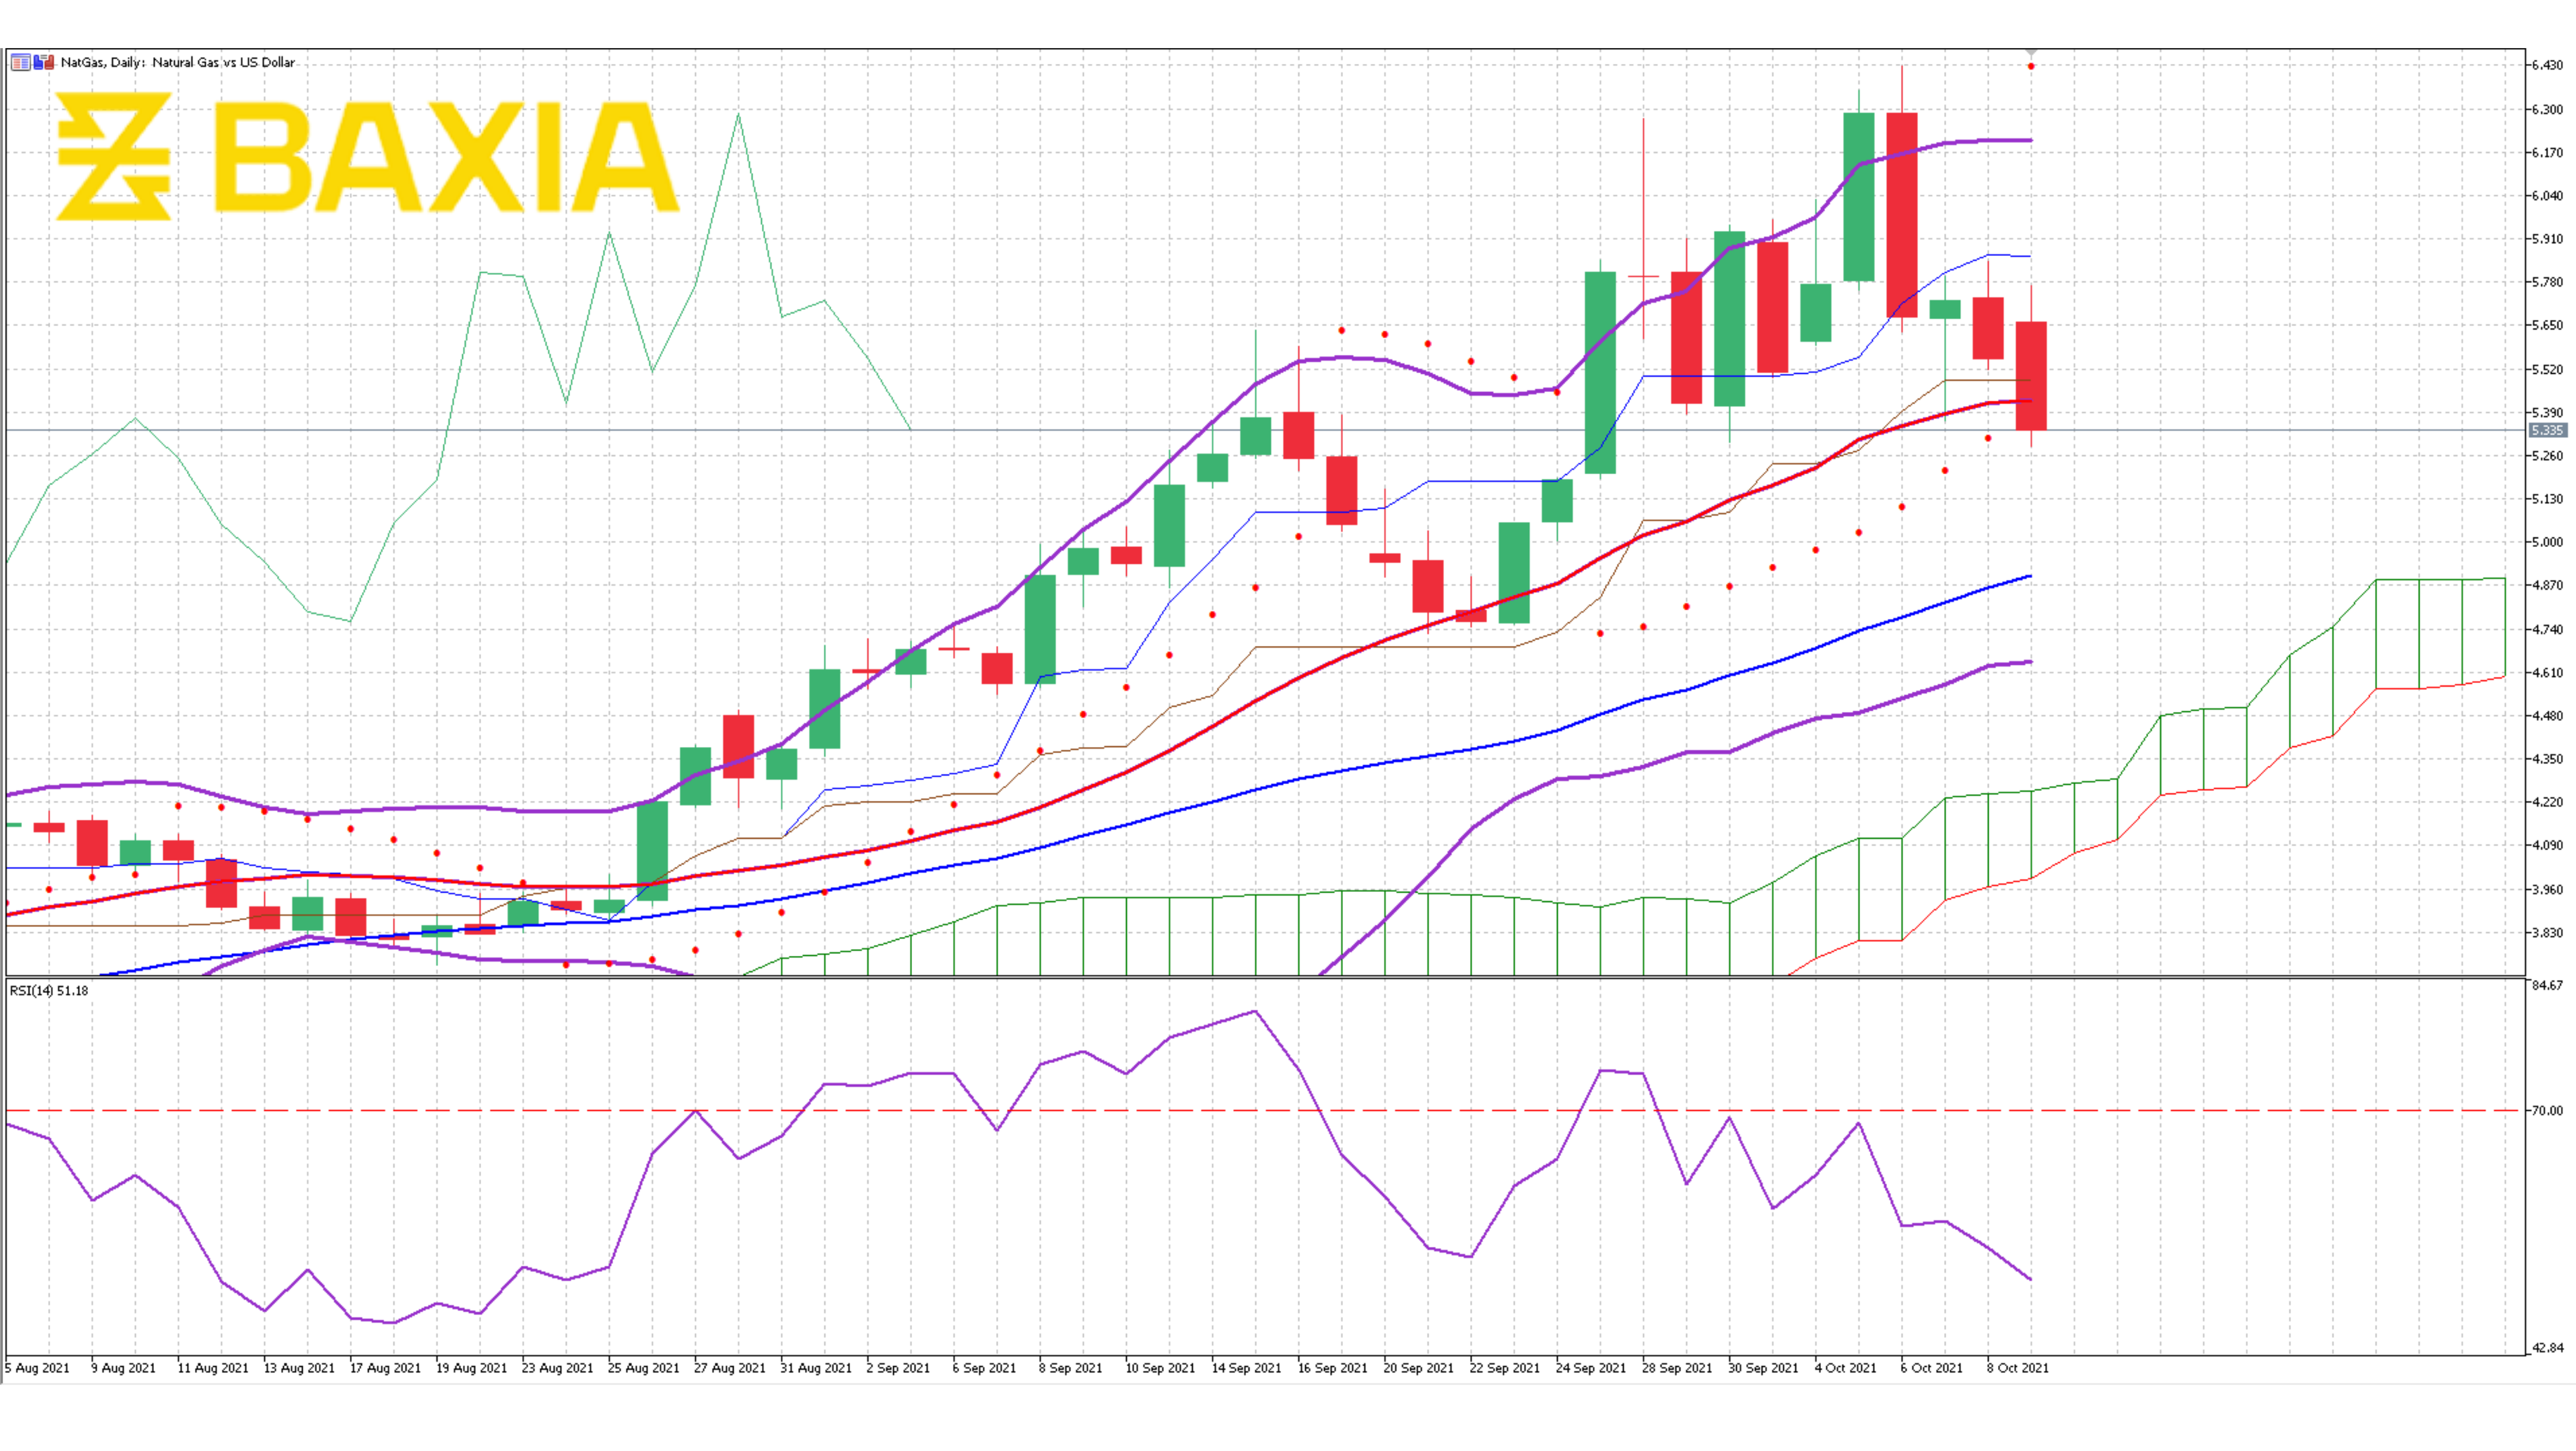
The relative strength index is recovering from an overbought status, currently at 53%, which will allow the price of Natural Gas to resume its uptrend in the short term. Our parabolic SAR indicator suggests that the price will fall in the short term, this is normal after a two-day losing streak, but we do not rely too much on this indicator as it is often used as a confirmation.
We love to hear new ideas from traders and want to know what you think!
If you like this topic and want to suggest future topics that you find helpful, let us know by clicking the ‘submit your feedback’ button below.

Trading foreign exchange on margin carries a high level of risk, and may not be suitable for all investors. Before deciding to trade foreign exchange you should carefully consider your investment objectives, level of experience, and risk appetite.
Nothing contained in this website should be construed as investment advice. Any reference to an investment's past or potential performance is not, and should not be construed as, a recommendation or as a guarantee of any specific outcome or profit.