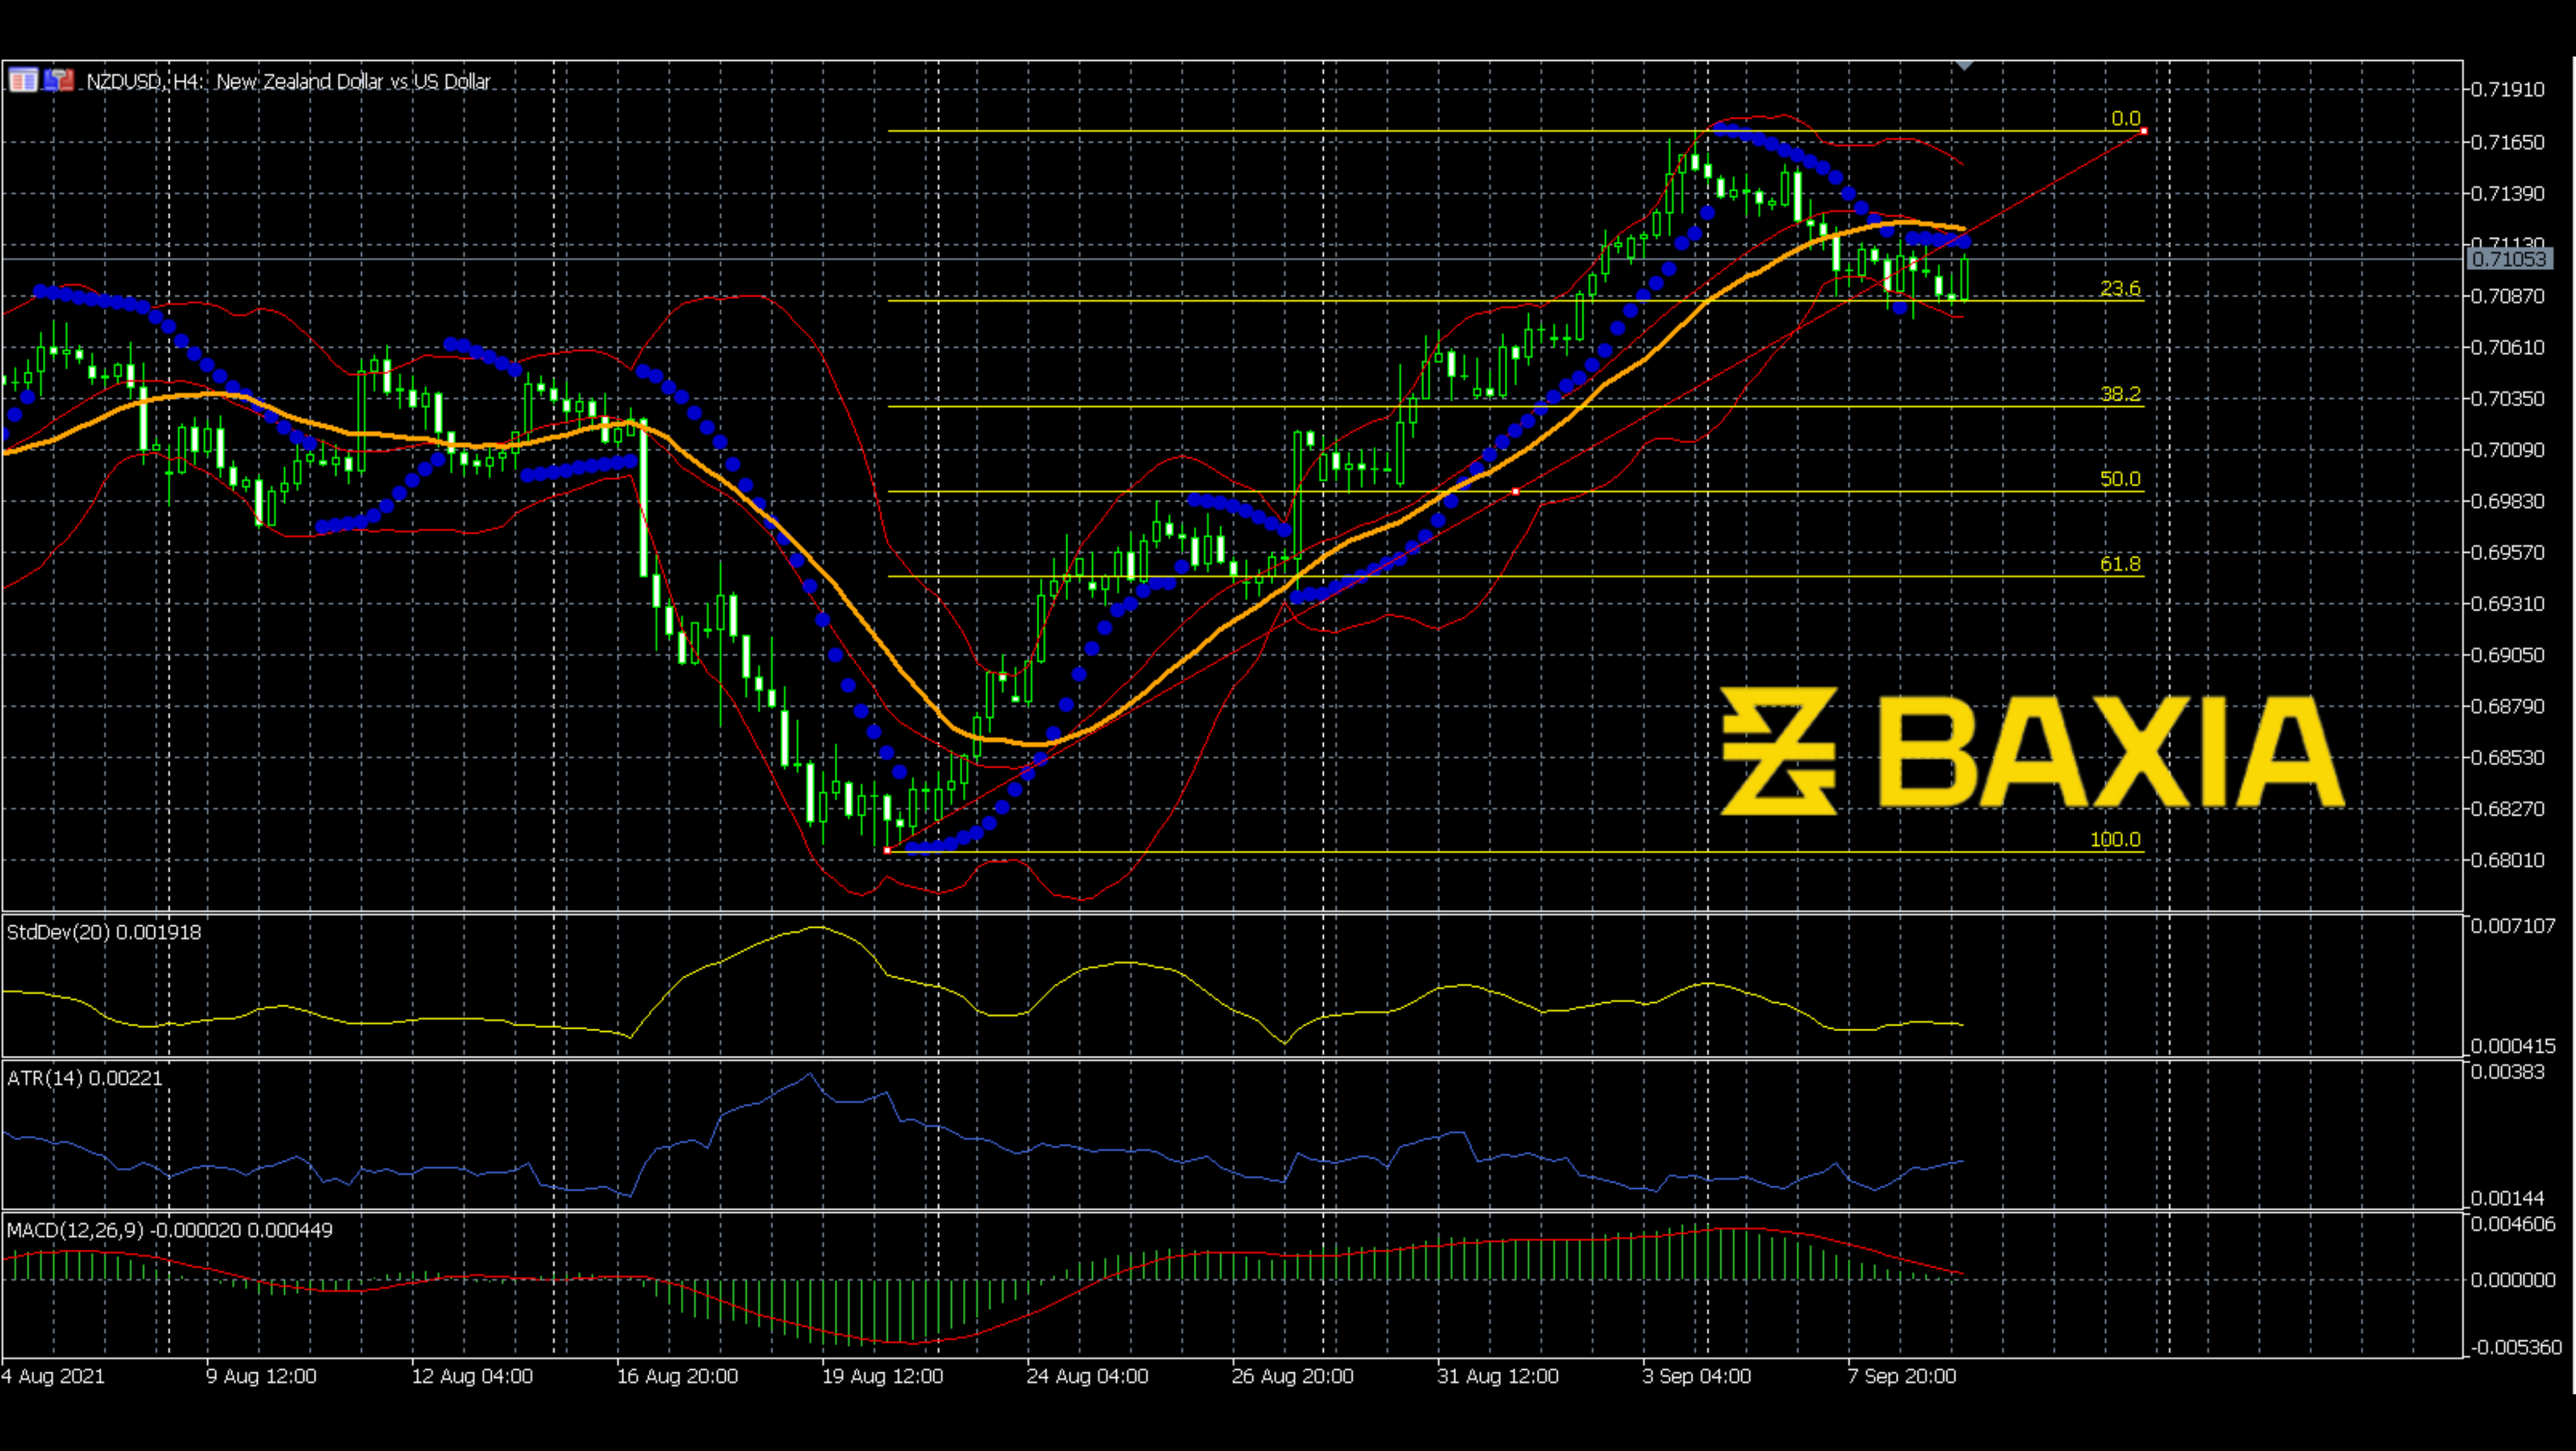

The previous downward trend was significant and influential. NZDUSD is down 5.4% in 17 days. From the daily chart, we can see that the downward trend is steeper than the earlier ones. And the price line was in a breakout for the whole downward trend. It tells us that the movement was influential. The price stopped at 0.692 recently and has bounced upwards for five days. What does this mean?
As can be seen, the 15 moving average (the blue line) is still below the 25 moving average (red line). The downward power still affects the price. In the big picture, the NZDUSD pair is still going down. The bounce of the price was based on the Bollinger Bands, which could only temporarily affect the price line. The lower Bollinger Band pushed the price to the middle. And we can see that the price already touched the middle line.
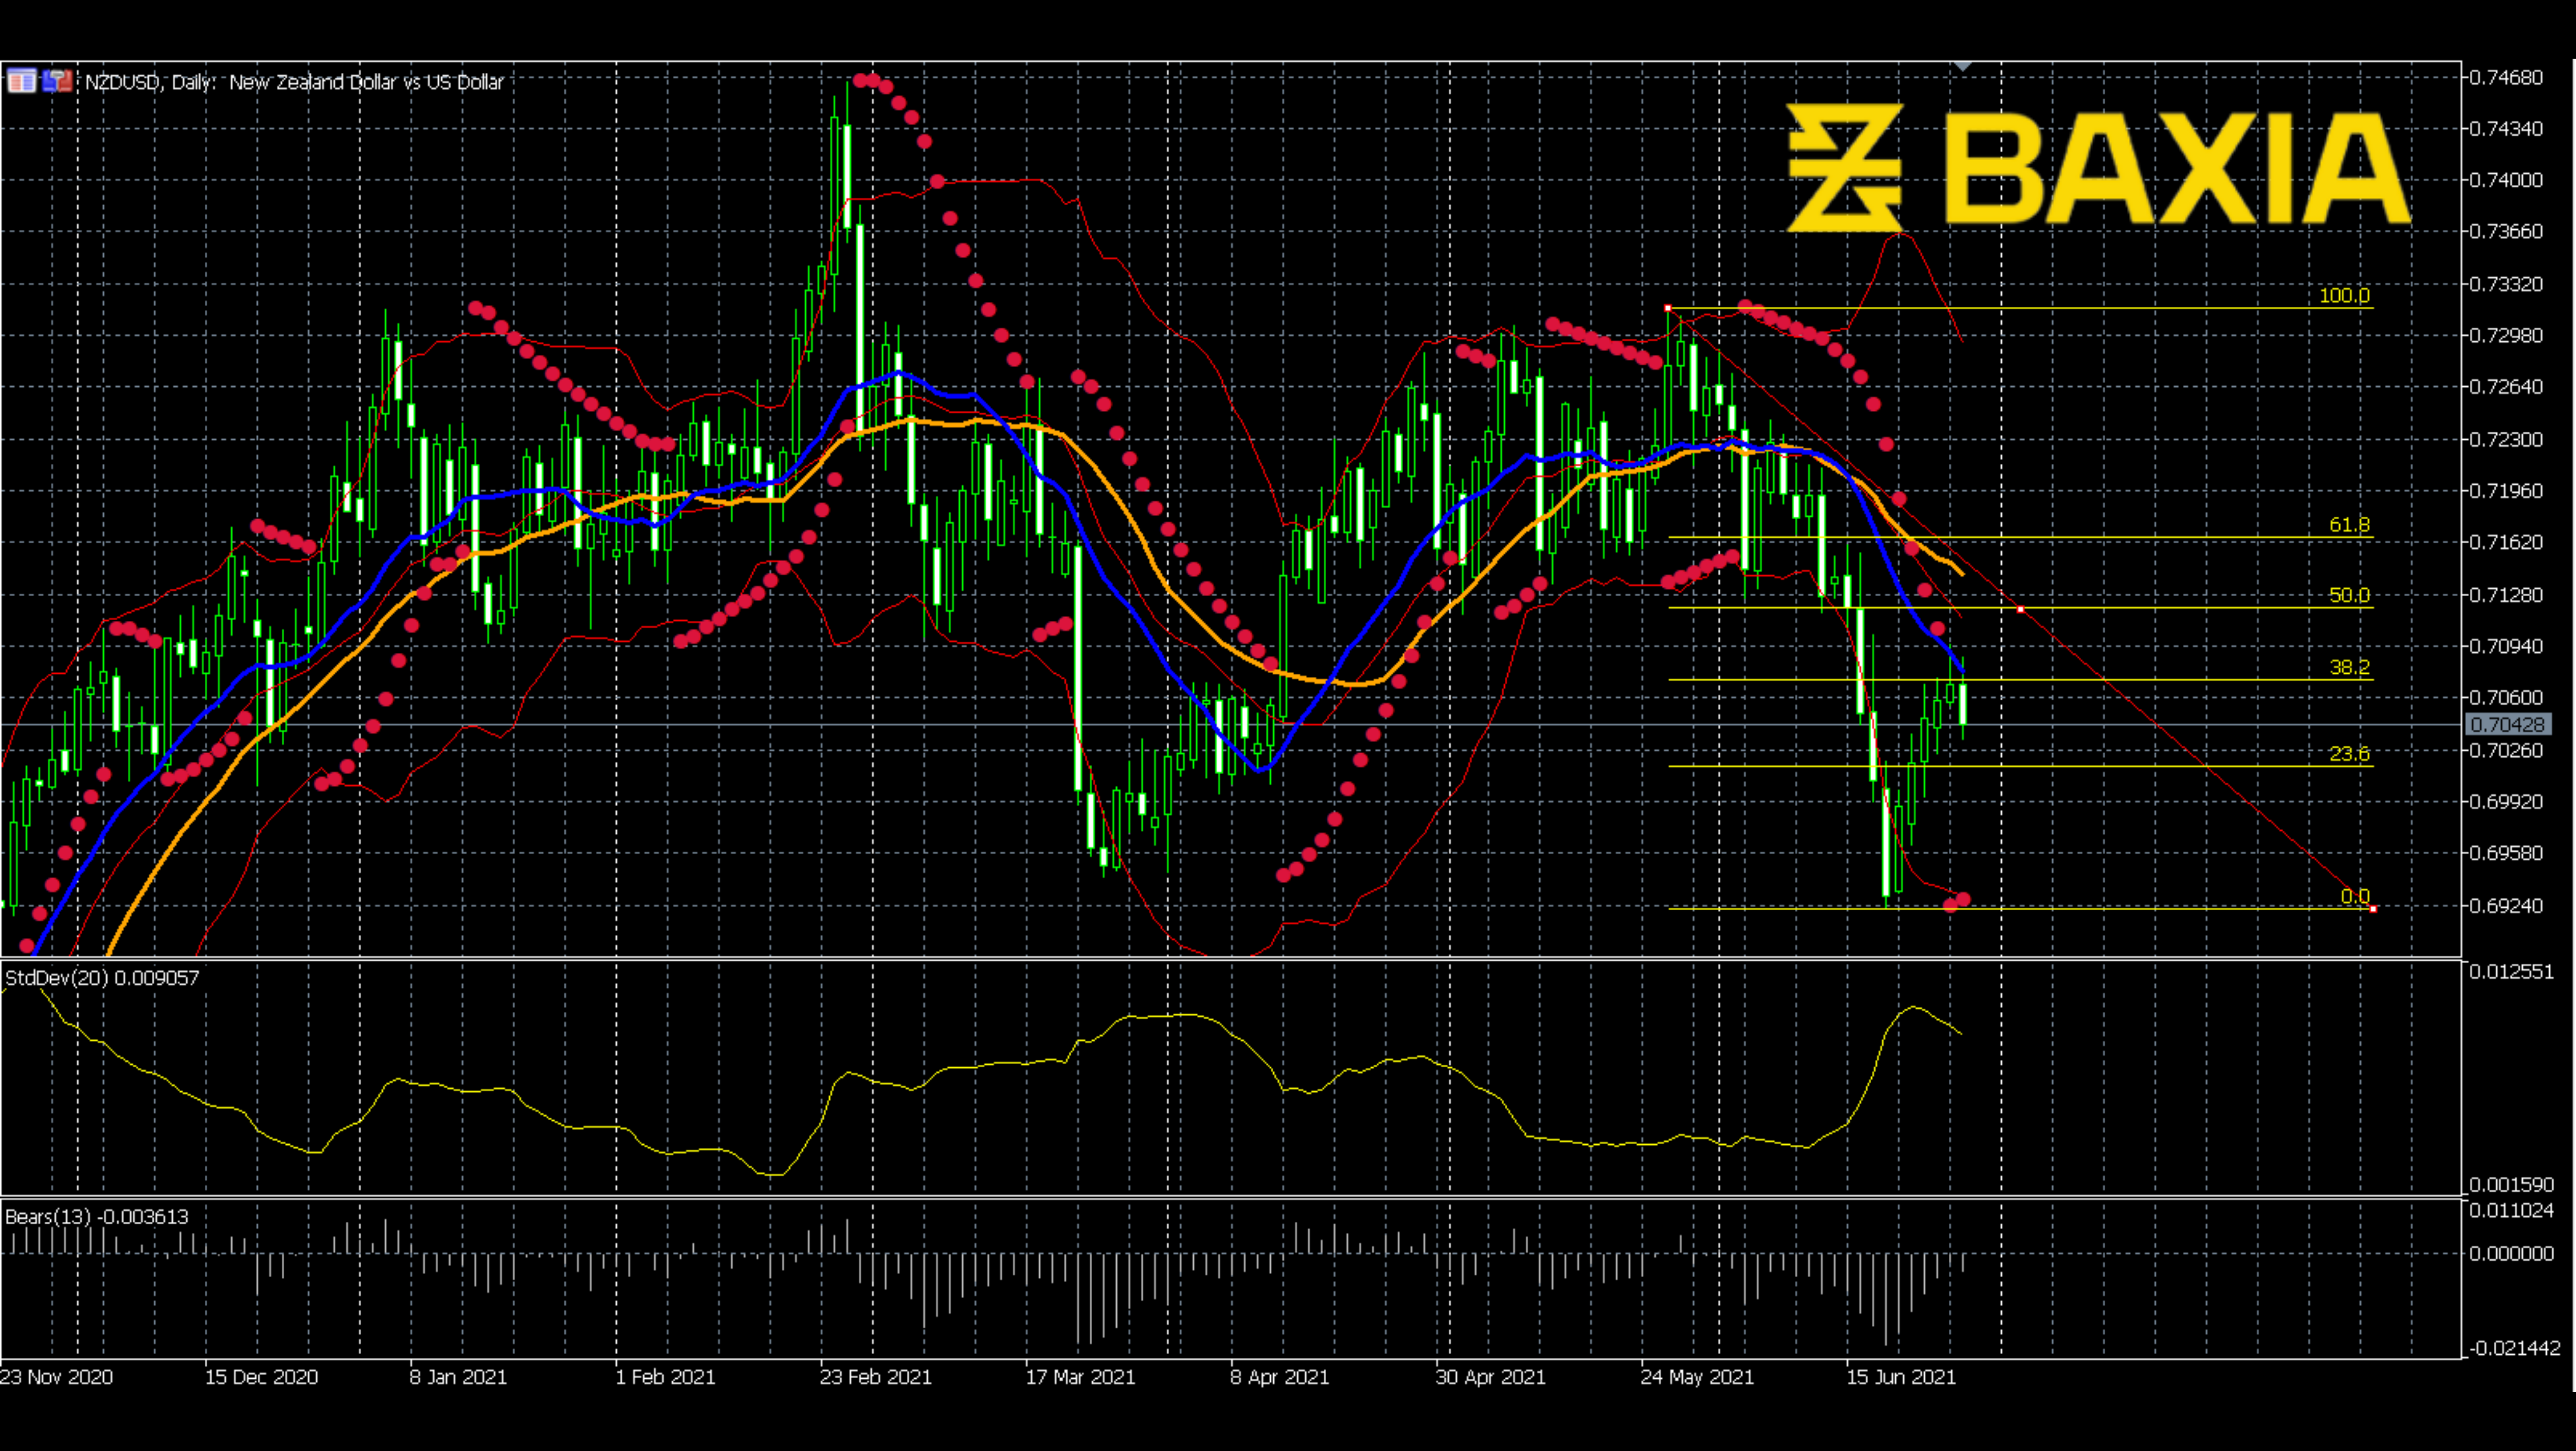
Bears power still shows the bearish signal; although the indicator is lagged, it reveals the current situation. The standard deviation is high, which means the fluctuation has not ended yet; the price could make a new wave. What are your thoughts?
We love to hear new ideas from traders and want to know what you think!
If you like this topic and want to suggest future topics that you find helpful, let us know by clicking the ‘submit your feedback’ button below.

Trading foreign exchange on margin carries a high level of risk, and may not be suitable for all investors. Before deciding to trade foreign exchange you should carefully consider your investment objectives, level of experience, and risk appetite.
Nothing contained in this website should be construed as investment advice. Any reference to an investment's past or potential performance is not, and should not be construed as, a recommendation or as a guarantee of any specific outcome or profit.