
Previously, the USDCHF had made some significant movements. The price made a 2.25% increase from June 16th to June 17th; This was a huge rising compared to other trends this year. Now, the price stopped rising and cooled down for 6 days. Although these 6 days did not make too much difference on the price, we still observe a slight downward trend. Will this trend continue?
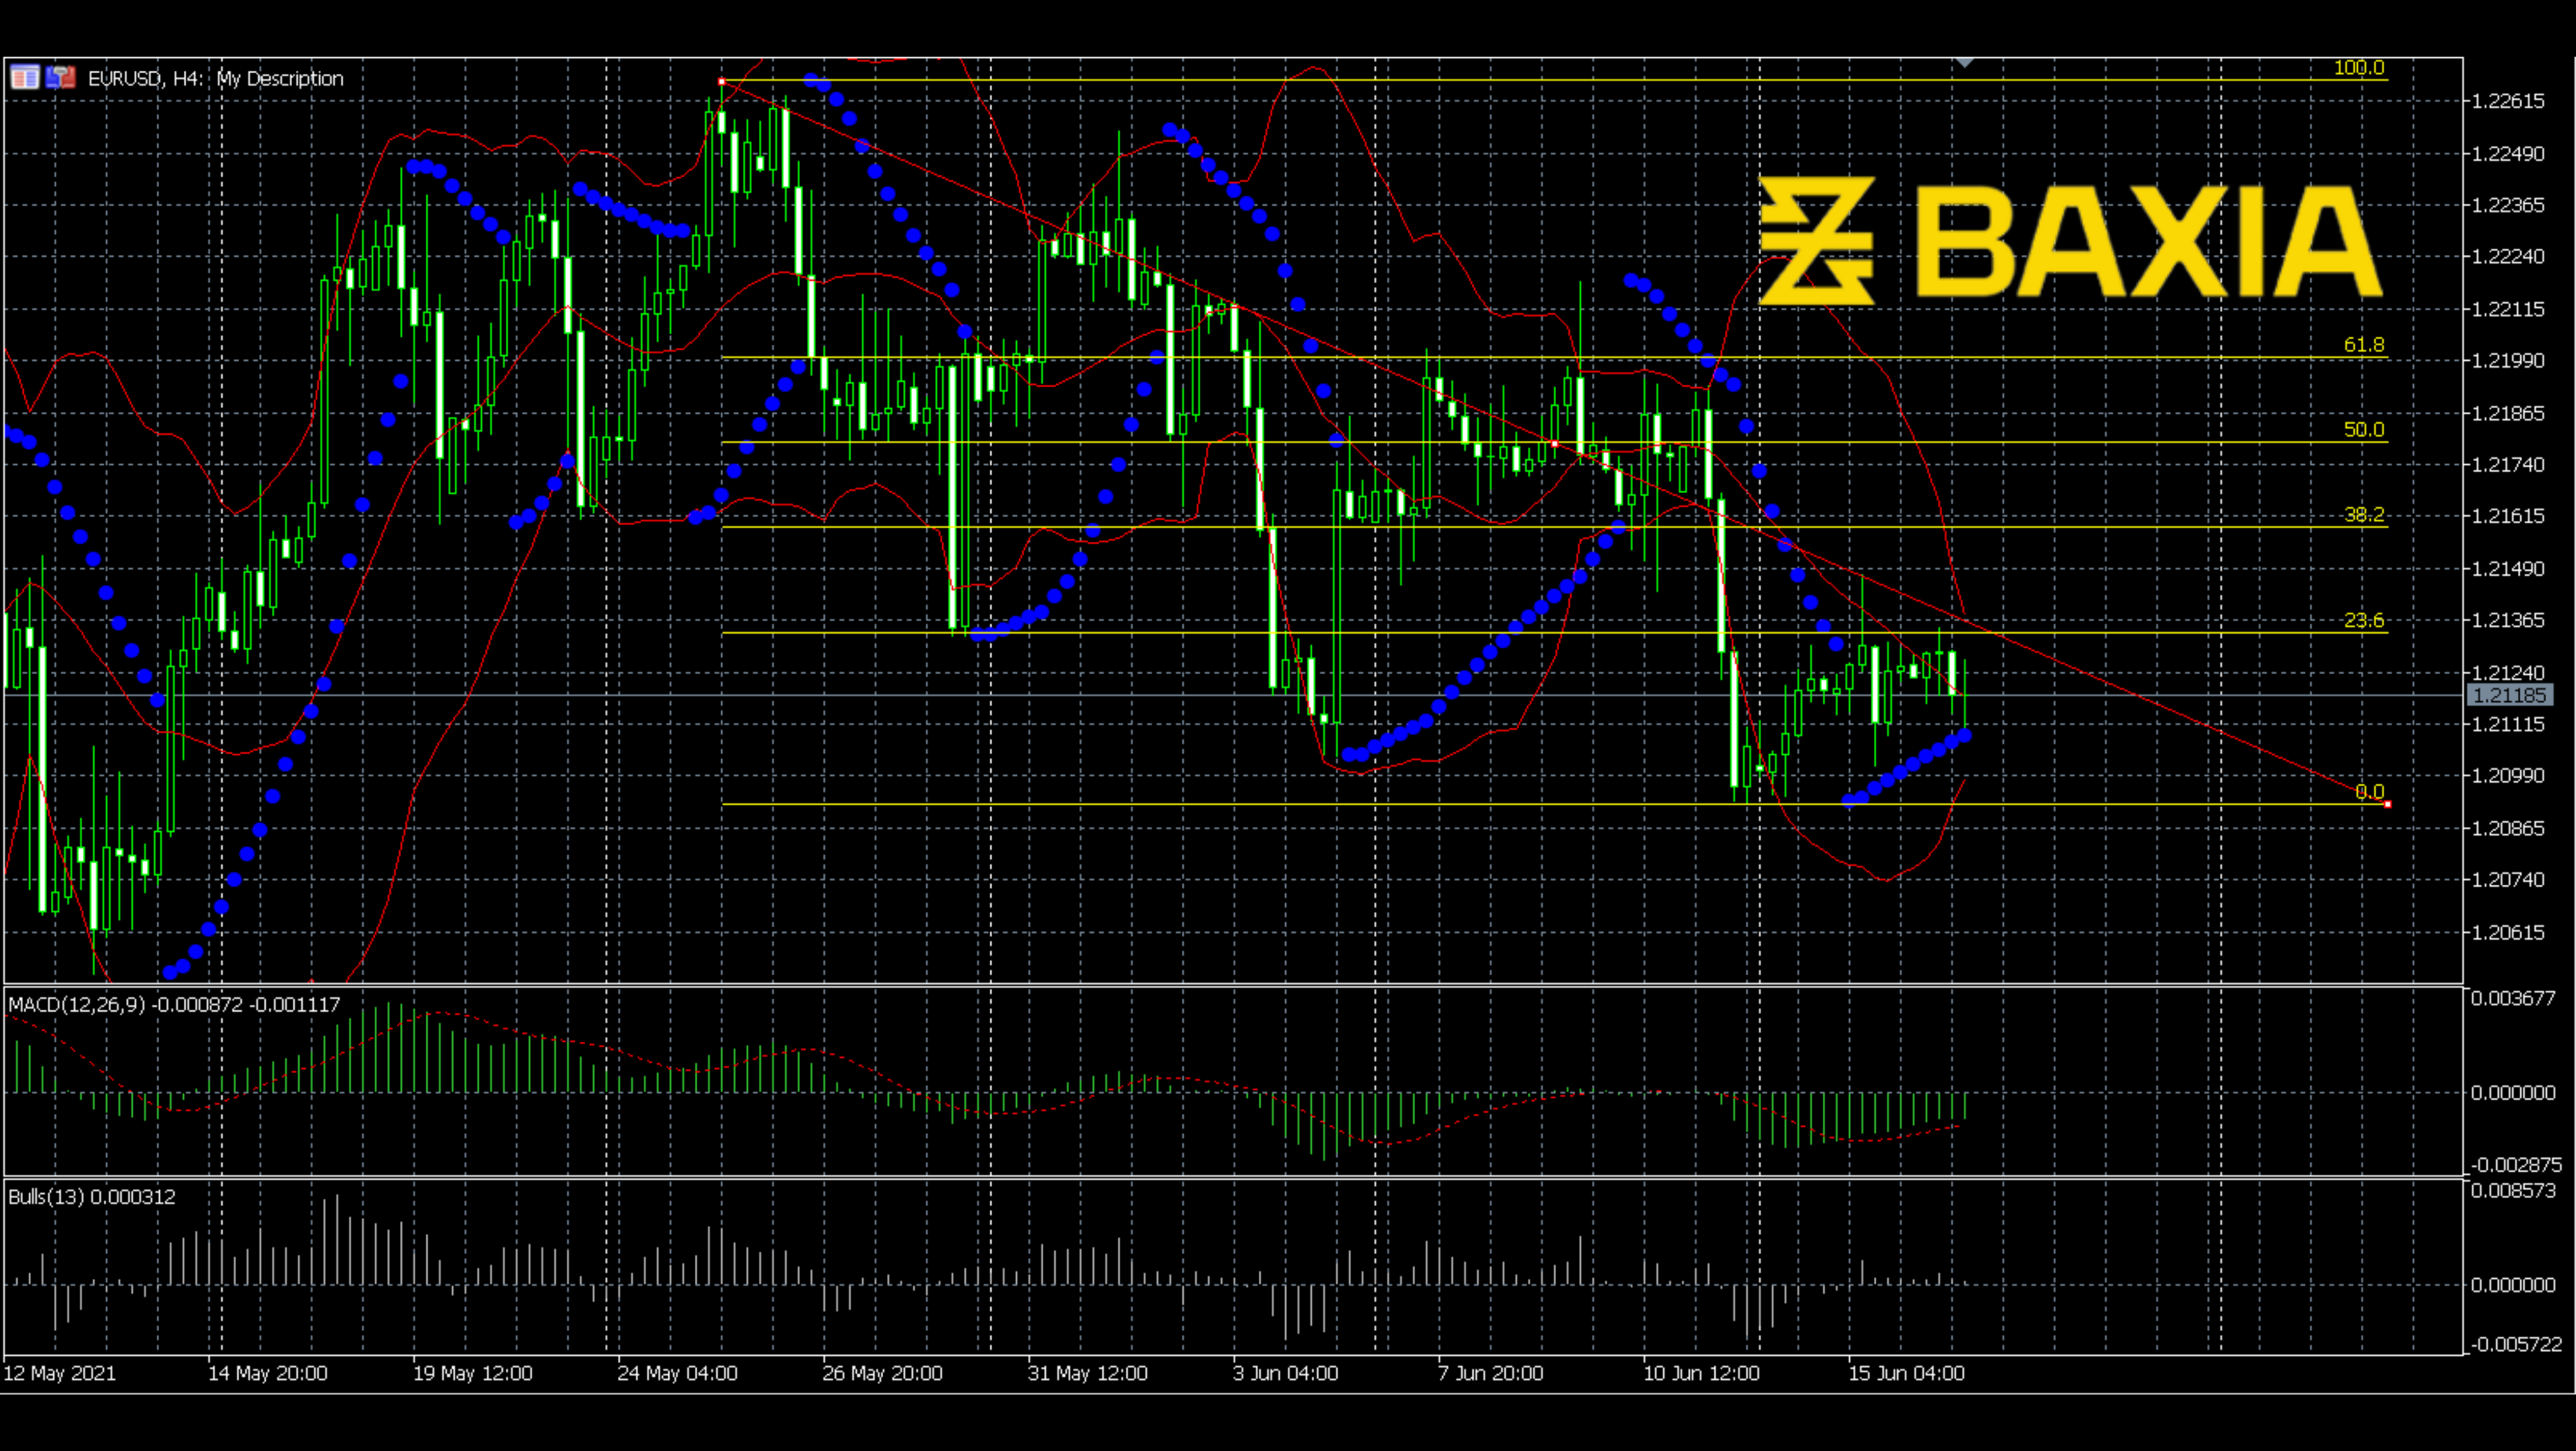
The price already touched the 38.2 level Fibonacci, which was not too low; however, it still could be a support point. And the price now started hovering around 23.6 level Fibonacci. The blue line is the moving average 15, and the red line is the moving average 25. From these two lines we can see they twist together, which becomes more confusing for us to find a clear trend.
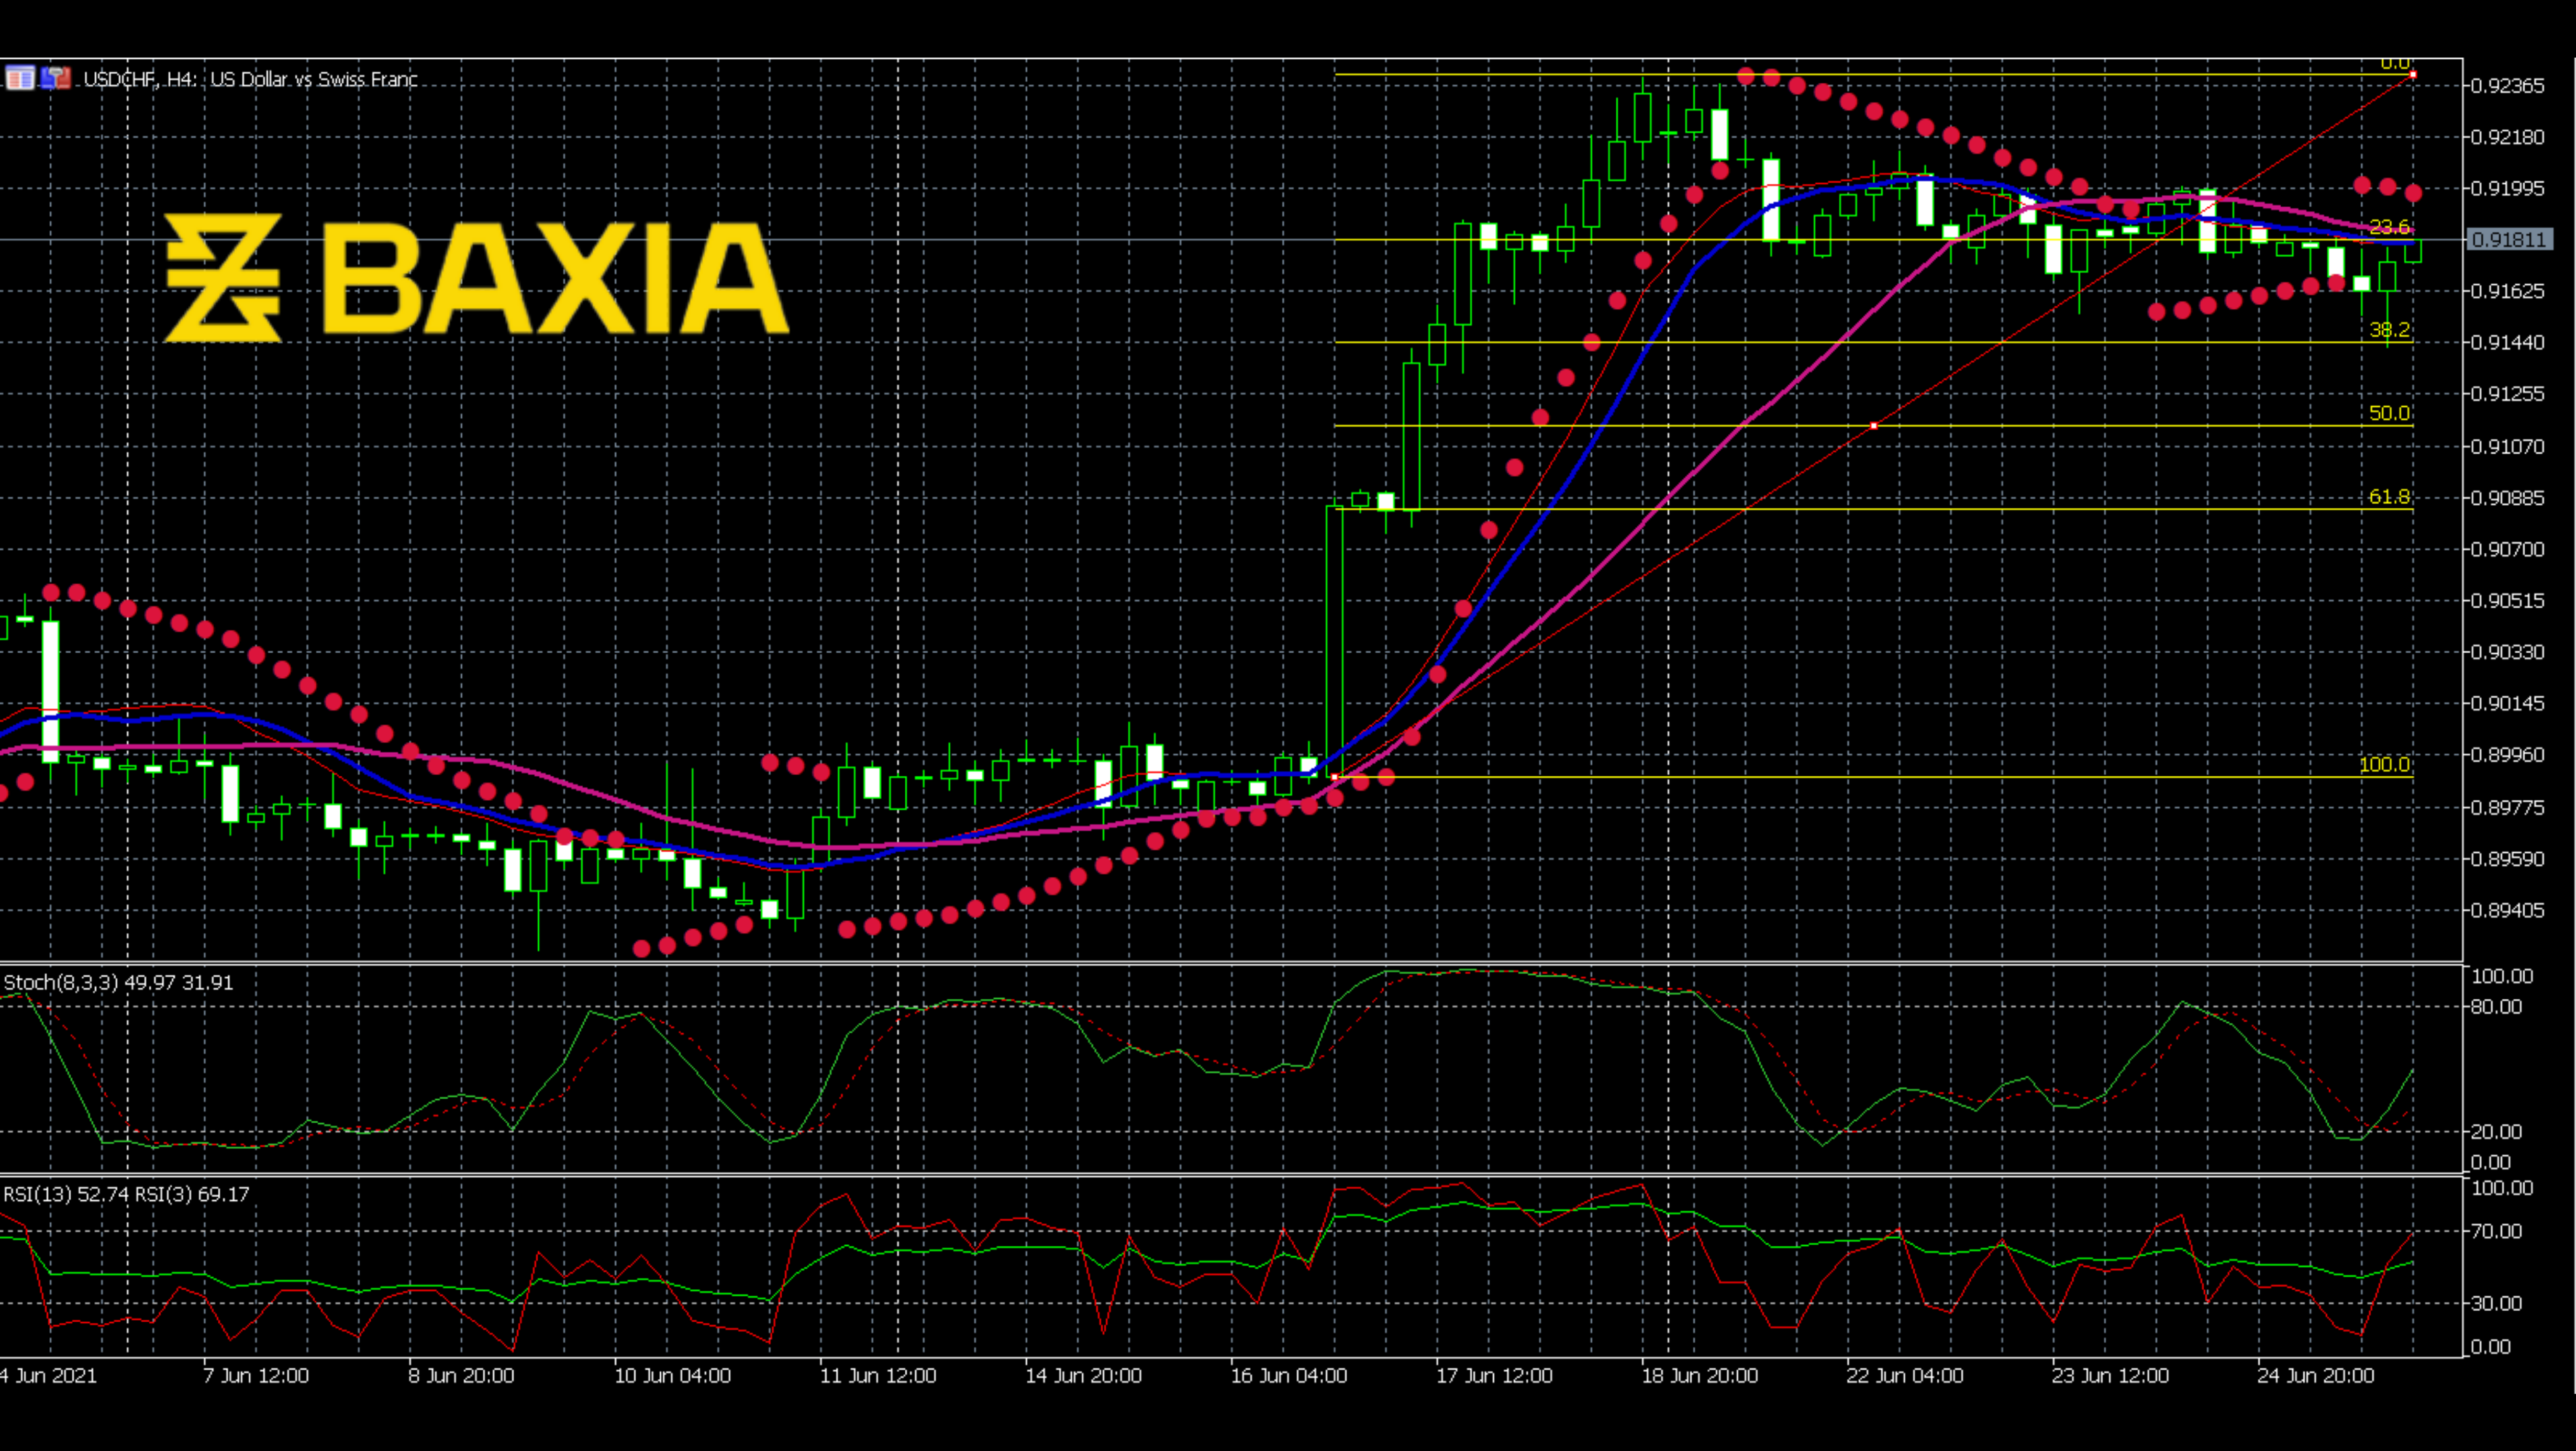
The recent SAR trend looks flatter than the previous; it does not show too many signals. Stochastics just bounced back to the average area, the oversold situation calmed down.
Although the downward trend is slight, the price has not reached the high-pressure support line yet. Let's wait until the price meets the 50% level Fibonacci.
We love to hear new ideas from traders and want to know what you think!
If you like this topic and want to suggest future topics that you find helpful, let us know by clicking the ‘submit your feedback’ button below.

Trading foreign exchange on margin carries a high level of risk, and may not be suitable for all investors. Before deciding to trade foreign exchange you should carefully consider your investment objectives, level of experience, and risk appetite.
Nothing contained in this website should be construed as investment advice. Any reference to an investment's past or potential performance is not, and should not be construed as, a recommendation or as a guarantee of any specific outcome or profit.