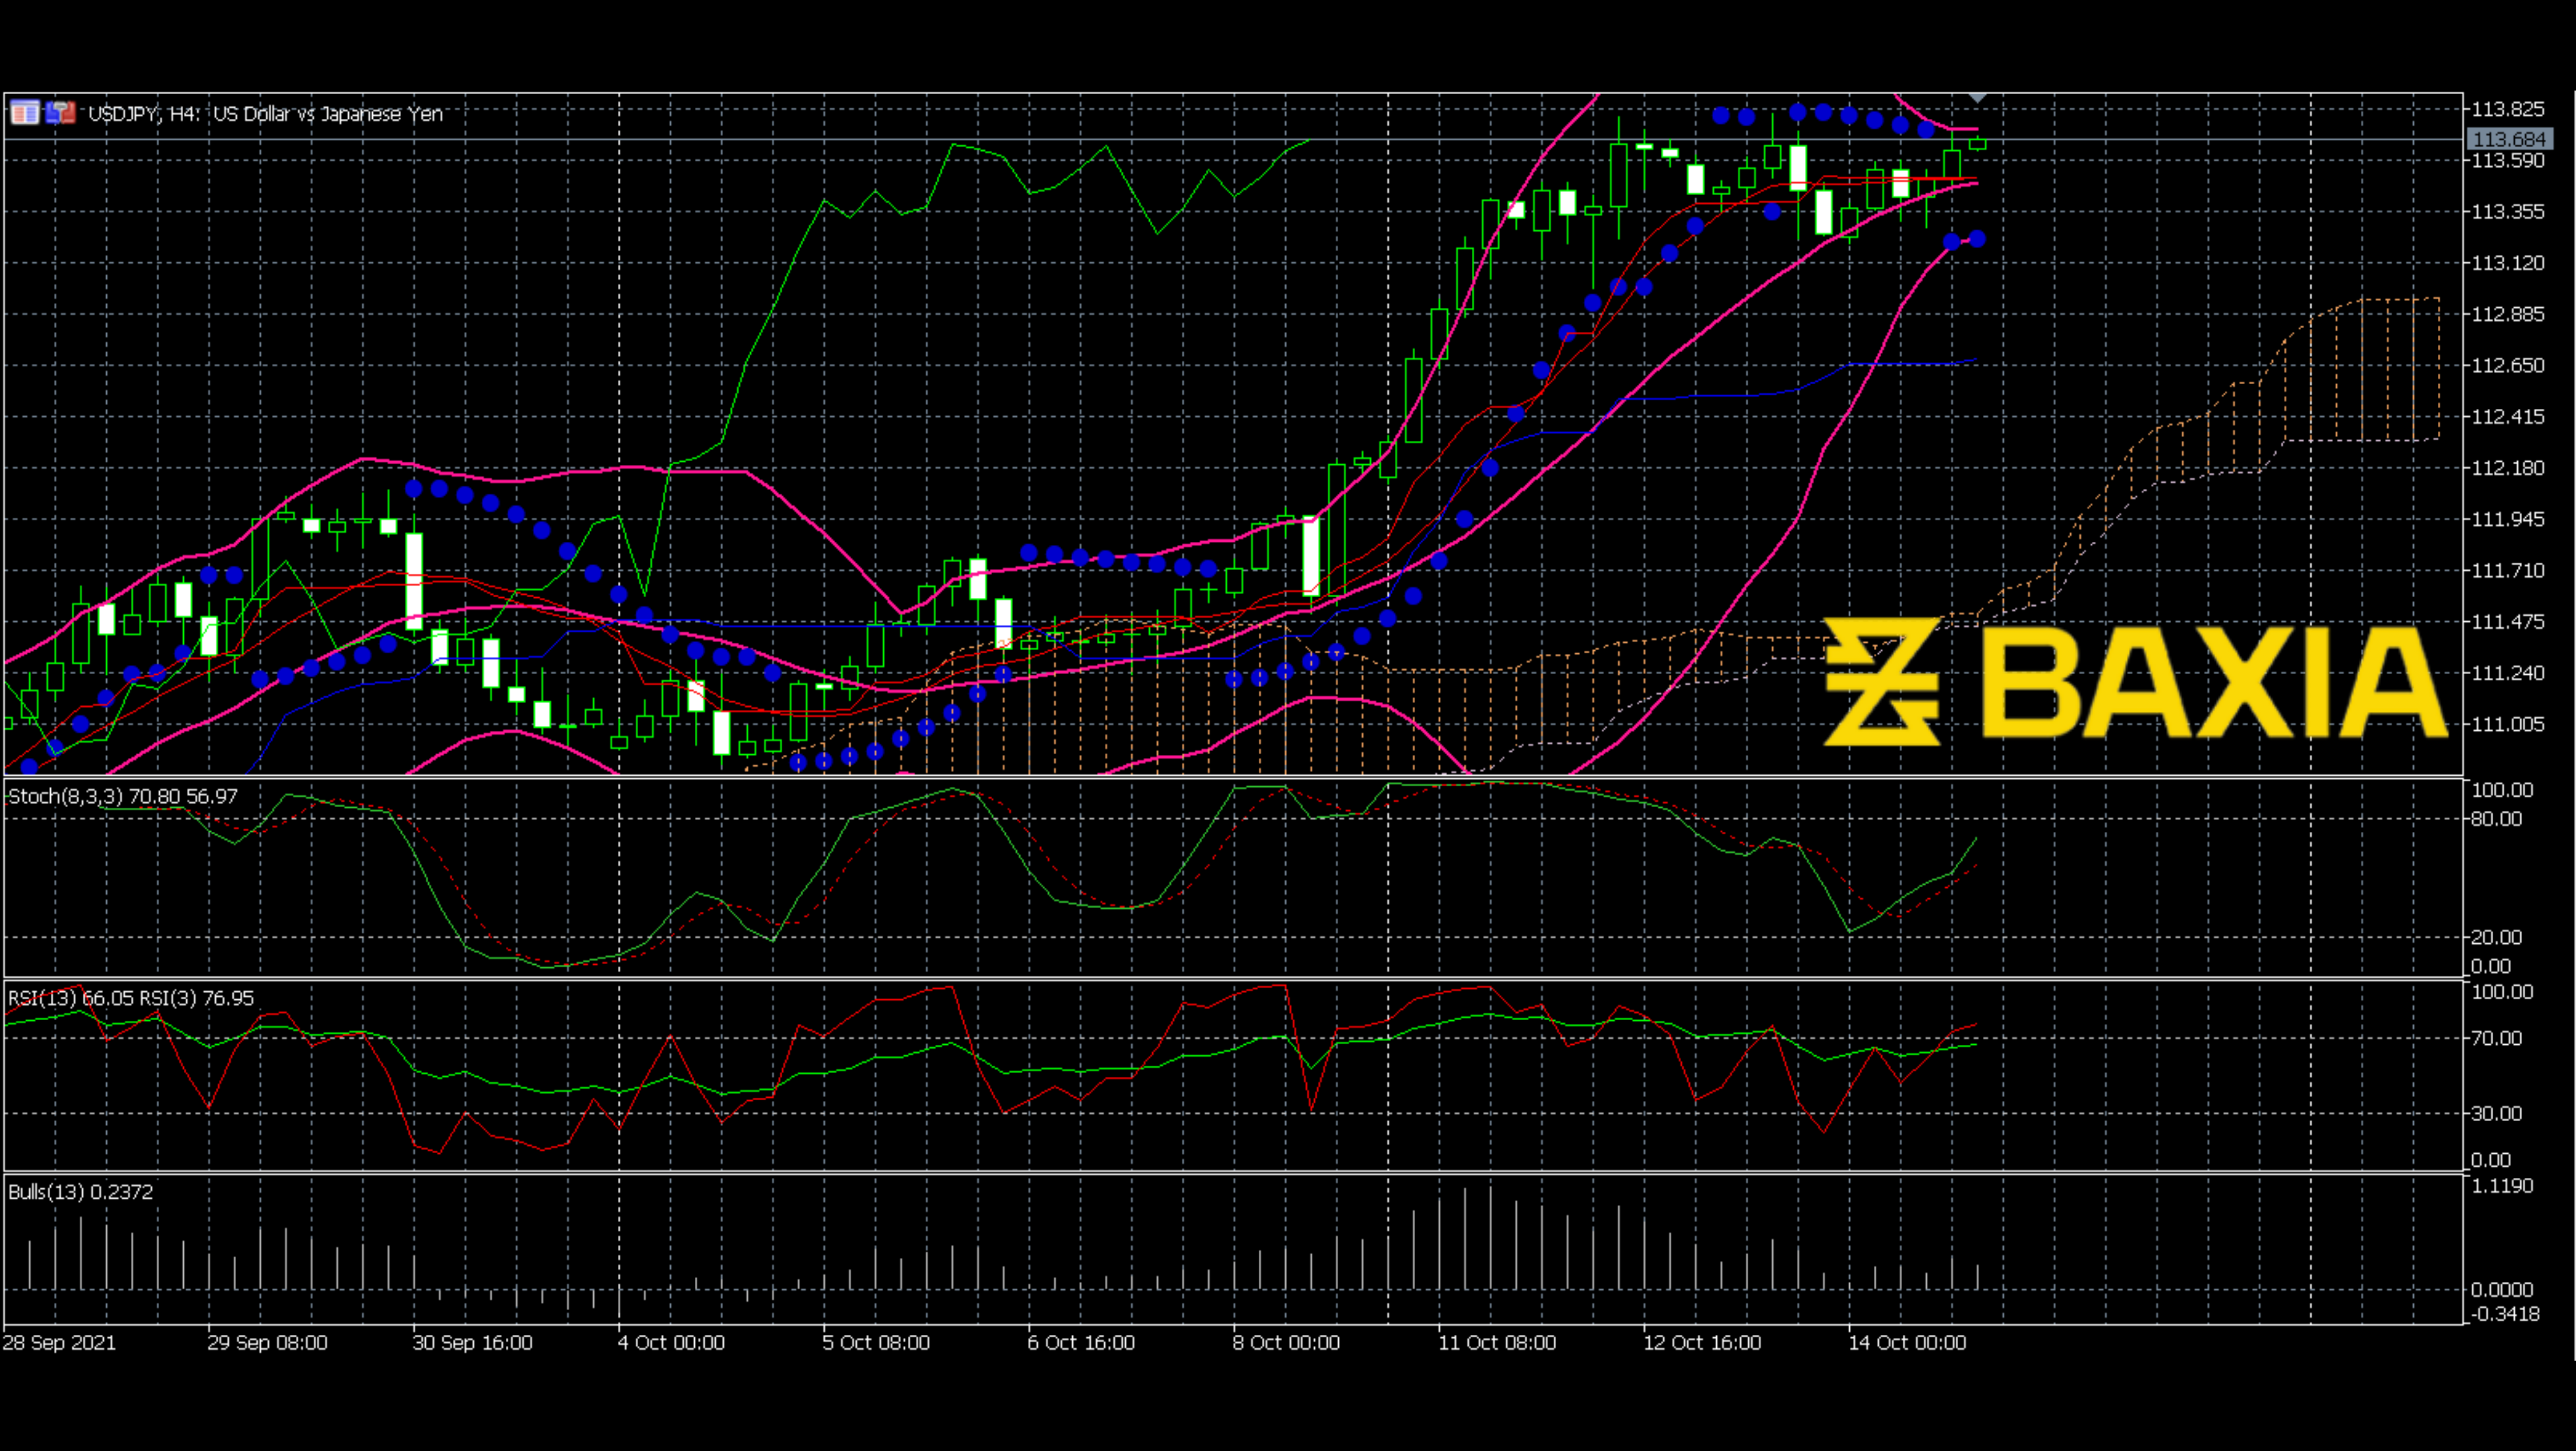

As can be seen from the 4-hour chart, the price went up rapidly after the ascending triangle. The ascending triangle is known as the bullish signal. The price did not let us down; it has grown fast after the triangle. Although the upward trend seems solid and strong, the price may not keep continue moving up in the future. Some resistance may show up.
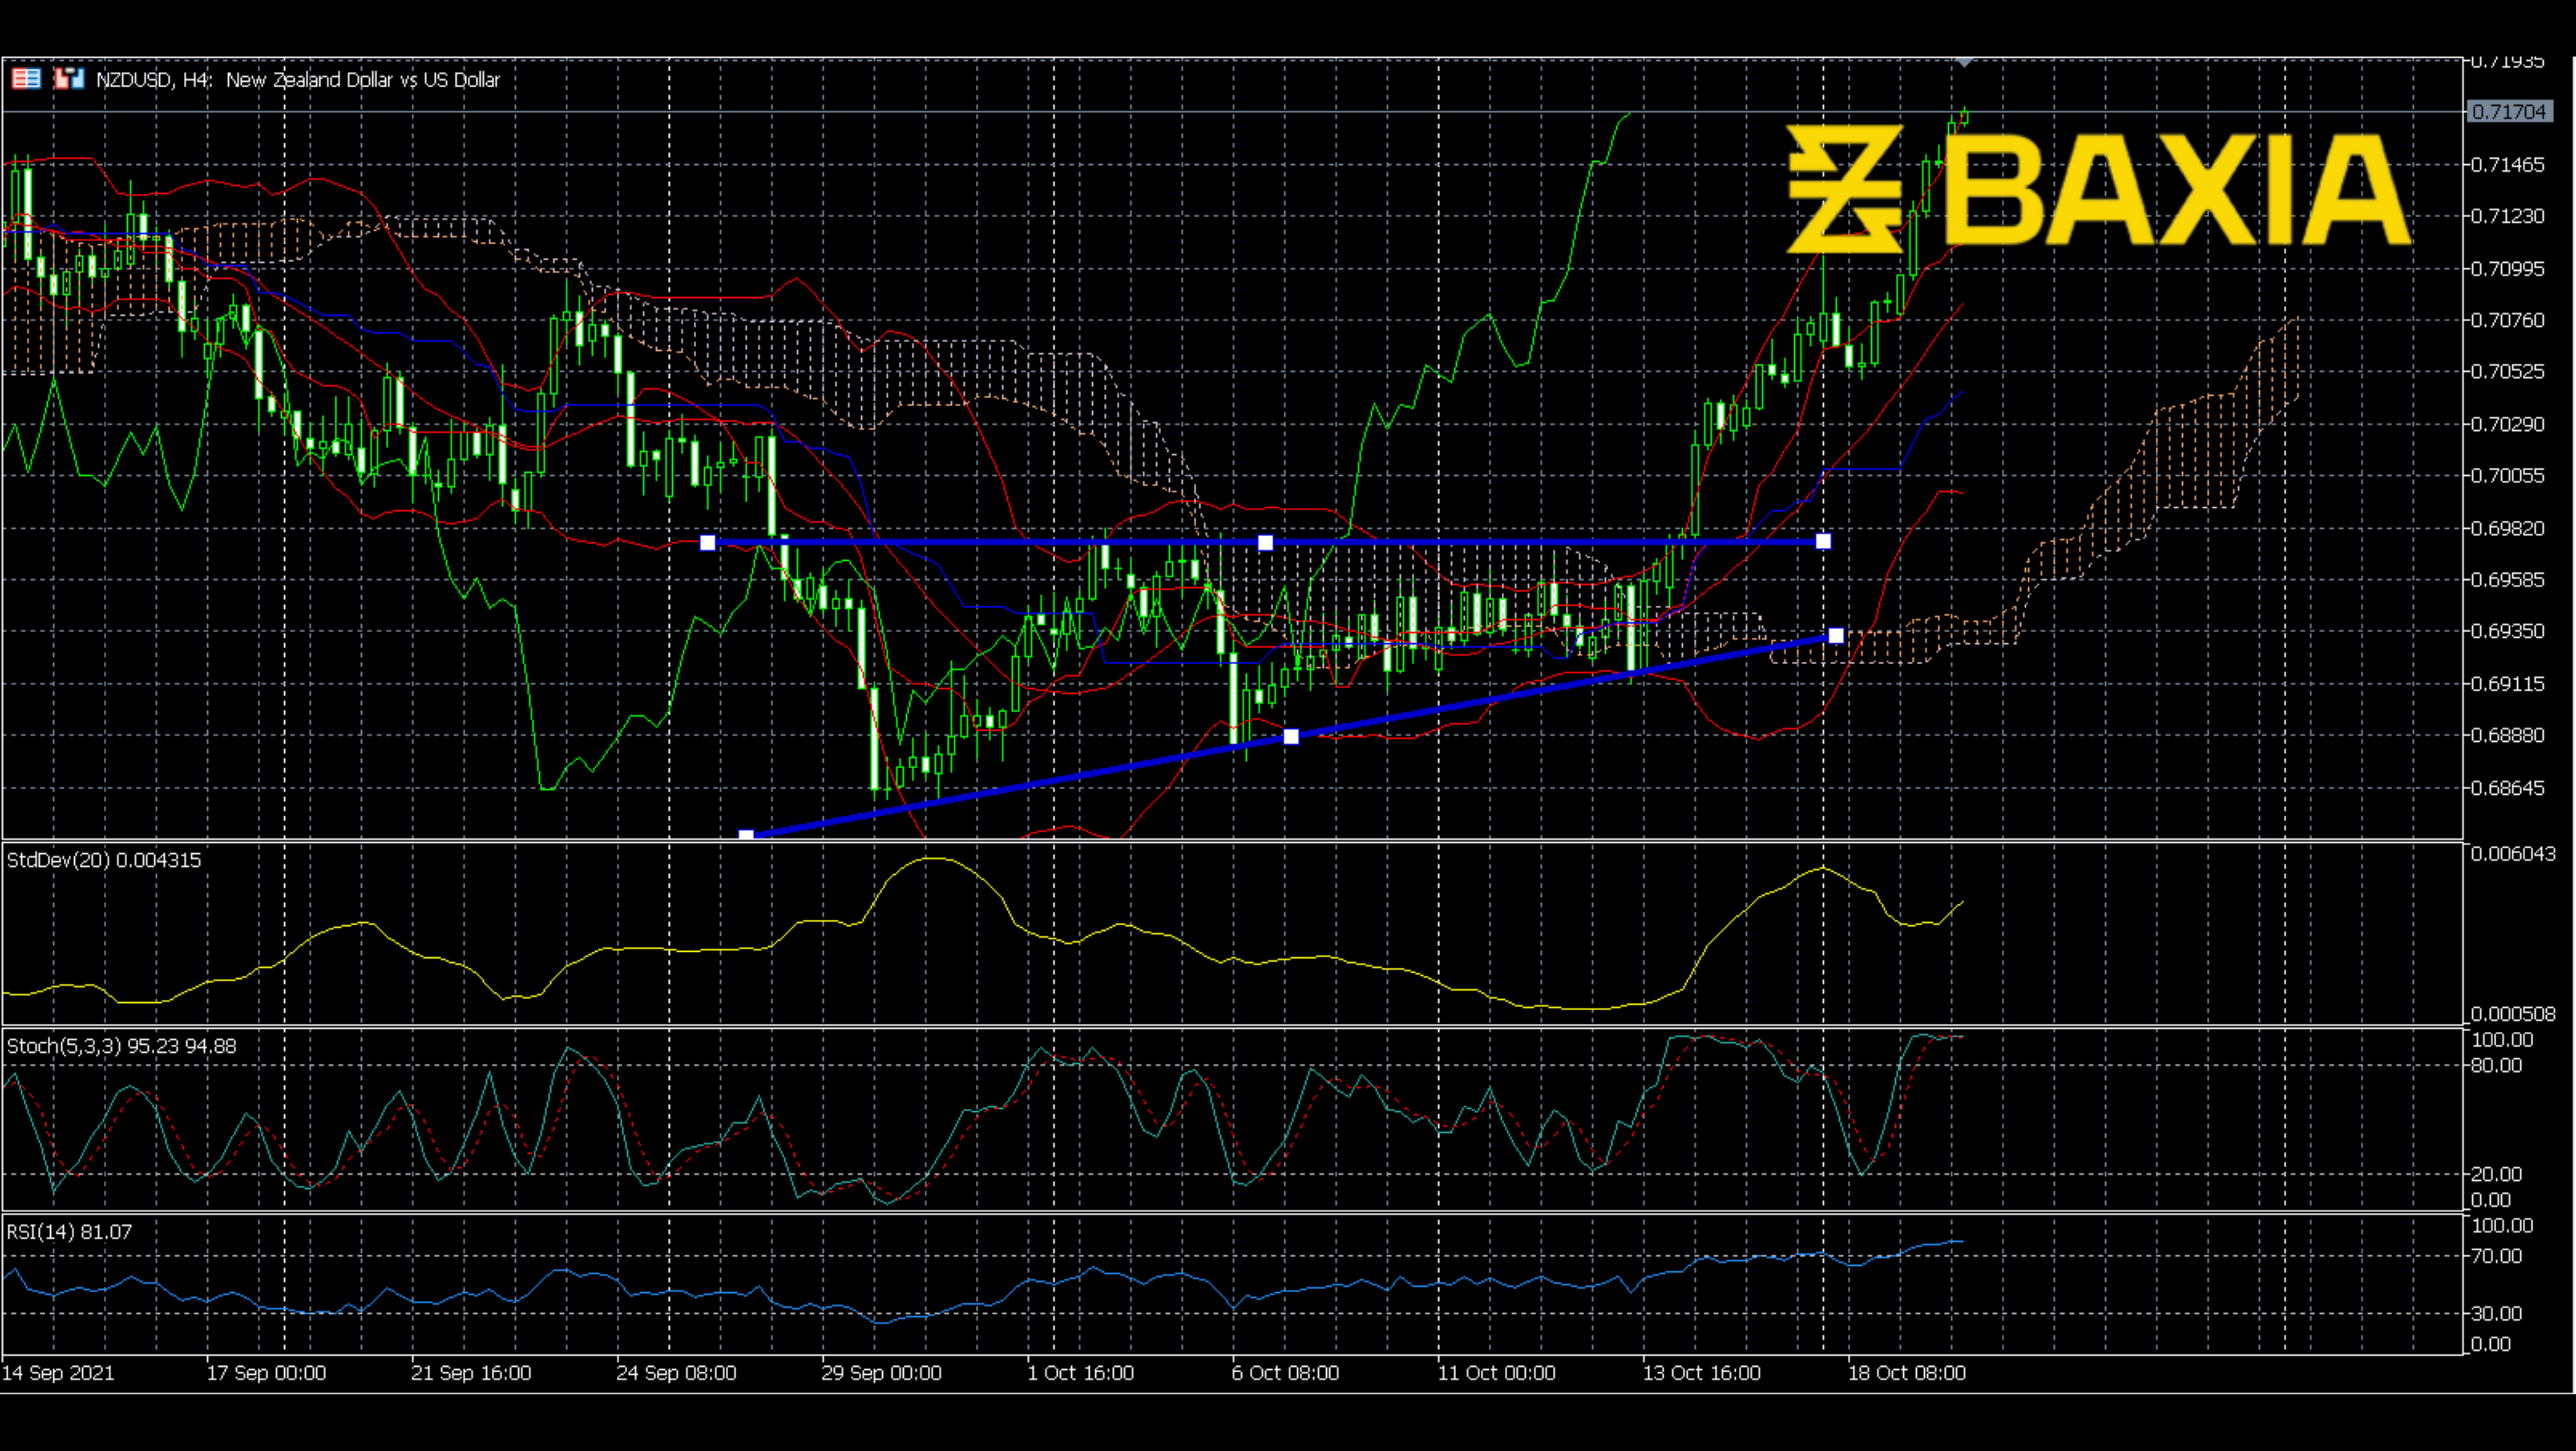
The Bollinger Bands shrunk when the price broke out of the triangle, which was a bullish signal. The upward trend has lasted six days. Although we have not seen any significant resistance yet, Stochastics and RSI went to the overbought area. As we all know, the overbought situation is very unstable. Also, we can see that the price moves in the upper area of the Bollinger Bands; the upper band may push the price back to the bands.
We love to hear new ideas from traders and want to know what you think!
If you like this topic and want to suggest future topics that you find helpful, let us know by clicking the ‘submit your feedback’ button below.

Trading foreign exchange on margin carries a high level of risk, and may not be suitable for all investors. Before deciding to trade foreign exchange you should carefully consider your investment objectives, level of experience, and risk appetite.
Nothing contained in this website should be construed as investment advice. Any reference to an investment's past or potential performance is not, and should not be construed as, a recommendation or as a guarantee of any specific outcome or profit.