
The upward trend had lasted about ten days since Oct 4th. The price moved in a stable and mild slope; however, the price turned to move more steeply since Oct 8th. Although the steeper slope pushed the price to move to 113.518; however, the price soon met resistance at this level.
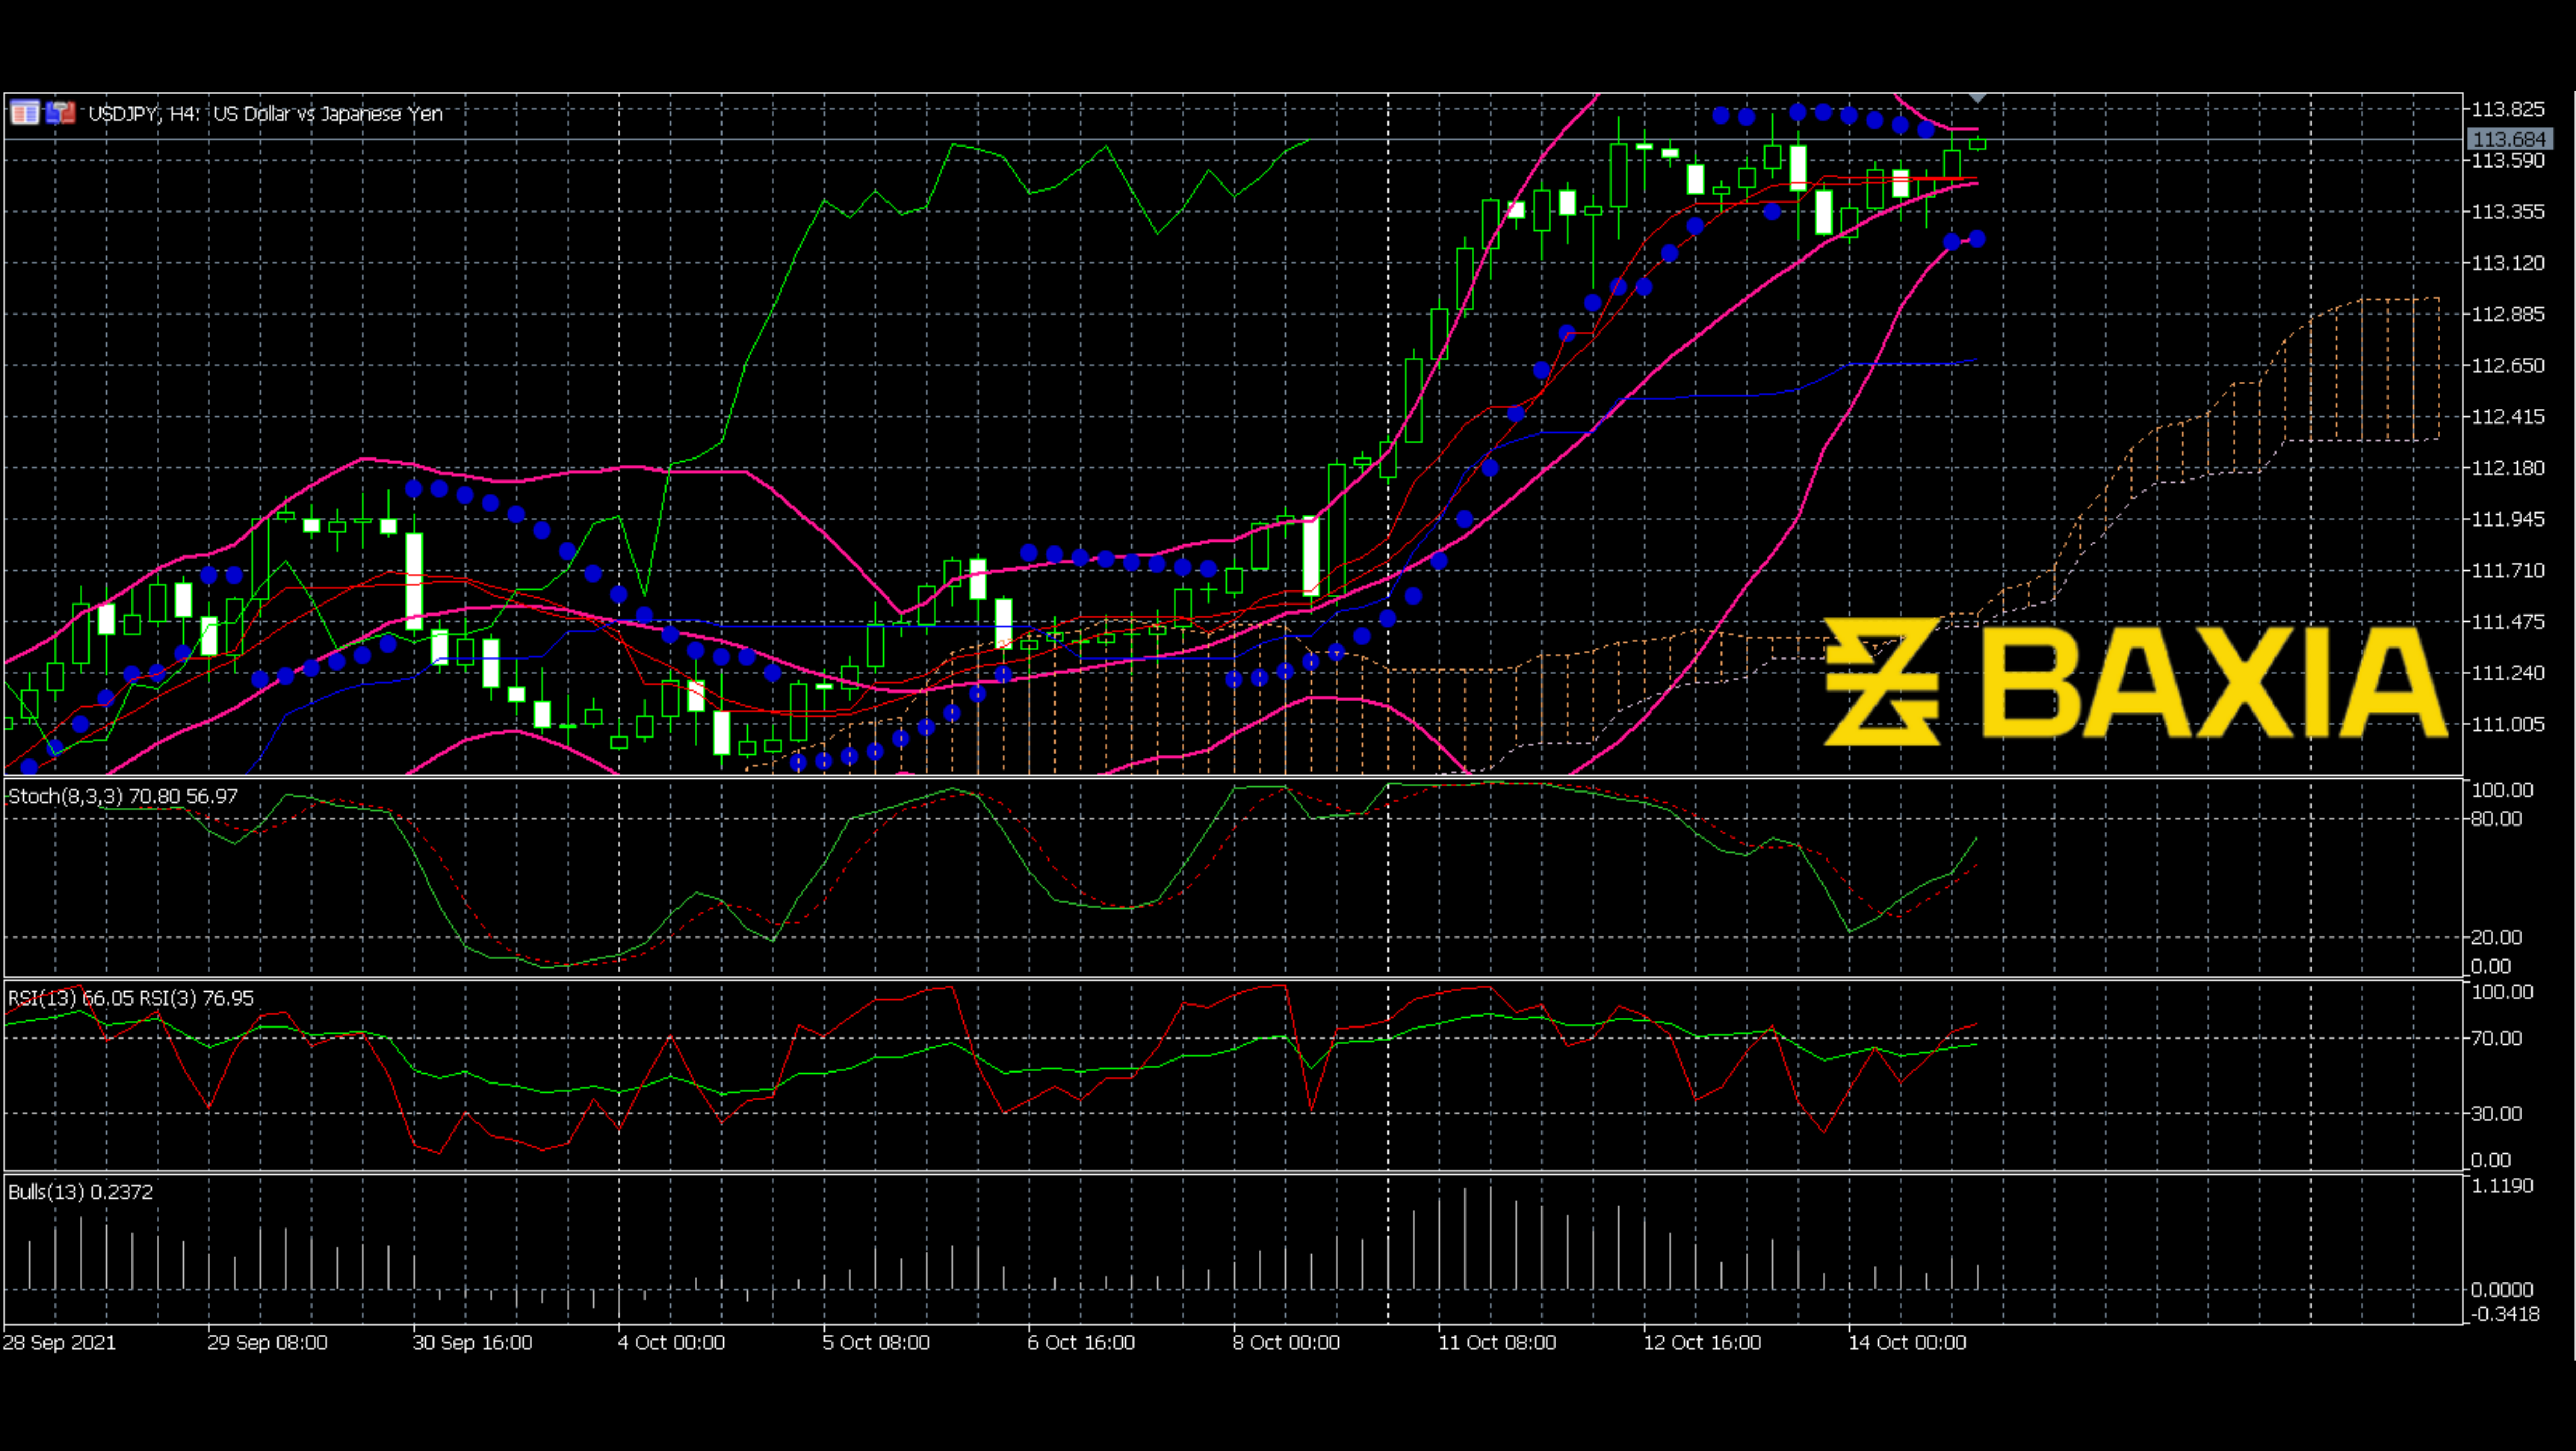
As can be seen, the price stopped surging at 113.650. At this point, the Bollinger Bands shrunk, which means the price may break out; however, we do not know the breakout direction. Stochastics recently moved up to a high level; it almost touched the overbought level. The RSI already entered into the overbought area. As we know, overbought is a dangerous condition. The Ichimoku cloud stopped moving up. And the Bull’s power also moved down to the zero level. So we now have some clues about the breakout direction.
We love to hear new ideas from traders and want to know what you think!
If you like this topic and want to suggest future topics that you find helpful, let us know by clicking the ‘submit your feedback’ button below.

Trading foreign exchange on margin carries a high level of risk, and may not be suitable for all investors. Before deciding to trade foreign exchange you should carefully consider your investment objectives, level of experience, and risk appetite.
Nothing contained in this website should be construed as investment advice. Any reference to an investment's past or potential performance is not, and should not be construed as, a recommendation or as a guarantee of any specific outcome or profit.