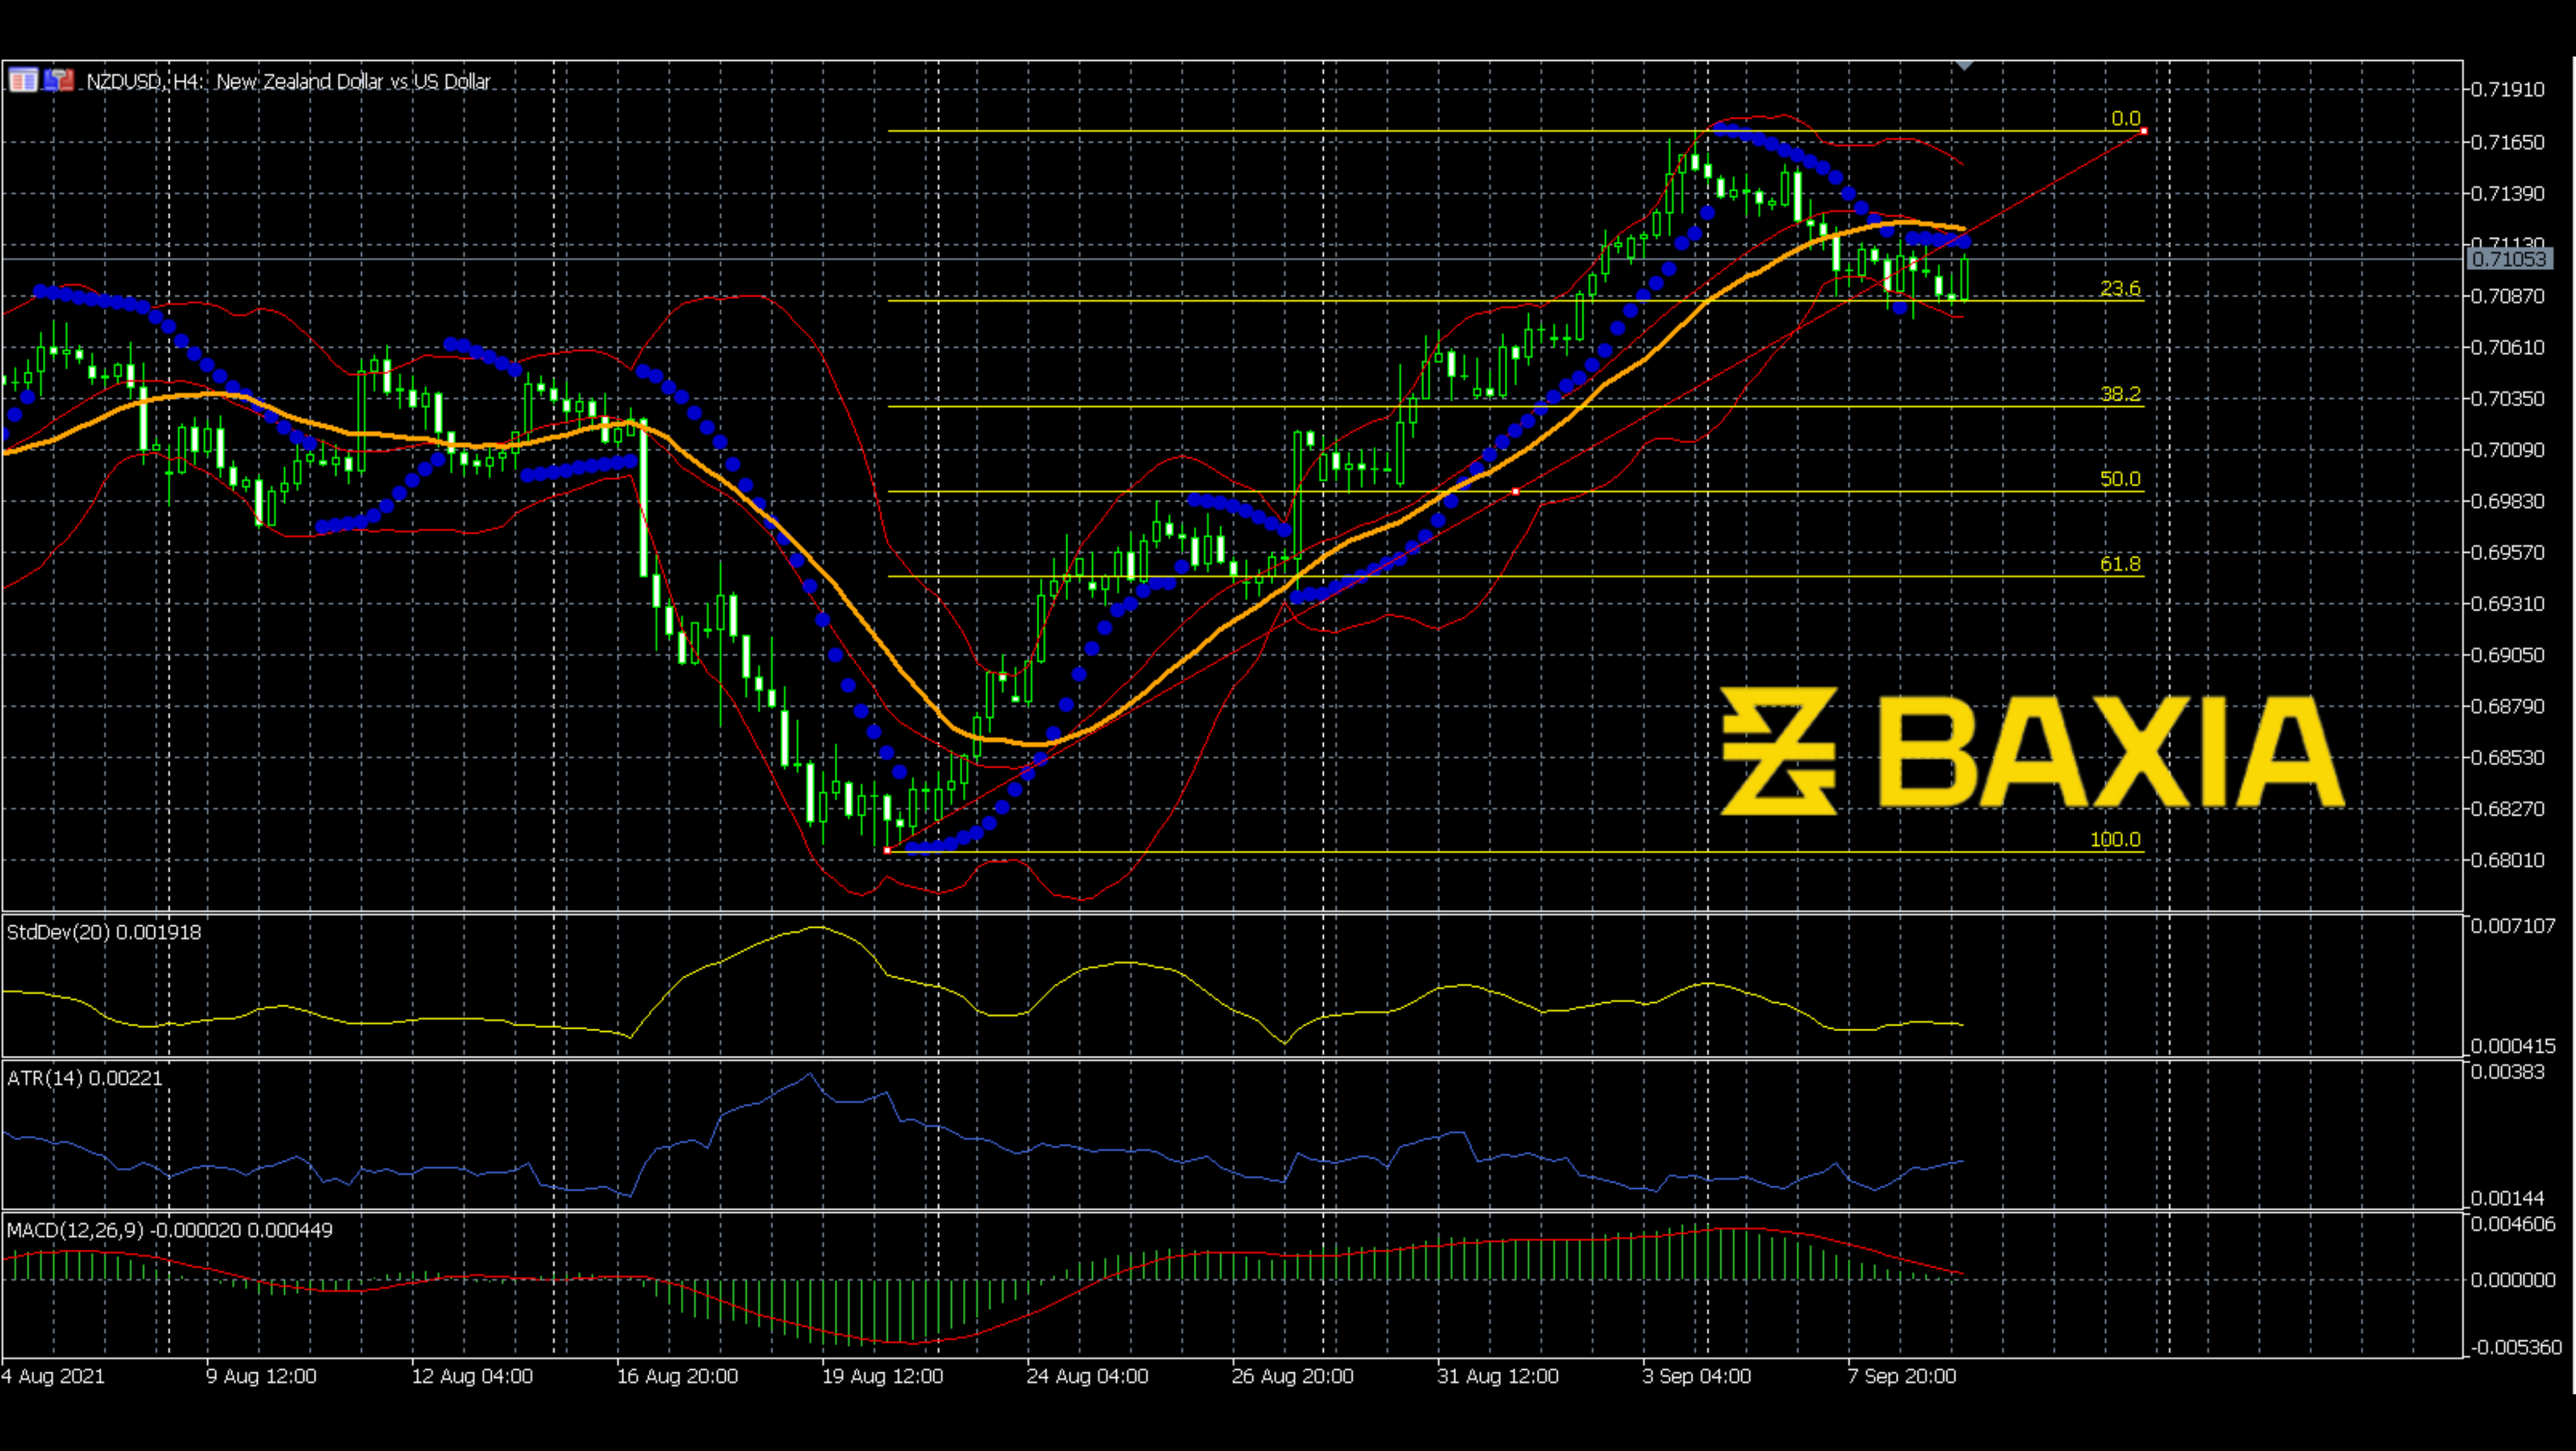

The price has been making waves for five months. For a long time, we cannot catch a long-term trend on NZDUSD. However, the waves ranging down recently. The waves are getting closer and shorter than before. What is going on here?
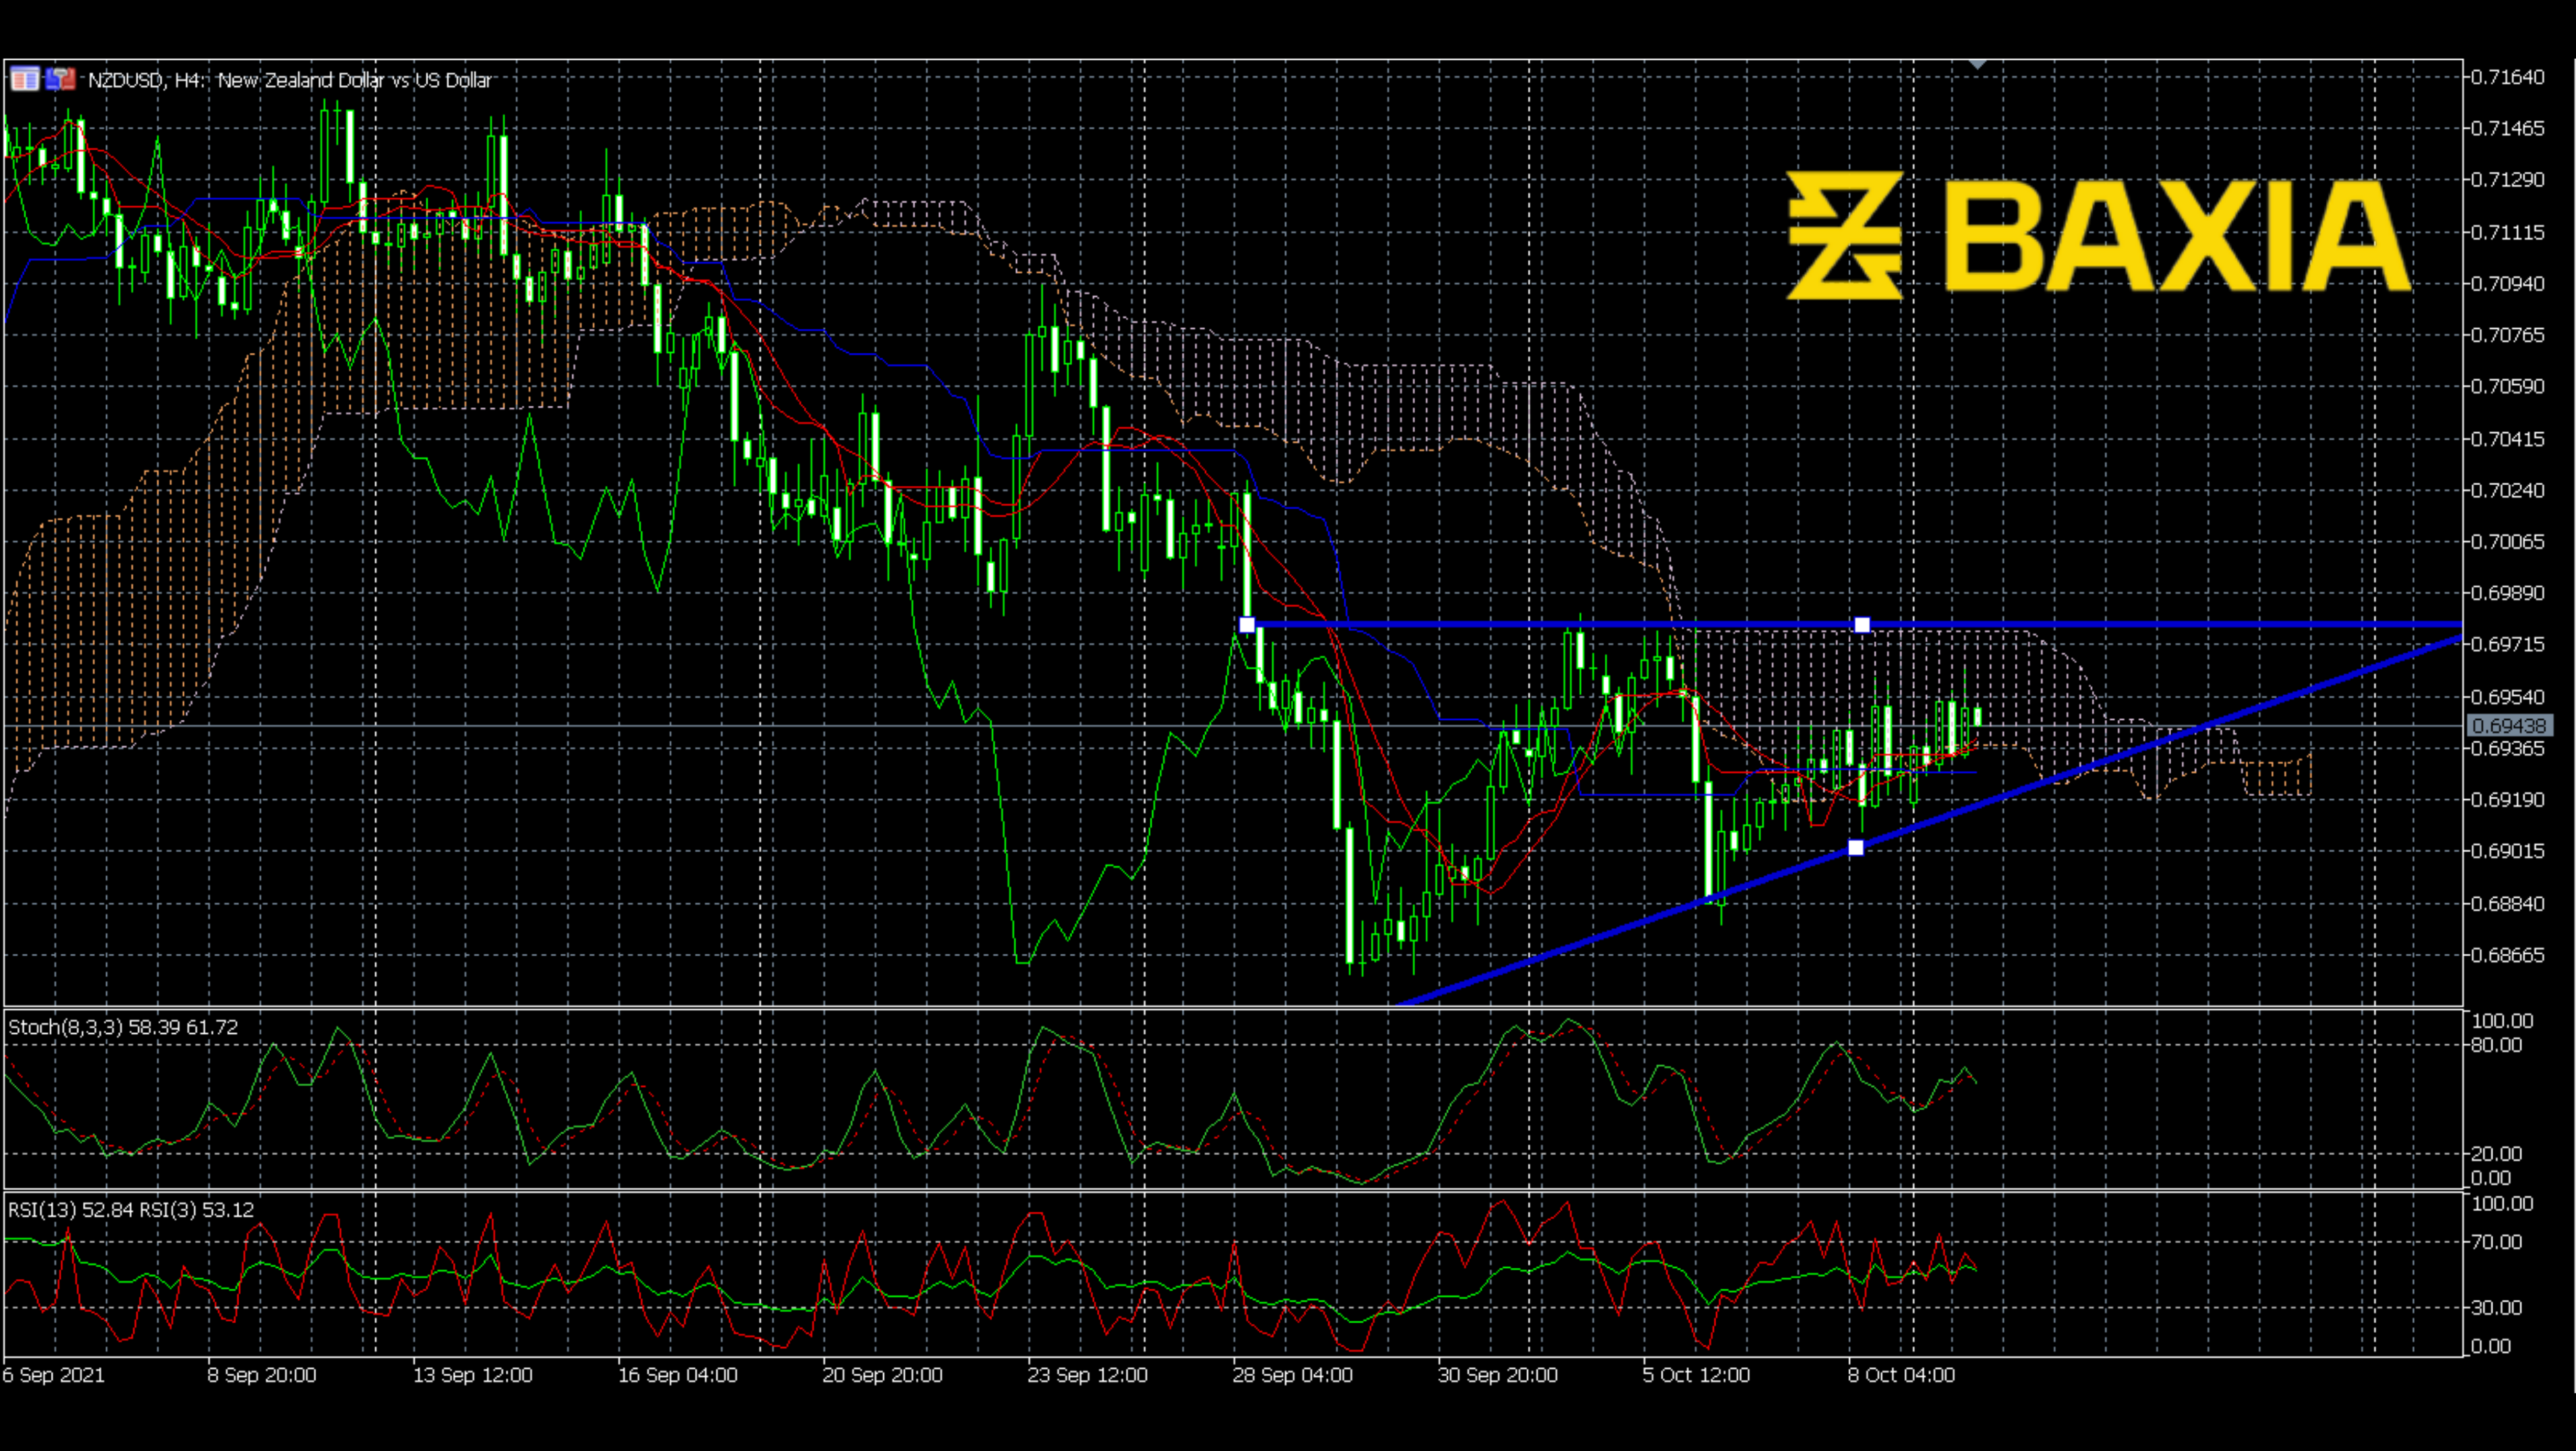
The price is going down and struggle at around 0.694; it is making a descending triangle. A descending triangle is no doubt a bearish signal. Once the pattern finished plotting, it breaks down. Will the price move as we expect?
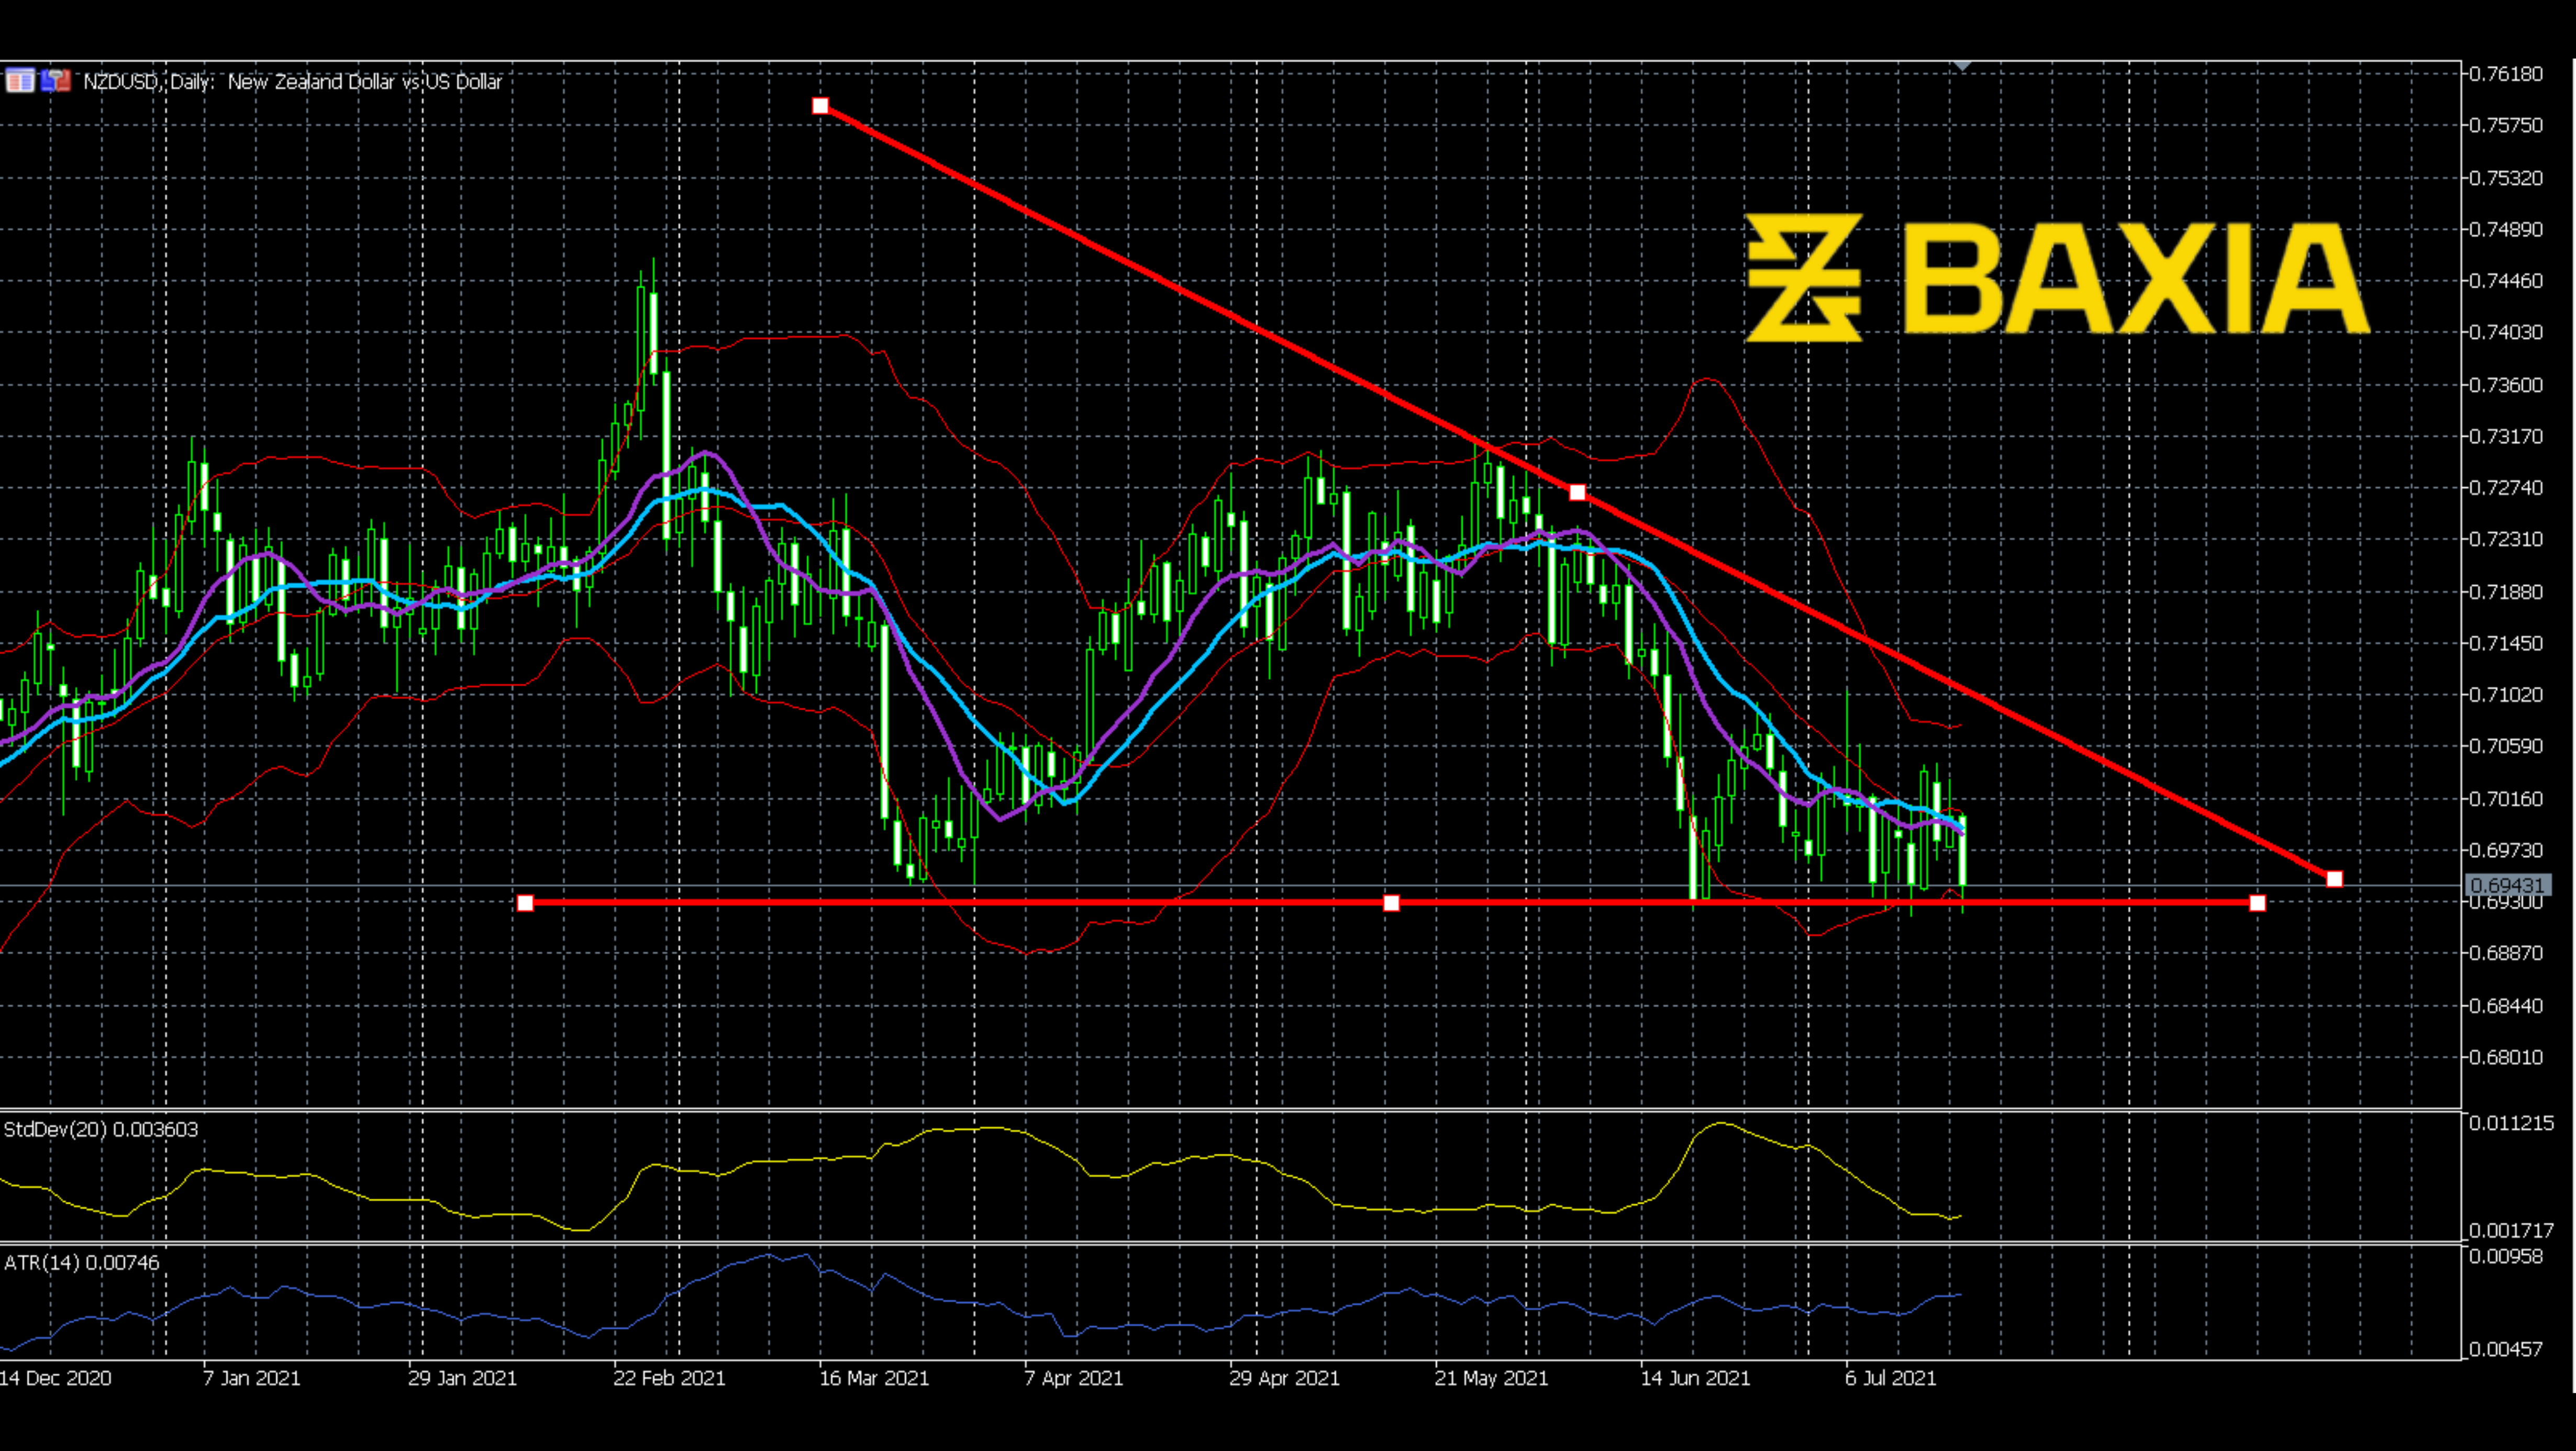
The Bollinger Bands already started to shrink; the price brokes a little on the bottom band, which means the price is testing downward; it is trying to breakout down. The moving average lines are twist here; there is no clear trend for price now. Standard deviation moves low because the price is struggling around 0.694; the movement was comparatively restricted. However, the Average True Range goes up; the length of a single candle is getting large.
According to the signals above, the price is now about to finish the descending triangle. And the price is at the bottom of the Bollinger Bands; it is about to break down.
We love to hear new ideas from traders and want to know what you think!
If you like this topic and want to suggest future topics that you find helpful, let us know by clicking the ‘submit your feedback’ button below.

Trading foreign exchange on margin carries a high level of risk, and may not be suitable for all investors. Before deciding to trade foreign exchange you should carefully consider your investment objectives, level of experience, and risk appetite.
Nothing contained in this website should be construed as investment advice. Any reference to an investment's past or potential performance is not, and should not be construed as, a recommendation or as a guarantee of any specific outcome or profit.