The upward trend ended on Sep 3rd, which was a thirteen days long trend. Although the resistance point on Sep 3rd was remarkable, we did not see any outstanding shrink on Bollinger Bands; they still moved mildly, but we found some hints of the downward trend after the resistance point.
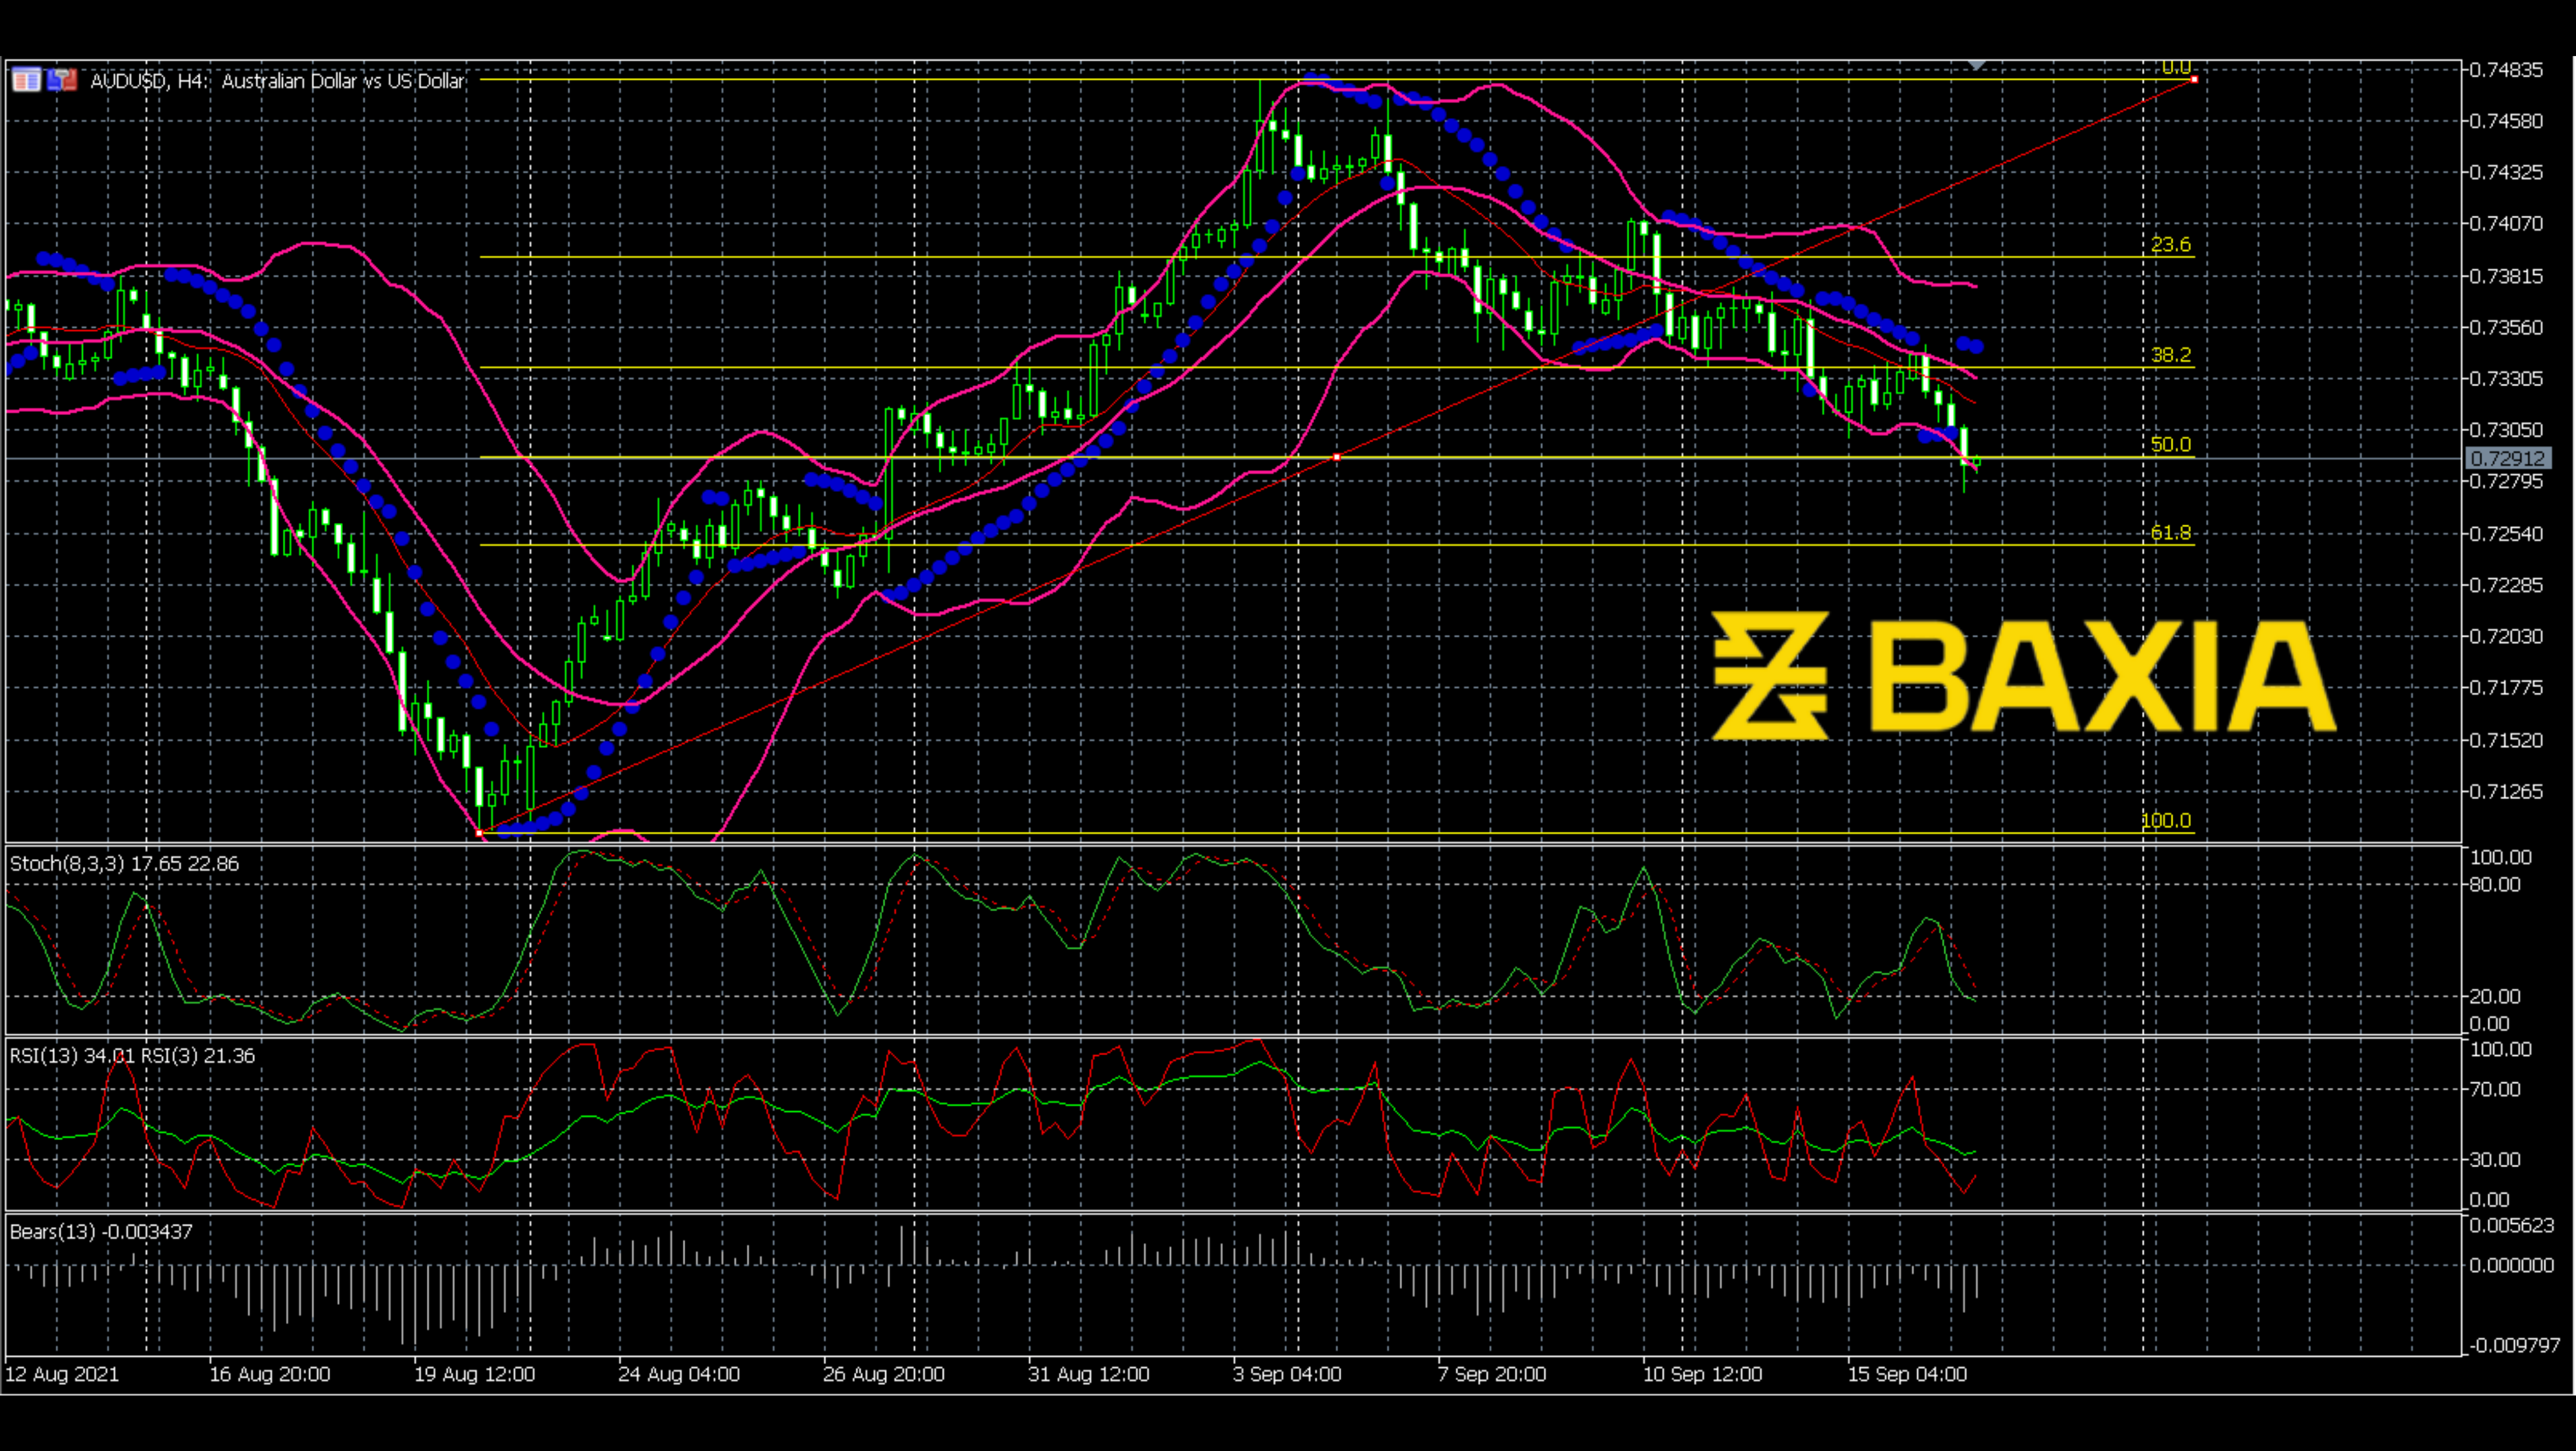
The Stochastics went down sharply after the resistance; then, it bounced up when it touched the oversold level. The Stochastics still made waves and tested the lower band several times; however, the downward trend continues. The RSI fluctuated more and tested the lower band multiple times after resistance. Although these momentum indicators do not give accurate direction, the signal is clear. Also, the bears' power is getting stronger, which is the same as our momentum indicator result.
Now, the price line broke out the Bollinger Bands again, which is also the 50% level Fibonacci. Let's wait to see if the price line breaks the 61.8% level Fibonacci.
We love to hear new ideas from traders and want to know what you think!
If you like this topic and want to suggest future topics that you find helpful, let us know by clicking the ‘submit your feedback’ button below.

Trading foreign exchange on margin carries a high level of risk, and may not be suitable for all investors. Before deciding to trade foreign exchange you should carefully consider your investment objectives, level of experience, and risk appetite.
Nothing contained in this website should be construed as investment advice. Any reference to an investment's past or potential performance is not, and should not be construed as, a recommendation or as a guarantee of any specific outcome or profit.