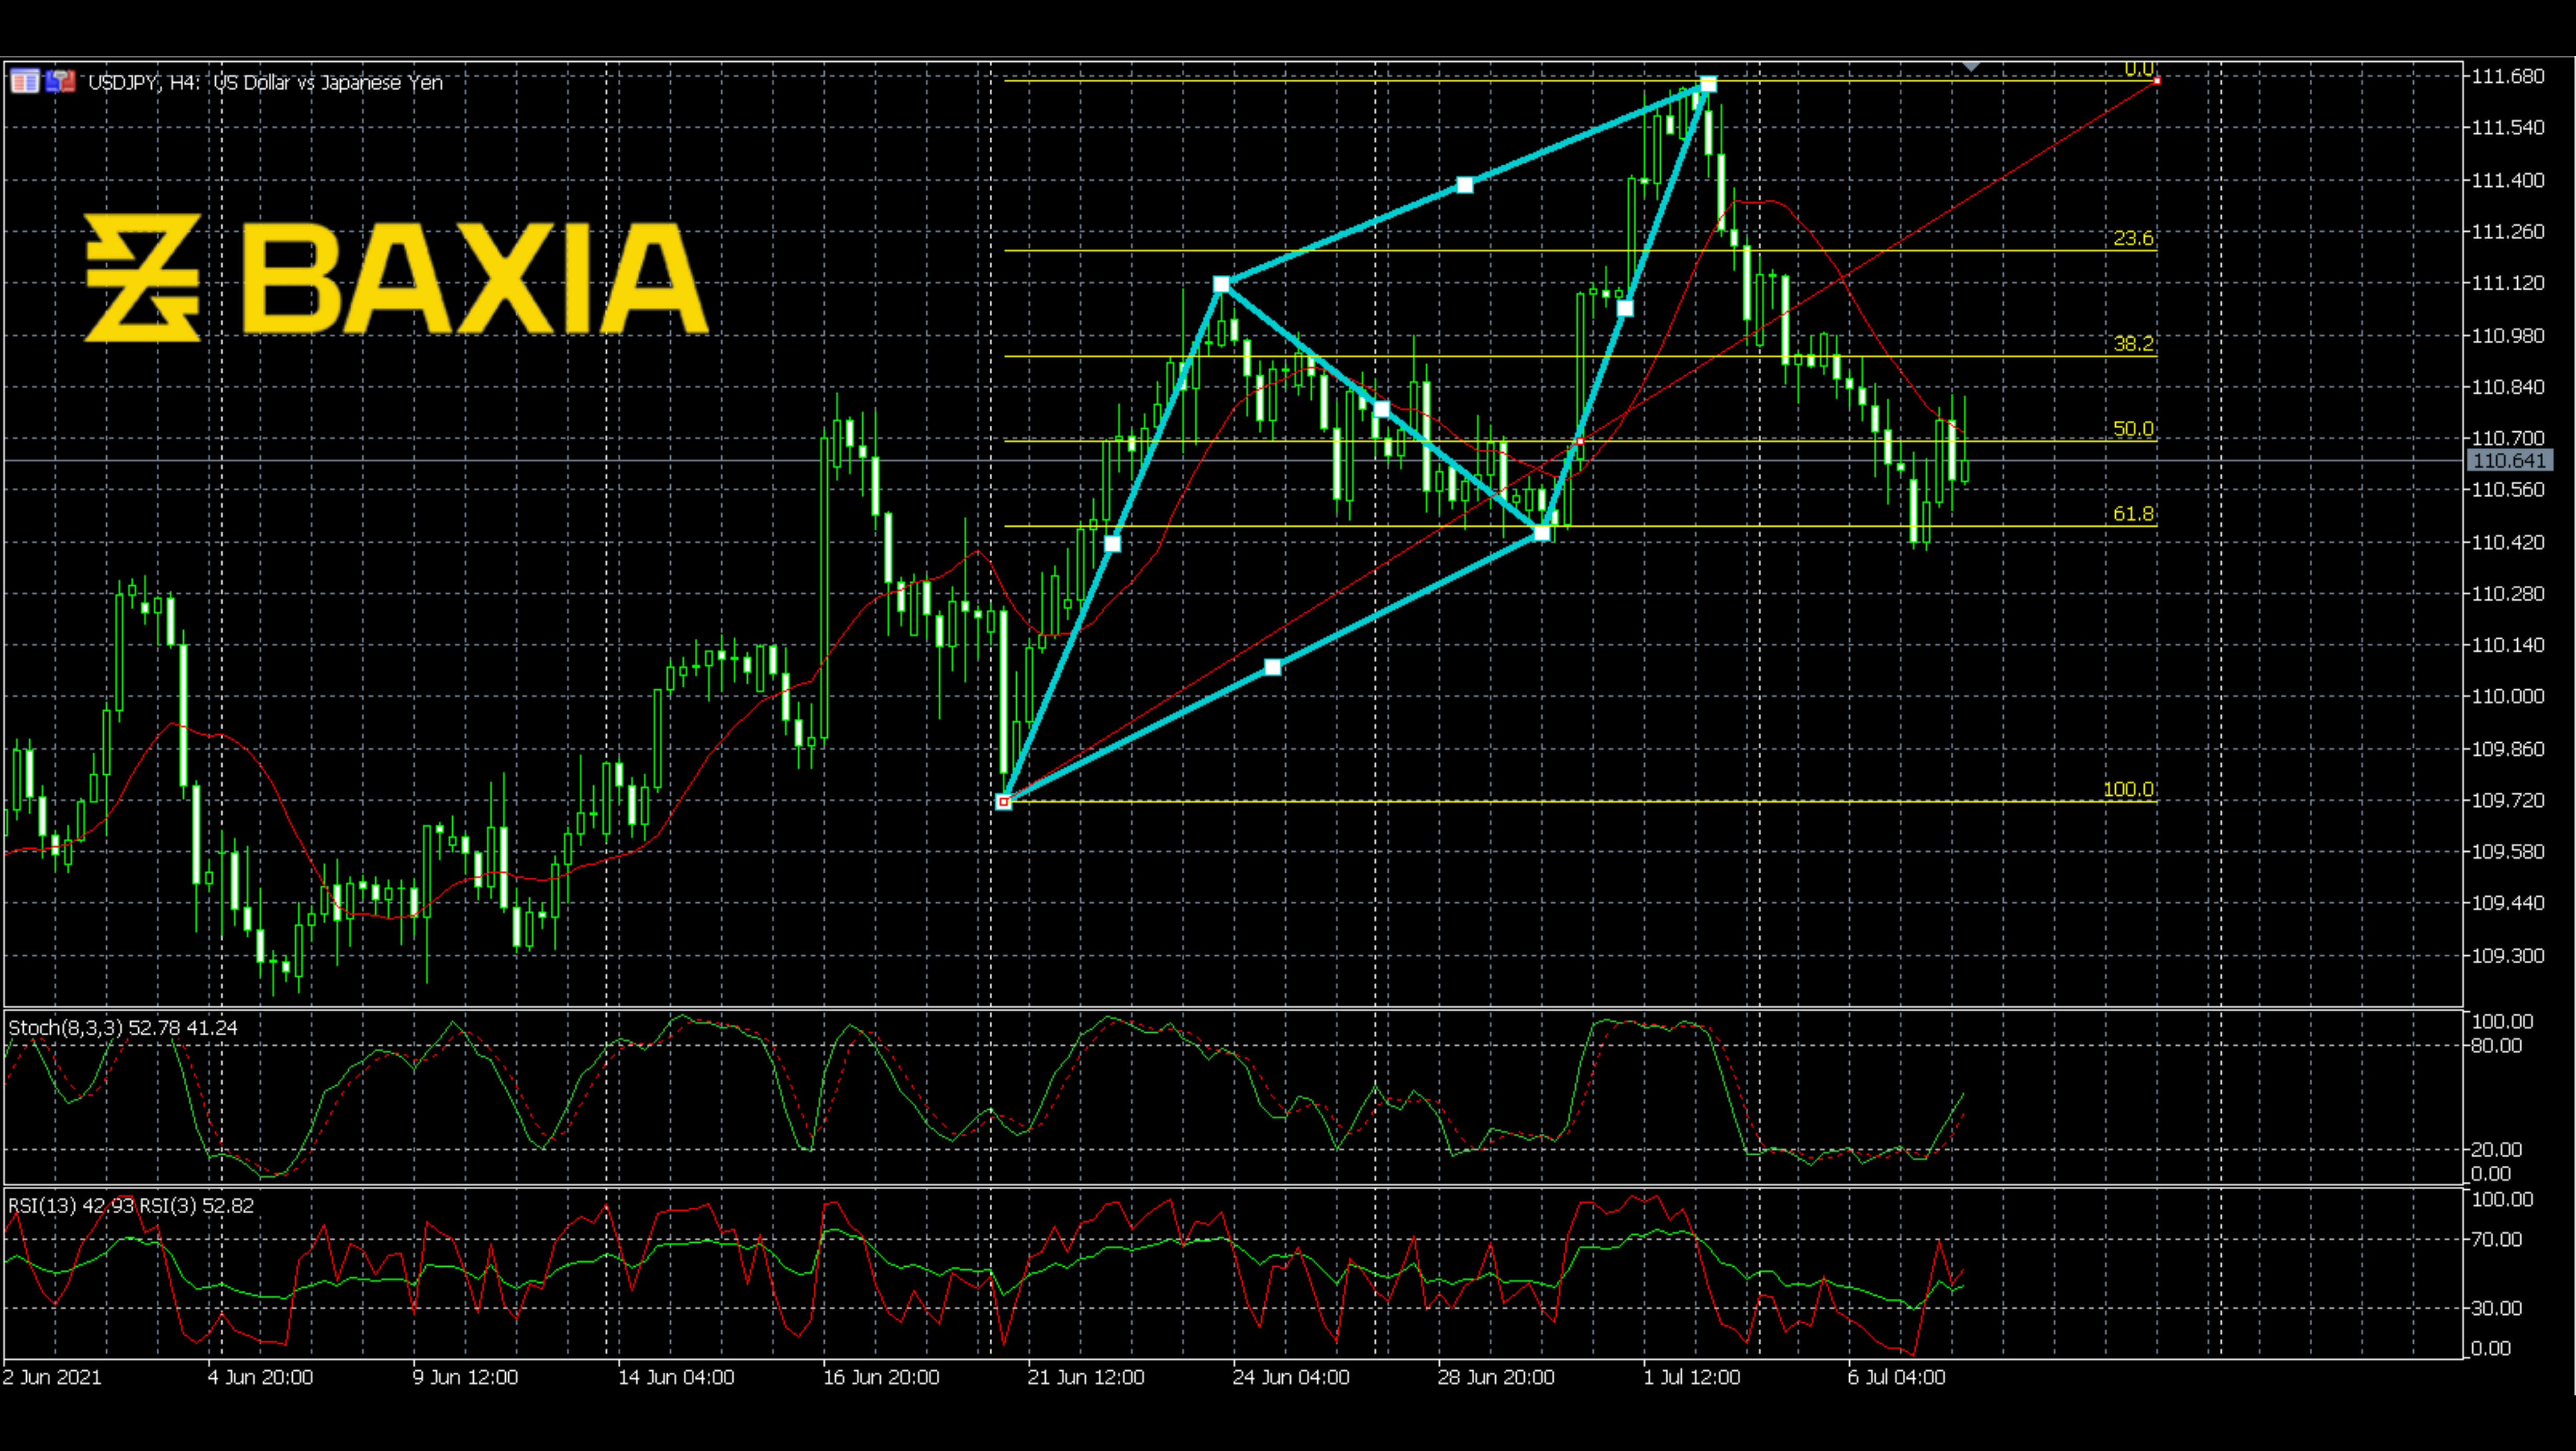

The upward trend in GBPUSD has lasted more than 11 days. During these 11 days, the upward trend was sharp, we can see that the price skyrocketed from point A to point B, followed by a steep incline from point B to point C. The price has been forming the famous ABCD pattern. The ABCD pattern is an analytic tool, which is based on the Fibonacci analytic method. For a pattern like this one here, it is usually considered a bearish signal, which means once the pattern is finished, it would start to go down. Do you trust it? Keep an eye on GBPUSD and see how it moves.
.png?width=4920&name=Graph%20Template%20(8).png)
MACD is still moving up, but don’t worry, MACD is a lagging oscillator, the bearish signal may come later. On the other hand Stochastics & RSI have already been overbought for about 24 hours. This could become a very unstable situation very quickly. The chances that the price can retrace back anytime are fairly high. Today, the price passes the R1 of the Pivot Point. This is not a high resistance level, however, the price also broke out the upper Bollinger Bands. As we know, the bands always push the price line back to the middle. If bearish signals show up, a break down may be on the way.
Resistant: 1.42573
Support: 1.39079

Trading foreign exchange on margin carries a high level of risk, and may not be suitable for all investors. Before deciding to trade foreign exchange you should carefully consider your investment objectives, level of experience, and risk appetite.
Nothing contained in this website should be construed as investment advice. Any reference to an investment's past or potential performance is not, and should not be construed as, a recommendation or as a guarantee of any specific outcome or profit.