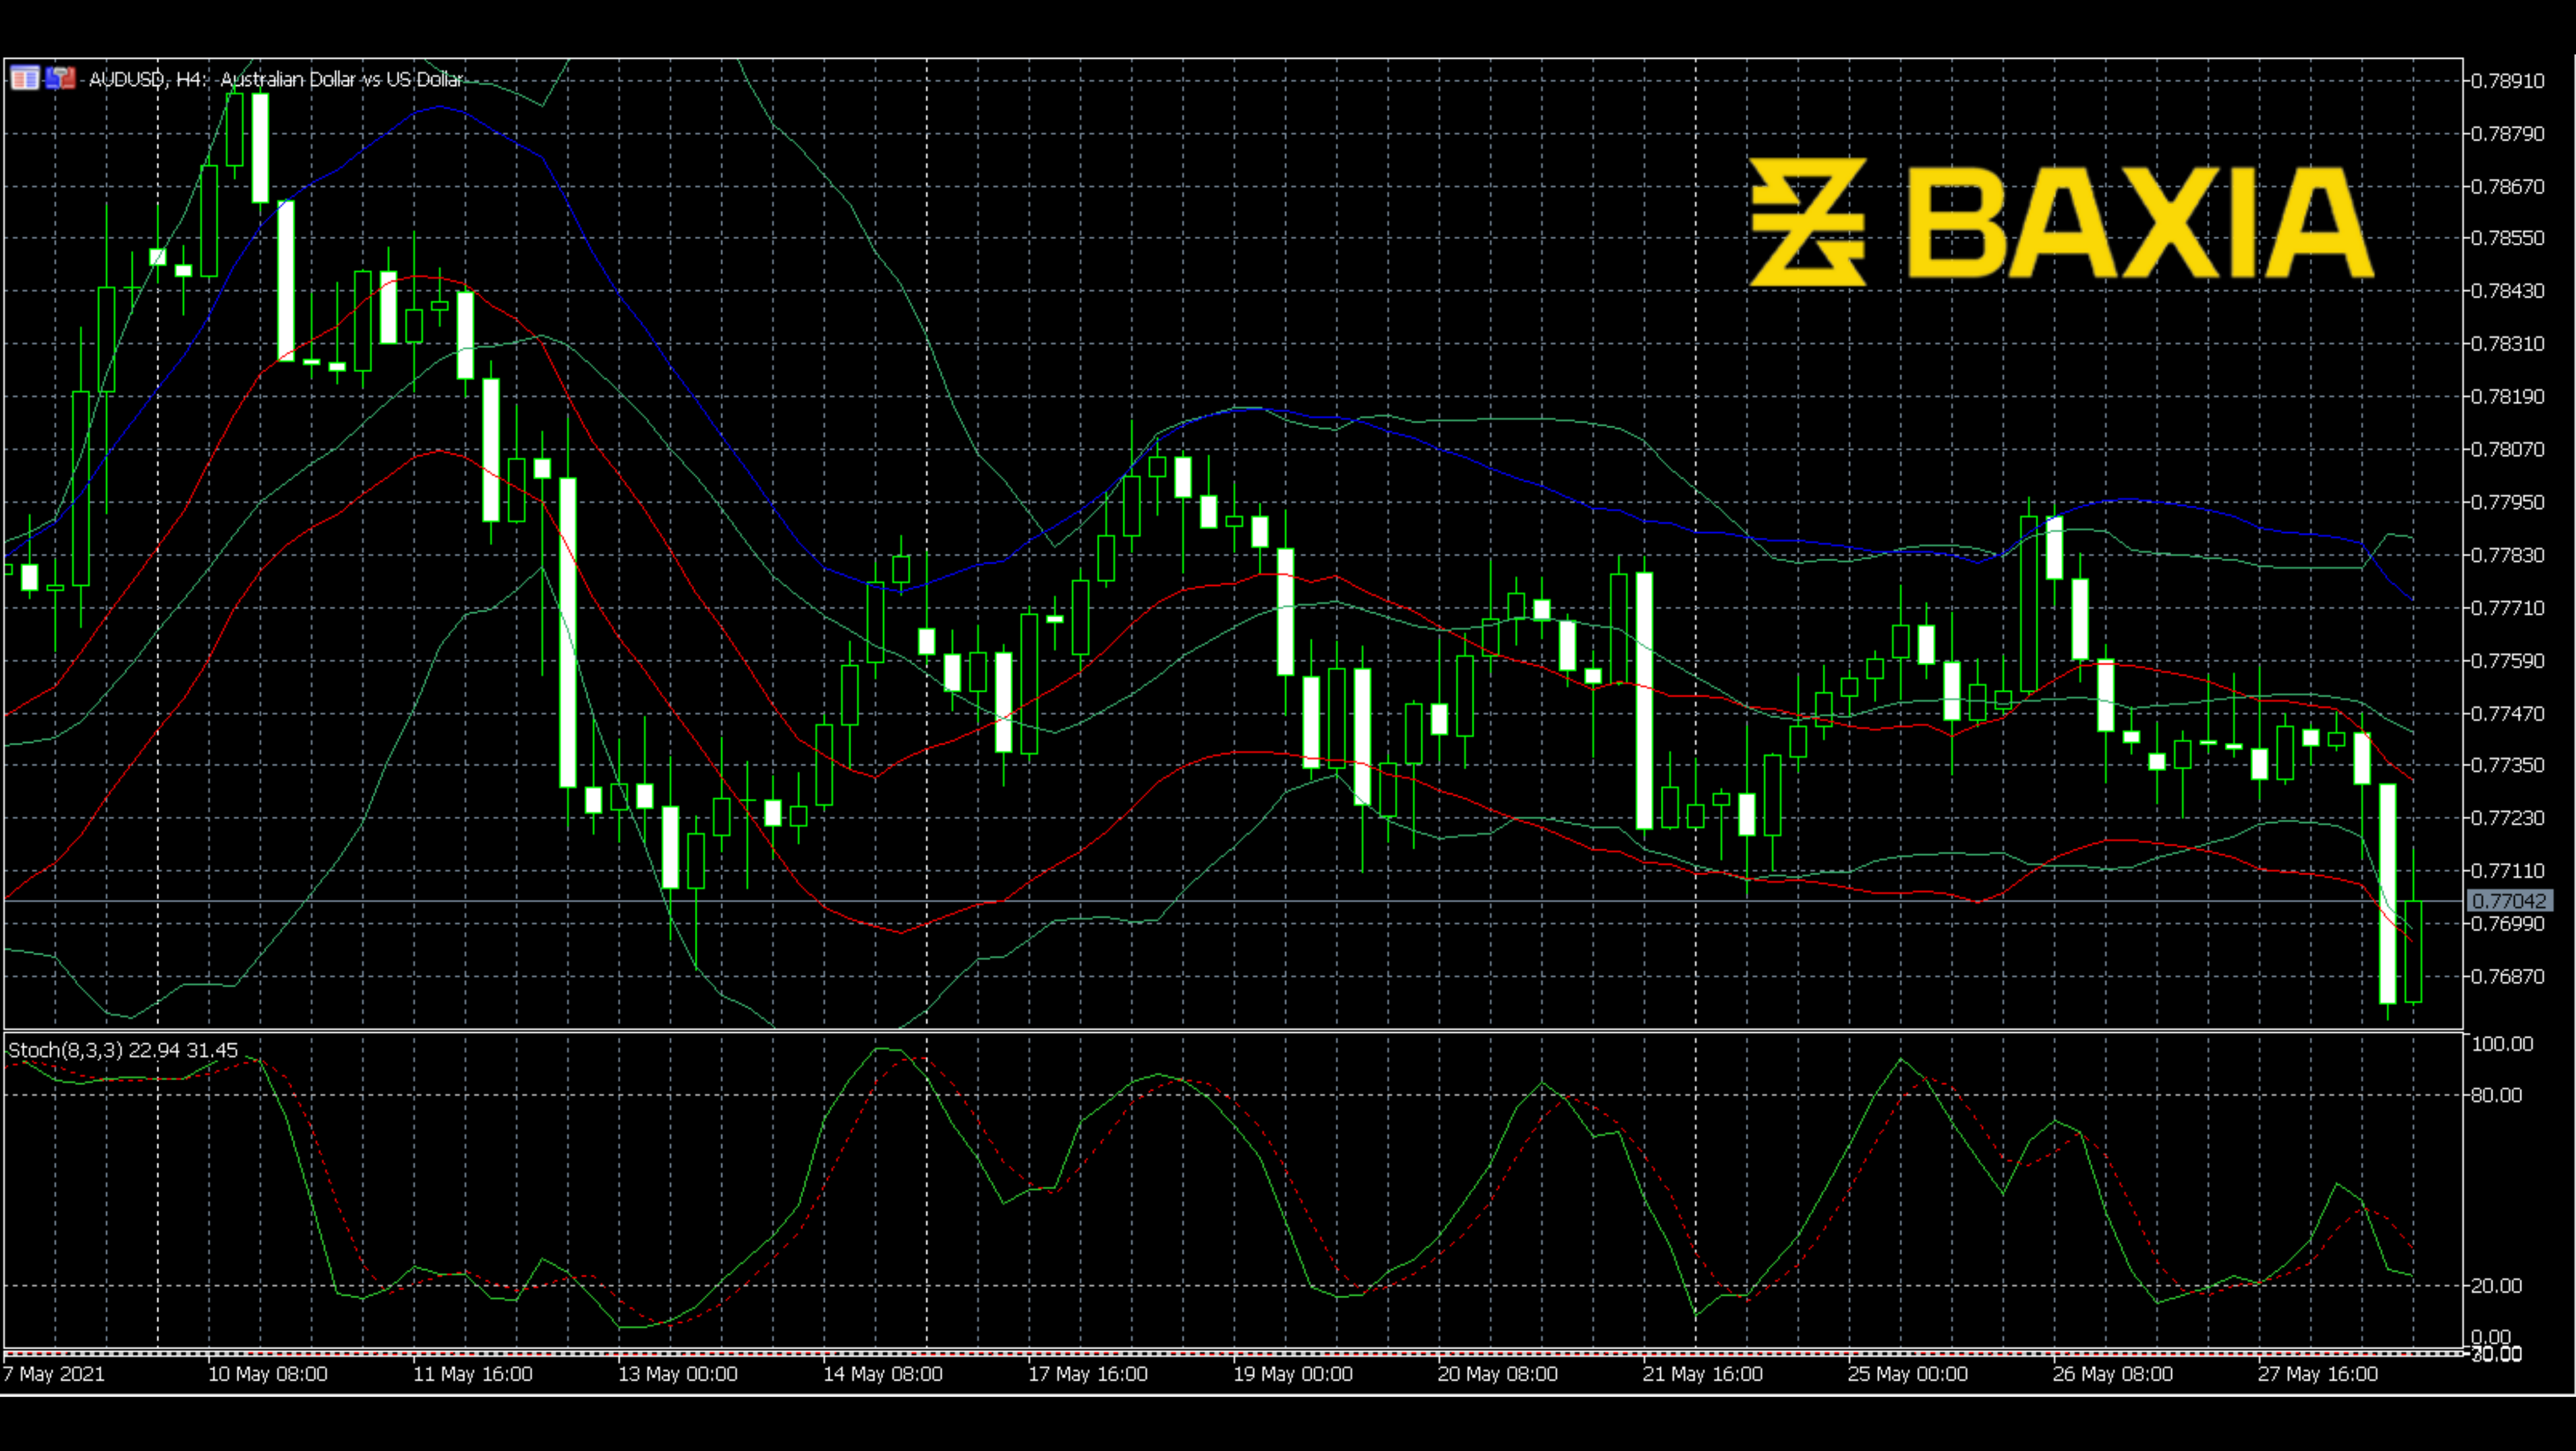
AUDUSD has been hovering around 0.774 for more than two weeks, although tests were made, we have not seen too many drastic moves in the last two weeks. Today, the price has taken its biggest drop in the last two weeks. This downward breakout hurts most of the unprepared traders. What happened? The price has gone below the middle line of the Bollinger Bands for two days, this prepared price power to break out. Now, the price not only broke out the Bollinger Bands, but also the 0.5 deviations Envelope.
Does the price meet support here? As we all know, when the price touches the boundary of the Bollinger Bands, it gets the power to bounce back to the middle line, and it works the same way on the Envelope.

Although the Stochastics have not reached the oversold area, the downward trend seems to end up here because two lines are about to cross again, and the low level is also dangerous on the Stochastics. Is this time to trade AUDUSD?
We love to hear new ideas from traders and want to know what you think!
If you like this topic and want to suggest future topics that you find helpful, let us know by clicking the ‘submit your feedback’ button below.
Trading foreign exchange on margin carries a high level of risk, and may not be suitable for all investors. Before deciding to trade foreign exchange you should carefully consider your investment objectives, level of experience, and risk appetite.
Nothing contained in this website should be construed as investment advice. Any reference to an investment's past or potential performance is not, and should not be construed as, a recommendation or as a guarantee of any specific outcome or profit.
