 The NZDUSD pair has been a subject of close scrutiny lately as economic factors from both New Zealand and the United States continue to influence its direction. Here's a closer look at what's been happening and what to watch out for in the coming days.
In September, US Consumer Confidence saw a decline to 103.0 from August's 108.7, marking its lowest level in four months. This dip was largely attributed to the impact of rising interest rates. Meanwhile, economic indicators provided a mixed bag of results. Building Permits for August increased to 1.541 million from the previous month's 1.44 million. The House Price Index for July exceeded expectations by rising to 0.8% month-on-month, while August New Home Sales faced an -8.7% drop following July's 8% rise.
The Federal Reserve held interest rates steady in its September meeting, maintaining the range of 5.25% to 5.50%. However, the hawkish stance from Minneapolis Federal Reserve Bank President Neel Kashkari hinted at one more rate hike this year. Kashkari emphasized that US rates may need to go higher and remain elevated for a longer duration to cool off certain aspects of the economy. This Fed policy direction is bolstering the US Dollar and presenting headwinds for the NZDUSD pair.
On the Kiwi front, the markets appear to have factored in a potential Official Cash Rate (OCR) hike by the Reserve Bank of New Zealand (RBNZ) by the end of 2023. This adjustment comes as the New Zealand economy demonstrates greater resilience than initially anticipated. However, New Zealand's Trade Balance for August showed a deficit of $-2,291 million, up from the previous month's $-1,107 million. On an annual basis, the trade deficit improved slightly to $15.54 billion.
Moving forward, investors will closely monitor New Zealand's Business Confidence for September and ANZ Roy Morgan Consumer Confidence data. In the US, attention will shift to the Durable Goods Orders report. Market focus will then center around the Fed's preferred gauge of consumer inflation, the Core Personal Consumption Expenditure (PCE) Price Index, scheduled for release later. Analysts anticipate a decline in the annual rate from 4.2% to 3.9%. Traders will be on the lookout for potential trading opportunities in the NZDUSD pair based on the evolving economic landscape.

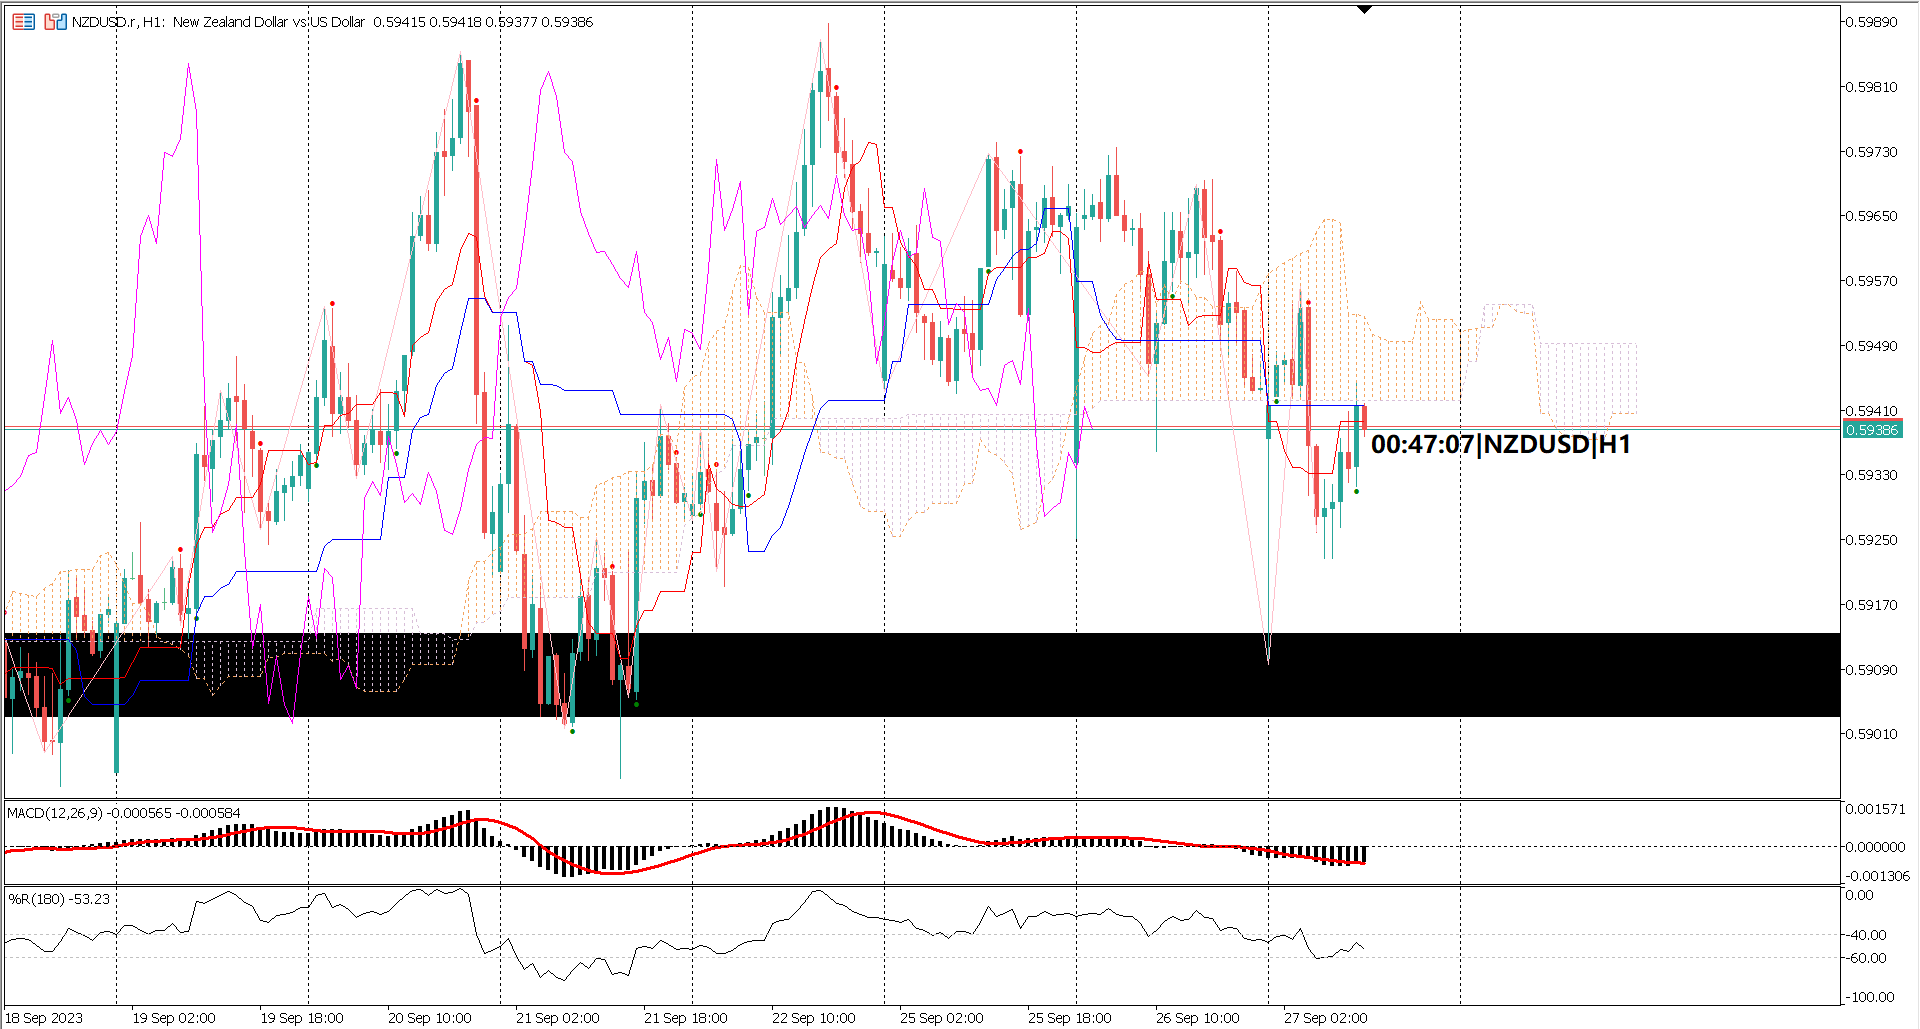
In the recent hourly timeframe chart, the price tested the critical support zone between 0.5913 and 0.5903, forming a bullish candle with a long tail wick. However, despite this short-term rebound, NZD/USD remains under persistent bearish pressure. The Ichimoku indicator reveals a strong bearish trend, with the Chikou Span, Kijun Sen, and Tenkan Sen all situated below the Ichimoku cloud. Furthermore, the MACD signal line and MACD histogram remain below the zero line, further confirming the prevailing bearish sentiment. Additionally, the William's Percent R indicator, set with a period of 180, recently dipped briefly below -60, indicating bearish conditions.
Forecast 0.0% vs Previous 4.9%
Forecast -0.5% vs Previous -5.2%
Trading foreign exchange on margin carries a high level of risk, and may not be suitable for all investors. Before deciding to trade foreign exchange you should carefully consider your investment objectives, level of experience, and risk appetite.
Nothing contained in this website should be construed as investment advice. Any reference to an investment's past or potential performance is not, and should not be construed as, a recommendation or as a guarantee of any specific outcome or profit.
