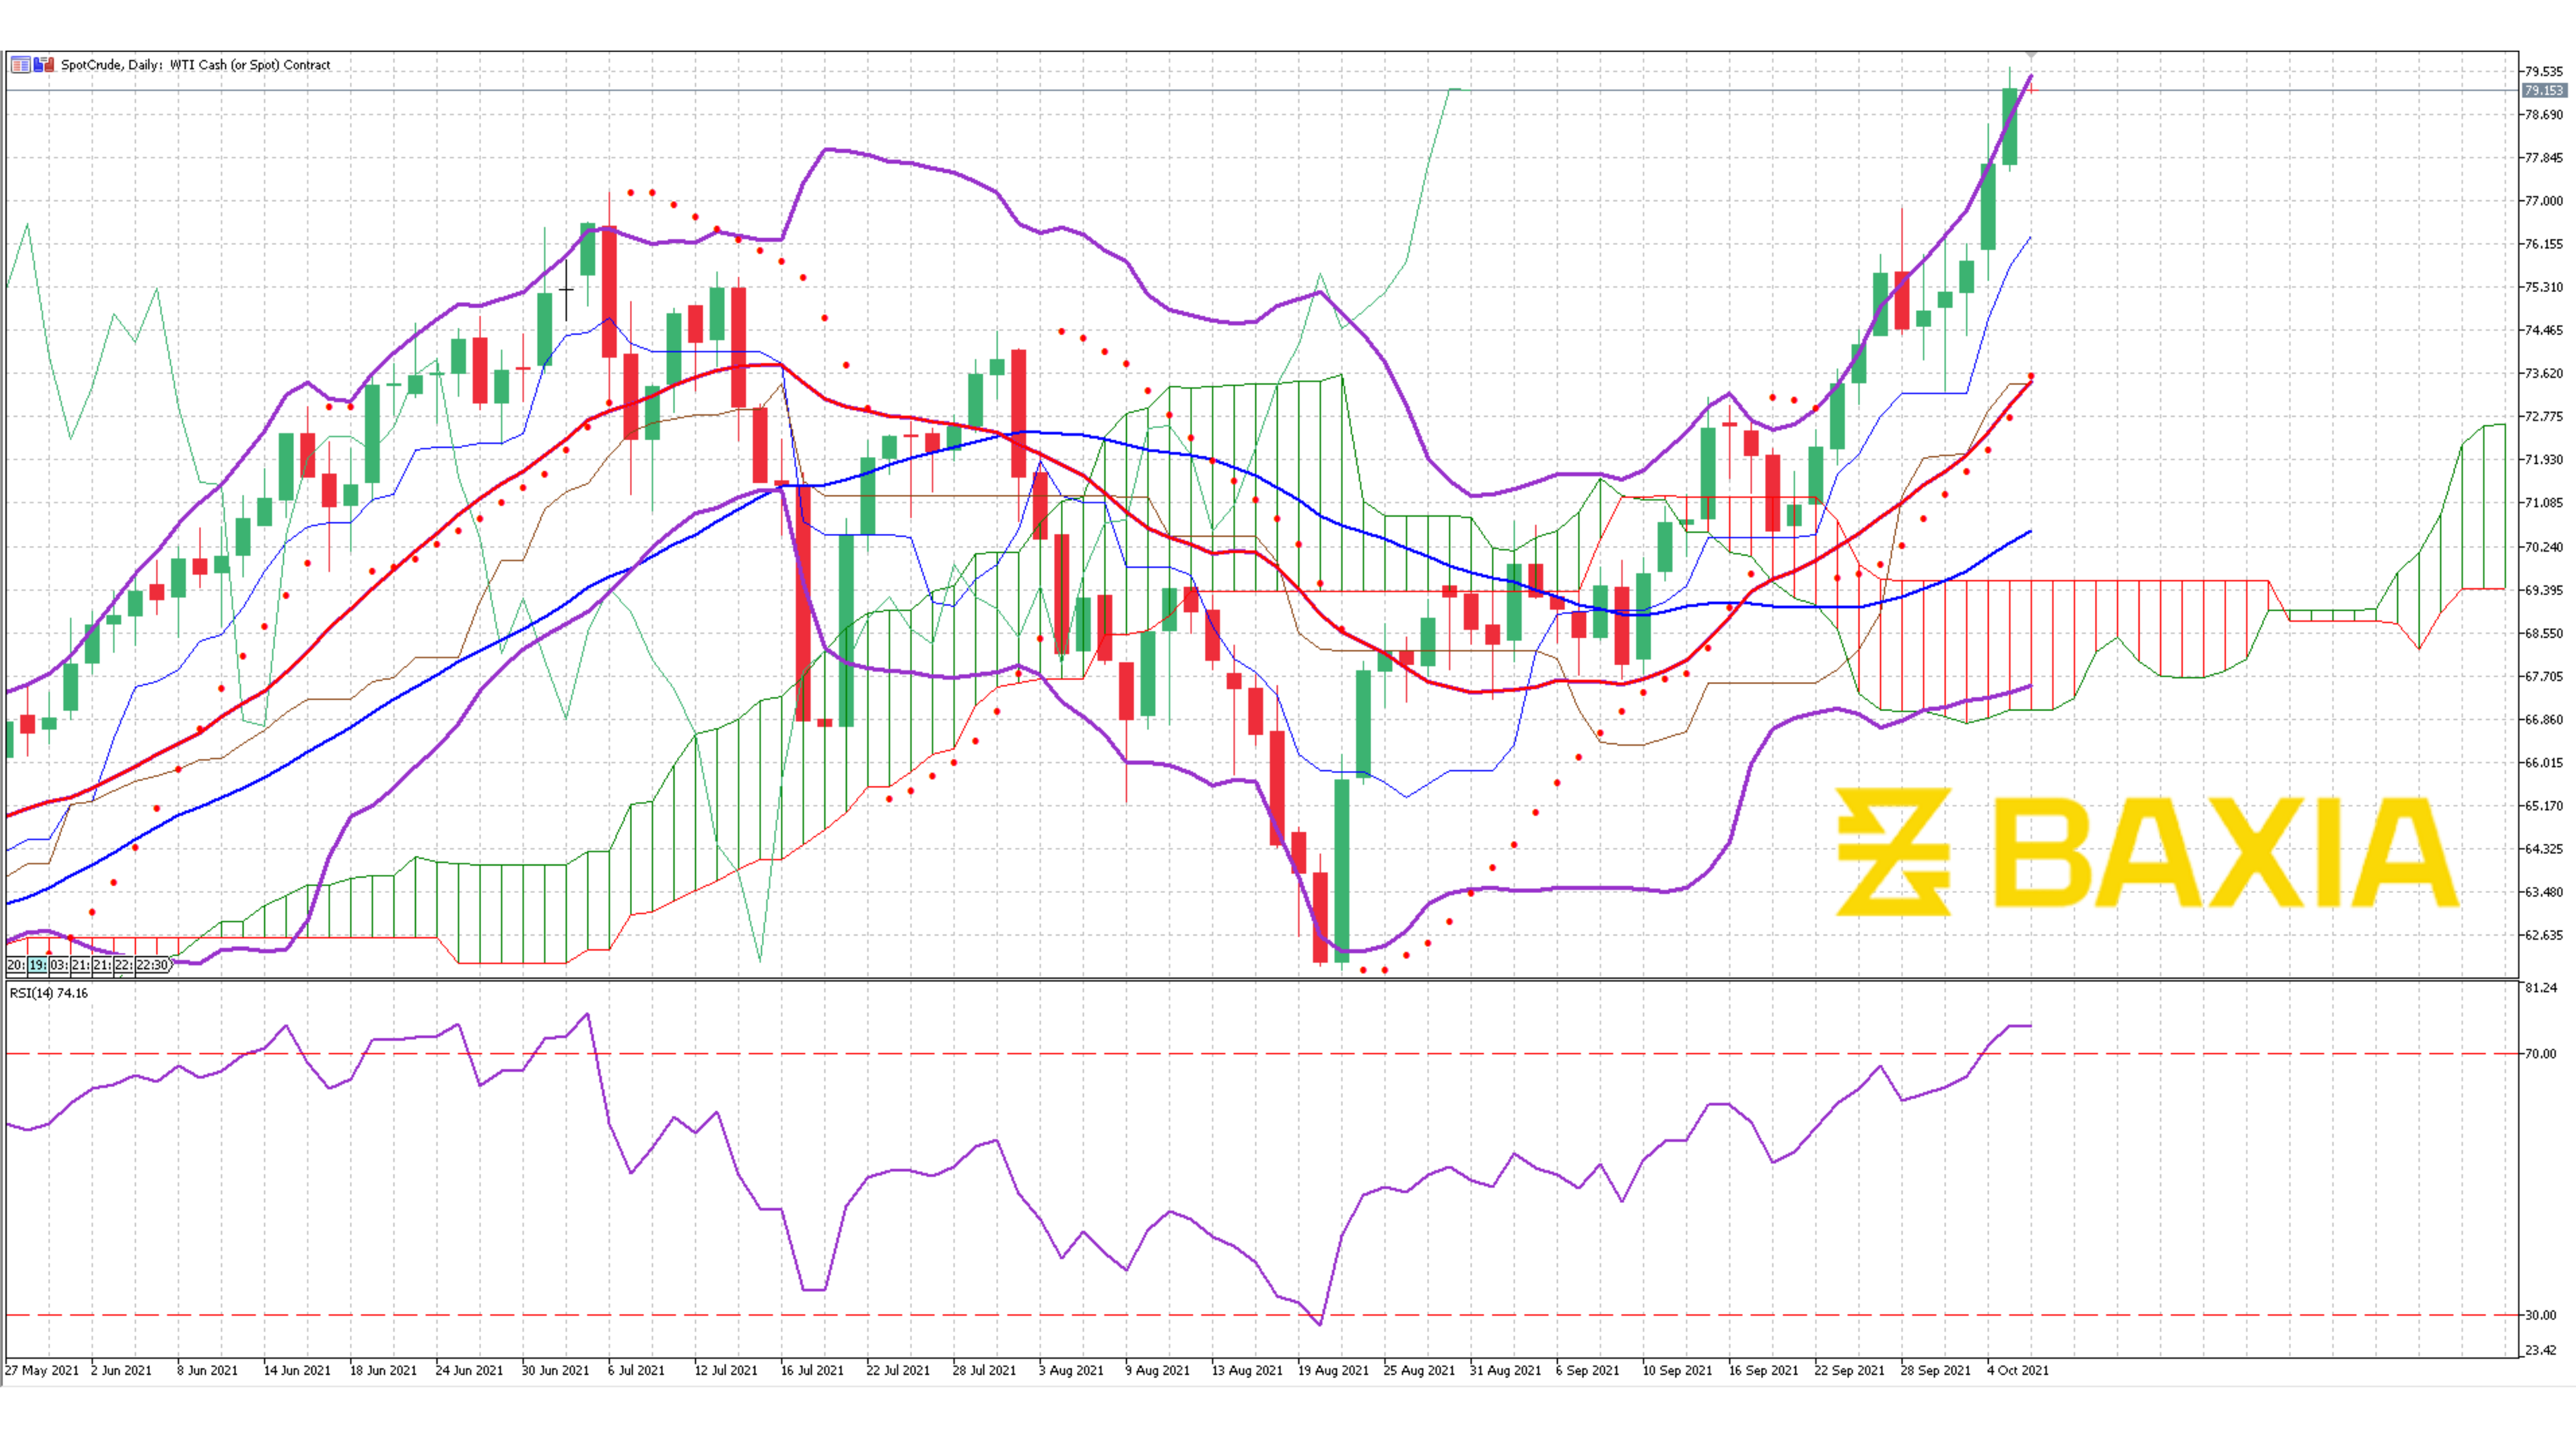

The energy commodity continues its uptrend but is struggling to complete the breakout of the 23.6% Fibonacci retracement at $79.83. The price might find a pullback in the next few sessions before continuing the rally.
The Bollinger bands are wide and moving up, indicating an uptrend; however, the pair is trading very close to the upper band, suggesting that the price is relatively high, this is one of the reasons we are seeing a small pullback in today’s session.
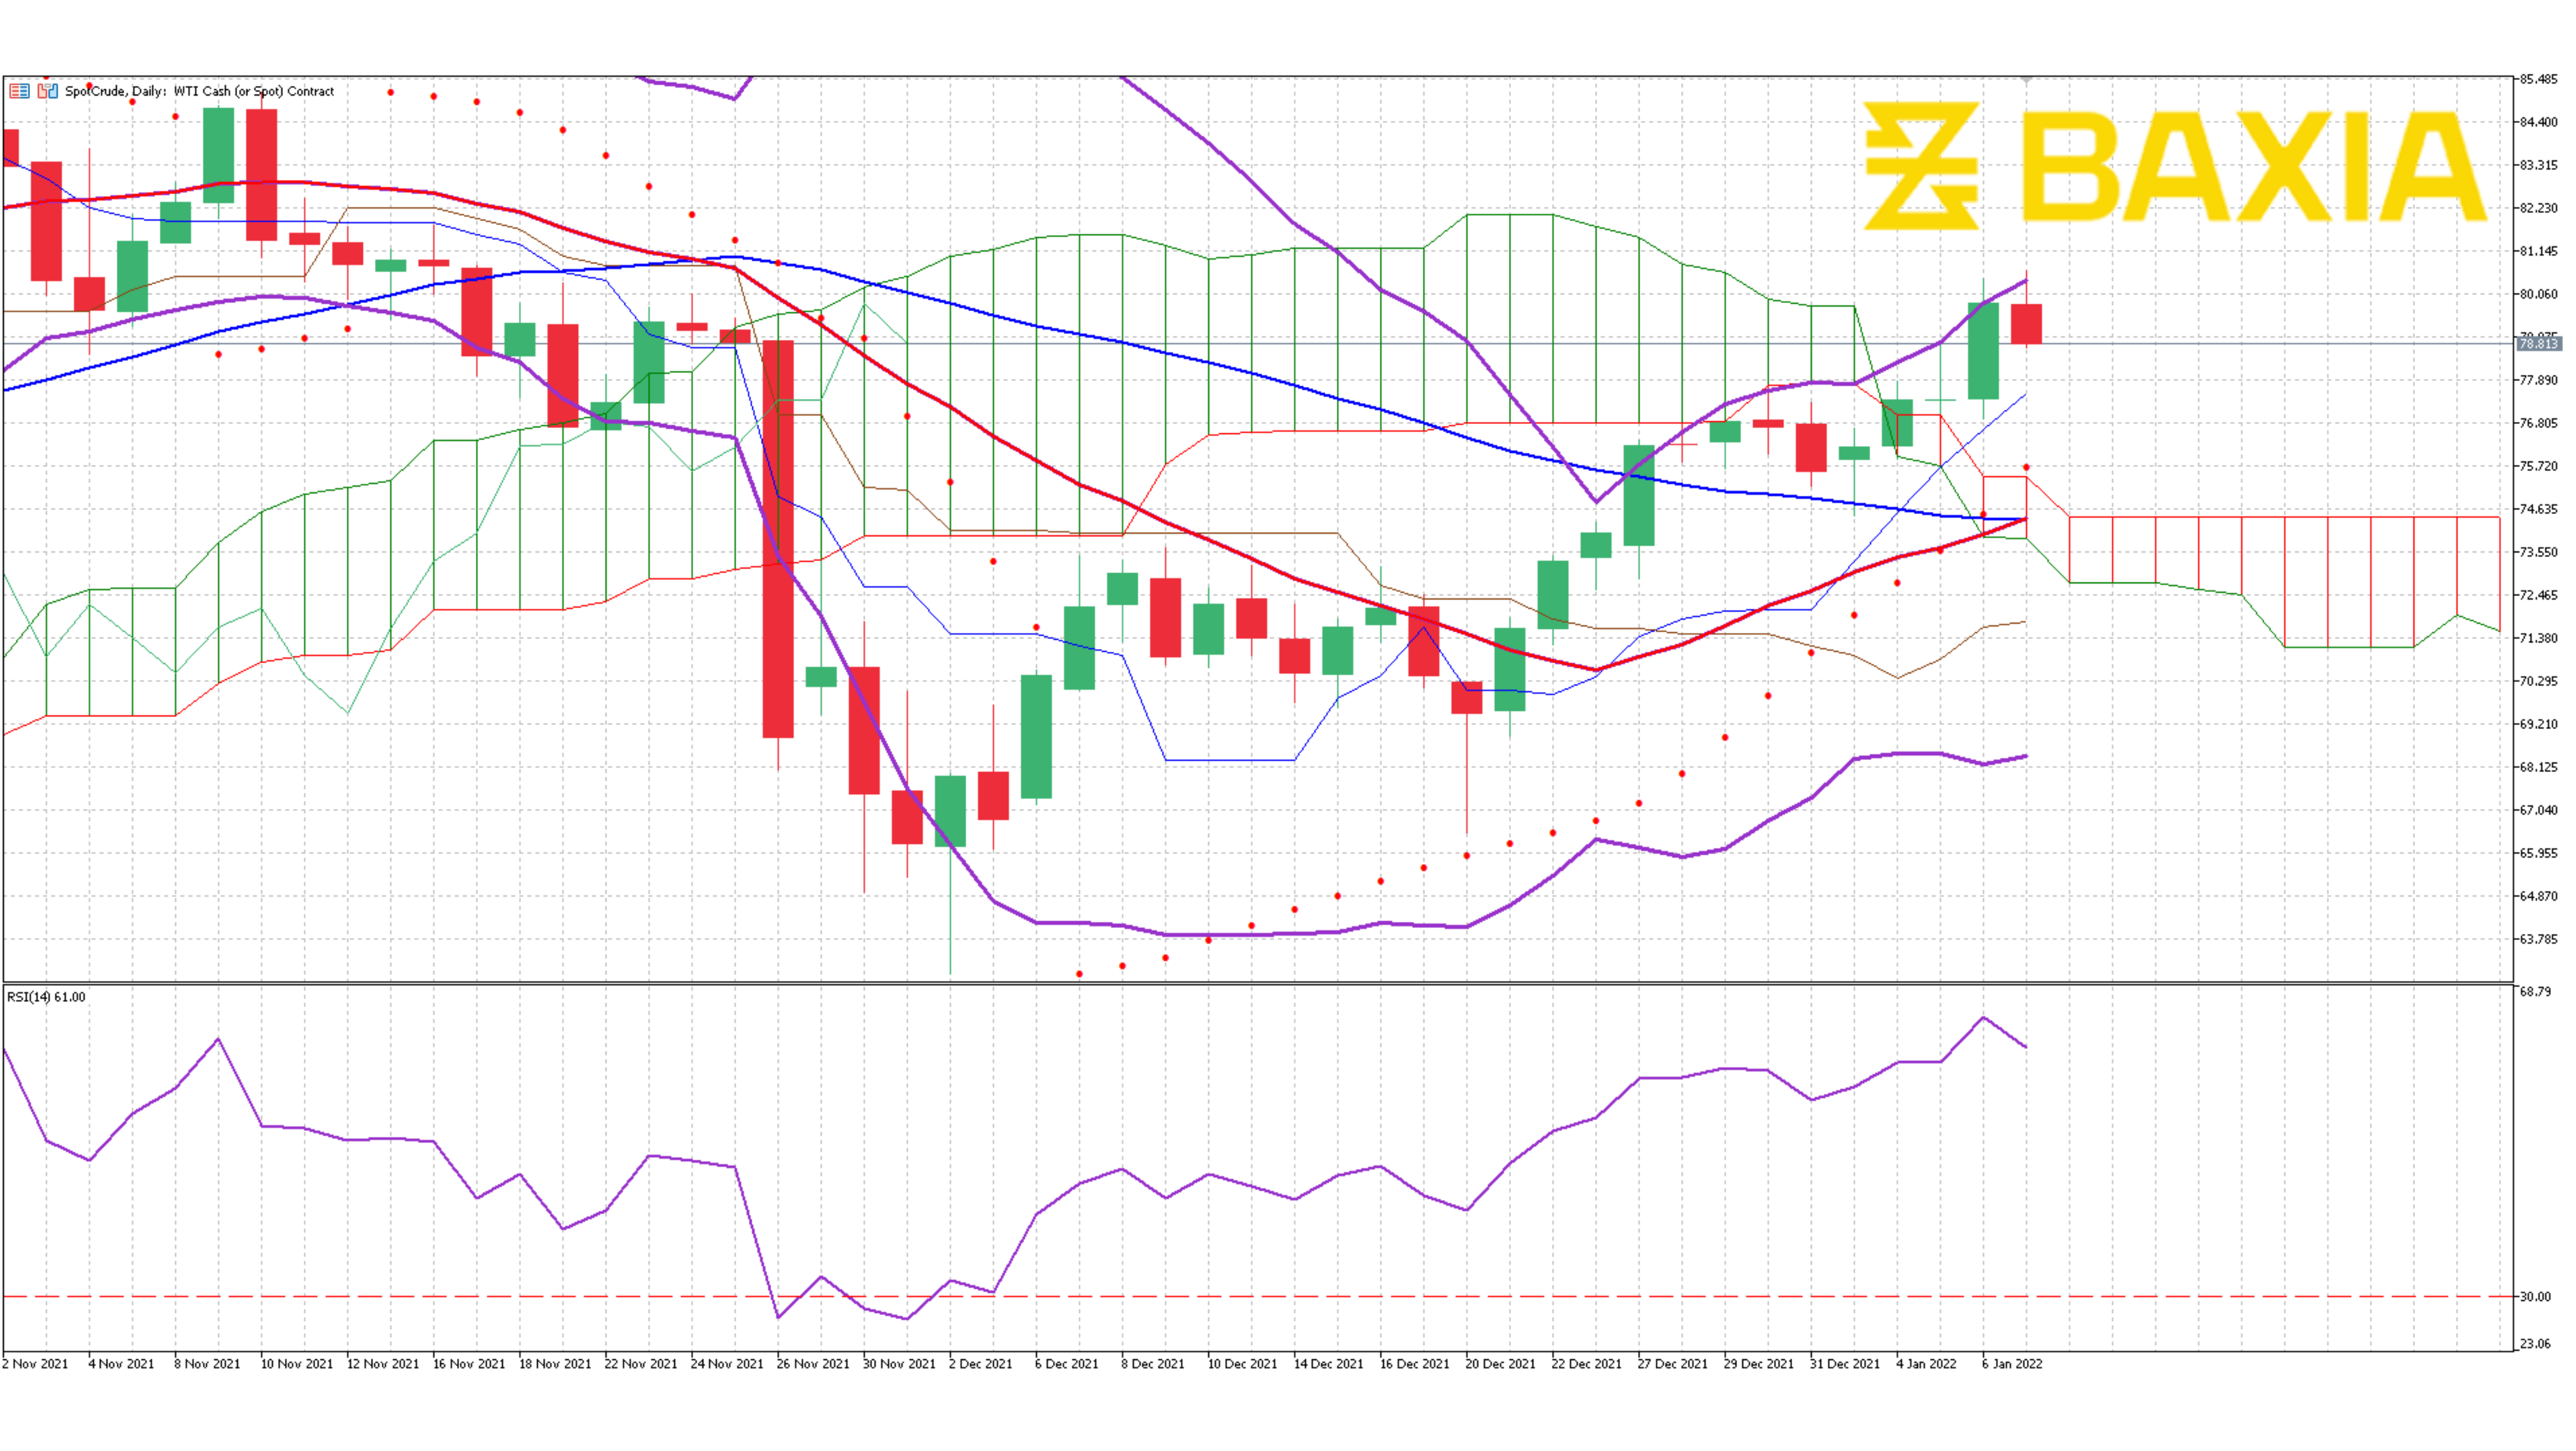
The relative strength index is ay 63% which will allow the pair to move just a bit more before entering an overbought status, a price correction is expected in the short term, and it is necessary for the commodity to continue moving up in the midterm.
Our parabolic SAR indicator suggests that the price will continue its uptrend, but with the current RSI levels and Bollinger bands we see this very unlikely, at least in the short term.
We love to hear new ideas from traders and want to know what you think!
If you like this topic and want to suggest future topics that you find helpful, let us know by clicking the ‘submit your feedback’ button below.

Trading foreign exchange on margin carries a high level of risk, and may not be suitable for all investors. Before deciding to trade foreign exchange you should carefully consider your investment objectives, level of experience, and risk appetite.
Nothing contained in this website should be construed as investment advice. Any reference to an investment's past or potential performance is not, and should not be construed as, a recommendation or as a guarantee of any specific outcome or profit.