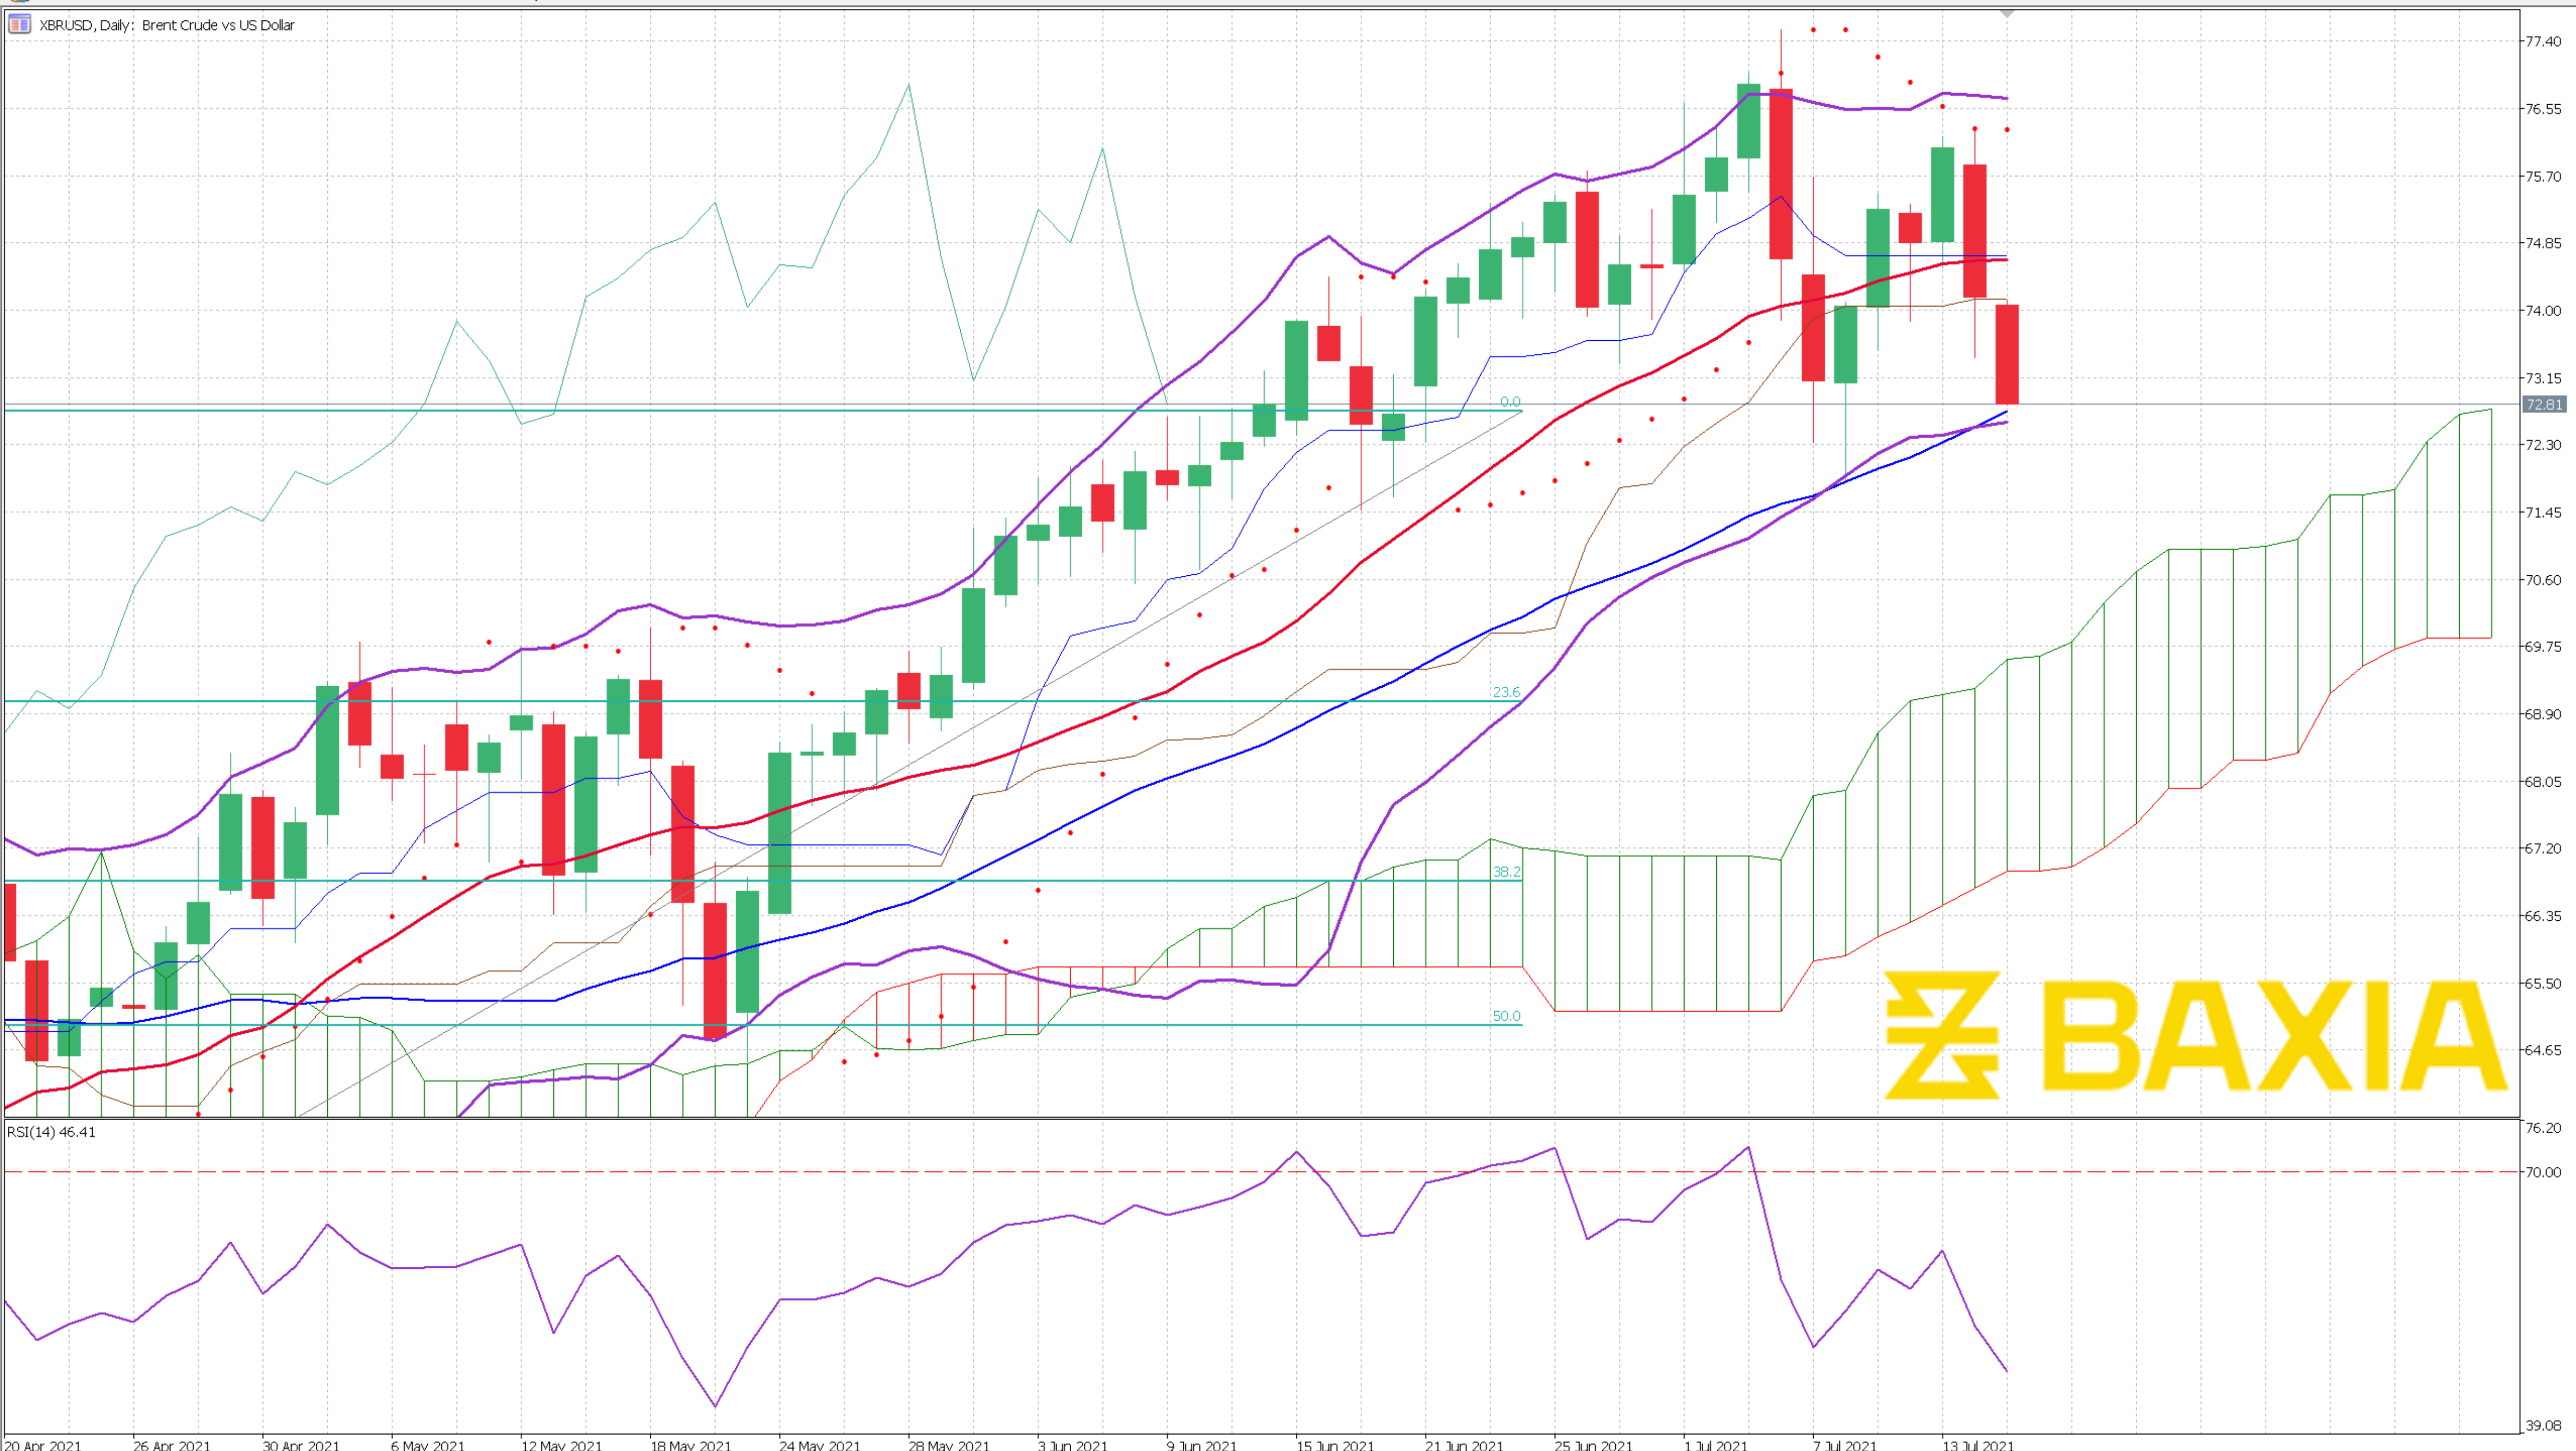

The energy commodity reached the $79.76 level, and then it lost 2.7%; the price could pull back to the support level at 74.45 on our 23.6% Fibonacci retracement.
The Bollinger bands are very wide, and volatility has been very high in the last few sessions. The price trades closer to the upper band, suggesting that it is relatively high, which is why we see a drop in the price; this might be temporary but necessary. Once the correction is done, the price will likely resume its upwards trend,
The relative strength index is recovering from an overbought status and is currently at 64%, which we expect to drop at least to 60% before the upwards trend continues. The pair need to gather strength to break the $80 barrier.
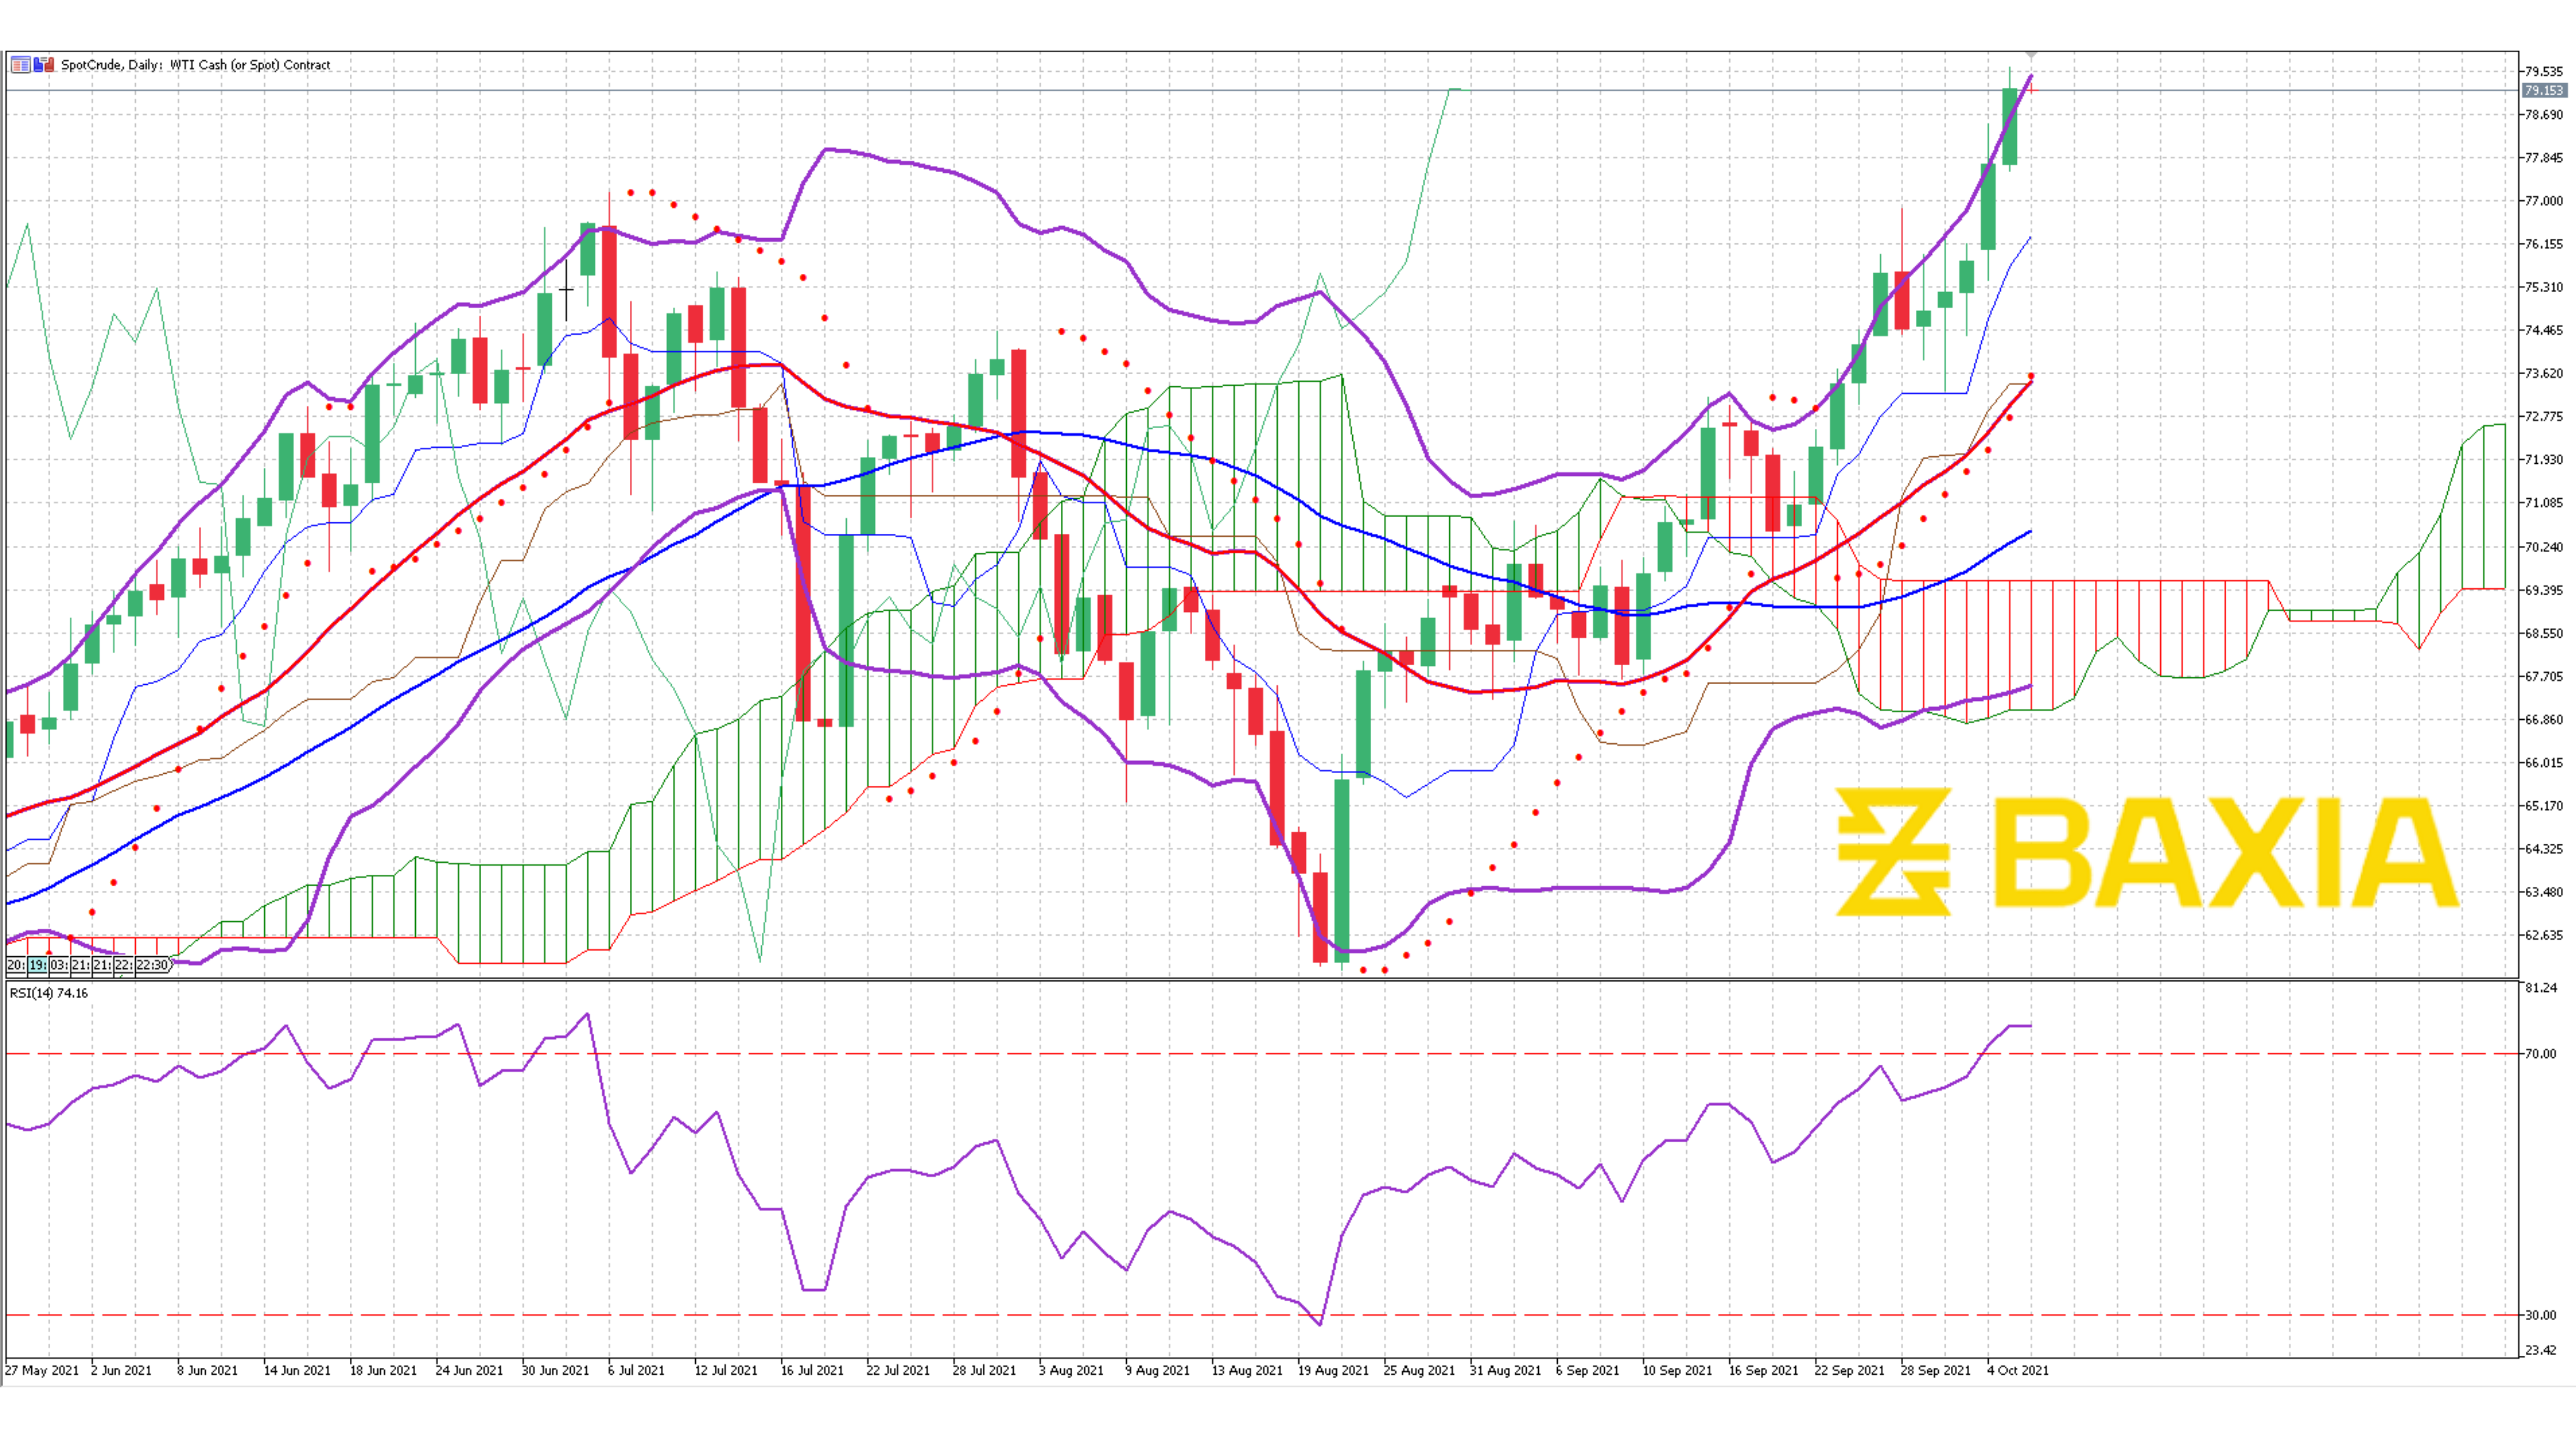
Our parabolic SAR indicator suggests that the price will continue to increase; however, this is a lagging indicator. The short and long-term moving averages continue moving up, and the gap between the lines is still rising due to the excellent performance of the commodity in the last 32 trading sessions.
We love to hear new ideas from traders and want to know what you think!
If you like this topic and want to suggest future topics that you find helpful, let us know by clicking the ‘submit your feedback’ button below.

Trading foreign exchange on margin carries a high level of risk, and may not be suitable for all investors. Before deciding to trade foreign exchange you should carefully consider your investment objectives, level of experience, and risk appetite.
Nothing contained in this website should be construed as investment advice. Any reference to an investment's past or potential performance is not, and should not be construed as, a recommendation or as a guarantee of any specific outcome or profit.